Forex Forums | ForexLasers.com |
|
|||||||
 |
|
|
LinkBack | Thread Tools | Search this Thread |
|
#41
 12-07-2017, 11:14
|
||||
|
||||
|
GBP/USD: pound received support
12/07/2017 Current dynamics After the National Bureau of Statistics of Great Britain presented today very encouraging data from the UK labor market, the pound strengthened in the foreign exchange market. According to the data provided, for the period March-May unemployment fell to 4.5%, the lowest level since 1975, while the number of unemployed fell by 64,000, and the number of workers reached a record high. The average salary (excluding premiums) in March-May increased by 2% (with the forecast for growth of 1.8%). However, real wages in the UK remain, nevertheless, at a low level, as consumer prices grew faster than wages. In May, inflation was 2.9%, demonstrating the fastest growth rates in almost four years. The decline in the British pound on the outcome of the referendum on Brexit provoked an increase in import prices and spurred inflation. At a meeting of the Bank of England in June, three of the eight members of the Bank of England's Monetary Policy Committee voted to tighten monetary policy. The Bank of England Governor Mark Carney also signaled the likelihood of policy tightening in the future. However, for this, according to Karni, requires a strong growth of companies' investments, which can neutralize the slowdown in the pace of consumer spending. But there is another opinion on the tightening of monetary policy in the UK. So, today the Deputy Governor of the Bank of England Ben Broadbent said that, given the uncertainty of the economic outlook, "at the moment it is not worth making a decision (regarding raising rates)", and "there are many factors that can not be accurately assessed". This week, market participants will closely follow the speech (Wednesday and Thursday 14:00 (GMT)) of the Fed Chairman Janet Yellen. It is likely that in her report before the US Congress she will confirm the Fed's intention to tighten monetary and credit policy. In this case, the strengthening of the US dollar will resume. Also today, from 14:00 (GMT), volatility in the foreign exchange market could rise sharply due to the publication of the Bank of Canada's interest rate decision, which must be taken into account when making trading decisions. *)An advanced fundamental analysis is available on the Tifia website at tifia.com/analytics Support and resistance levels After the publication of data on the UK labor market, the pair GBP / USD rebounded from the key support level 1.2810 (EMA200 on the daily chart) and is currently trading above support level 1.2850 (EMA200 on the 4-hour chart). However, the positive momentum may not be enough to restore the positive dynamics of the pair GBP / USD. Indicators OsMA and Stochastics on the daily chart turned to short positions, signaling the continuation of the downward dynamics. The support levels of 1.2850, 1.2810 are good deterrent levels from the further decline of the GBP / USD pair. In case of breakdown of the support level 1.2745 (EMA144 on the daily chart), the GBP / USD decline will accelerate to targets near the levels of 1.2590 (June lows and the lower limit of the uplink on the weekly chart), 1.2365, 1.2110. If the positive dynamics of the pound returns, then the GBP / USD pair will resume growth with targets of 1.2980, 1.3050 (May highs), 1.3100, 1.3210 (Fibonacci level 23.6% correction to the pair GBP / USD decline in the wave, which began in July 2014 Near the level of 1.7200 and the upper limit of the rising channel on the weekly chart). Support levels: 1.2850, 1.2810, 1.2745, 1.2700, 1.2640, 1.2590, 1.2550, 1.2365, 1.2110 Resistance levels: 1.2910, 1.2980, 1.3050, 1.3100, 1.3210, 1.3300 Trading Scenarios Sell Stop 1.2830. Stop-Loss 1.2870. Take-Profit 1.2810, 1.2745, 1.2700, 1.2640, 1.2590, 1.2485, 1.2365 Buy Stop 1.2870. Stop-Loss 1.2830. Take-Profit 1.2910, 1.2980, 1.3050, 1.3100, 1.3210, 1.3300   *) For up-to-date and detailed analytics and news on the forex market visit Tifia company website tifia.com 
|
|
#42
13-07-2017, 10:30
|
||||
|
||||
|
AUD/USD: near 4-month highs
13/07/2017 Current dynamics Today, the pair AUD / USD again approached the annual highs of 4-month old near the 0.7745 mark. The Australian currency is growing, receiving double support from strong data on China's foreign trade balance and after the publication of the consumer price inflation indicator in Australia. According to data presented today (04:00 GMT + 3) by the Melbourne Institute, expectations for consumer price inflation rose 4.4% in July (the previous value + 3.6%). The high value of the indicator is positive for AUD. A little later (05:00 GMT + 3) came out strong indicators on China's trade balance. According to the data provided, exports in June increased (for the fourth consecutive month) by 11.3% compared to the same period of the previous year after an increase of 8.7% in May. The annual import growth in June was 17.2% after the growth of 14.8% in May (the forecast was + 12.4% compared to the same period of the previous year). China's foreign trade surplus rose to $ 42.77 billion in June from $ 40.81 billion in May, with a forecast of $ 44.2 billion; By about 5%. China is the largest trade and economic partner and buyer of primary commodities in Australia. Iron ore and coking coal account for about 30% and 12% of Australia's commodity exports, respectively. And most of the Australian raw materials exports are directed to China. Therefore, strong macroeconomic indicators from China have a positive impact on the quotes of the Australian currency. At the same time, the AUD / USD pair is growing on the weakening of the US dollar after yesterday, Fed Chairman Janet Yellen in his report in the US Congress confirmed plans for a "gradual" increase in interest rates. However, in her opinion, it is necessary to adhere to the gradual way of raising interest rates in the next few years. Today, Janet Yellen speaks to the US Senate Banking Committee. Investors are mostly skeptical about further tightening of monetary policy in the US against the backdrop of a slowdown in inflation. It is likely that today Janet Yellen will not say anything new. Market participants are ready for the December rate increase in the US, but will closely follow the performance of Yellen. Any hints from Yellen about the possibility of raising the rate in September will cause a sharp increase in the US dollar. Janet Yellen's speech will begin at 17:00 (GMT + 3). *)An advanced fundamental analysis is available on the Tifia website at tifia.com/analytics Support and resistance levels At the beginning of today's European session, the pair AUD / USD is trading at the upper border of the rising channel on the daily chart, closely approaching the annual highs near the 0.7745 mark. The positive dynamics of the AUD / USD pair is maintained above the key support level of 0.7530 (EMA200, EMA144 on the daily chart). The targets for the AUD / USD pair in case of its further growth will be the levels of 0.7780 (EMA144 on the weekly chart), 0.7840 (the Fibonacci retracement level of 38.2% correction to the wave of decline from July 2014, the minimum wave is near 0.6830), 0.8000 (EMA200 On a weekly chart). Only in case of breakdown of short-term support levels of 0.7585 (EMA200 and the bottom line of the uplink on the 4-hour chart), 0.7635 (EMA200 on the 1-hour chart) can we speak about the return of the downward dynamics of the AUD / USD pair. In the case of the development of the downward dynamics and breakdown of the key support level 0.7535 (EMA200, EMA144 on the daily chart), the bearish trend will again prevail in the dynamics of the AUD / USD pair. In this case, the targets will be the levels of 0.7460 (the Fibonacci level is 23.6% of the correction to the wave of the pair's decline since July 2014, the minimum wave is near 0.6830), 0.7420, 0.7375, 0.7330 (November and May lows). Support levels: 0.7710, 0.7635, 0.7585, 0.7535, 0.7500, 0.7460, 0.7420, 0.7375, 0.7330 Levels of resistance: 0.7750, 0.7780, 0.7840, 0.8000 Trading Scenarios Sell Stop 0.7690. Stop-Loss 0.7750. Take-Profit 0.7635, 0.7600, 0.7585, 0.7535, 0.7460, 0.7420, 0.7375, 0.7330 Buy Stop 0.7750. Stop-Loss 0.7690. Take-Profit 0.7780, 0.7840, 0.7900, 0.8000   *) For up-to-date and detailed analytics and news on the forex market visit Tifia company website tifia.com
|
|
#43
14-07-2017, 11:00
|
||||
|
||||
|
S&P500: pending key inflation data
14/07/2017 Current dynamics Today, the main US stock indexes are traded in a narrow range in anticipation of the publication of key US inflation indicators. Investors will also closely monitor the reporting of the largest US banks. Today begins the reporting period for US banks, including Citigroup Inc., J.P. Morgan Chase & Co., Wells Fargo & Co. and PNC Financial Services Inc. Shares of American banks in the last three weeks gained almost 6% in the hope that a gradual increase in interest rates will lead to an increase in their income from lending. The Fed has planned another rate hike this year, but some investors are still skeptical about further tightening of monetary policy. Fed executives are calling for waiting for more robust signals about inflation in the US to continue raising interest rates in the US. This opinion was yesterday held by the President of the Federal Reserve Bank of Dallas Robert Kaplan, President of the Federal Reserve Bank of Minneapolis Neil Kashkari, a member of the Board of Governors of the Federal Reserve, Lael Brainard. In general, so far the positive dynamics of the indices against the backdrop of the growth of corporate profits remains. However, the rhetoric of the world's central banks has changed toward a more stringent monetary policy. It seems that, amid the strengthening of the world economy, stimulating programs in countries with the largest economies may soon be curtailed. And this is a negative factor for the stock markets. At (12:30 GMT) the US consumer price index and retail sales report are published. Investors will pay close attention to the data to understand whether the recent weakening of inflation is temporary. The reaction of the dollar and the US stock market to inflation data is acute, given that these data, along with data on the labor market and GDP, play a key role in the decision making by the Fed at the interest rate. It is expected that in June, the consumer price index (CPI) rose by 0.1% (after a decrease of 0.1% in May) and by 1.7% in annual terms. Such an increase in inflation will not satisfy the Fed and will help to weaken the US dollar, but will also support American stock markets. But if the consumer price index comes out in June with better indicators than the forecast, the dollar will strengthen in the foreign exchange market, while stock indices, including the S & P500 index, will decrease. *)An advanced fundamental analysis is available on the Tifia website at tifia.com/analytics Support and resistance levels With the opening of today's trading day, the S & P500 index slightly decreased, trading in a narrow range near the mark of 2445.0. The OsMA and Stochastic indicators on the daily chart are on the buyers side, however, on the 4-hour, 1-hour chart, the indicators turned to short positions, signaling an overdue correction after many days of growth. In the event of a downward correction, the S & P500 may fall to the support levels 2433.0 (EMA200 on the 1-hour chart), 2426.0 (EMA200 on the 4-hour chart and the bottom line of the uplink on the daily chart). The OsMA and Stochastic indicators on the weekly chart also turned to short positions. If the negative trend increases, then the deeper decline of the index to support levels of 2405.0 (June and July lows), 2390.0, 2355.0, near which the bottom line of the rising channel passes on the weekly chart, is possible. While the price is above 2325.0 (EMA200 on the daily chart), 2305.0 (Fibonacci level of 23.6% correction to growth since February 2016), the positive dynamics of the index remains. In the event of a breakdown of the resistance level 2452.0 (June and year highs), the growth of the index will resume. Support levels: 2433.0, 2426.0, 2405.0, 2390.0, 2355.0, 2325.0, 2305.0 Resistance level: 2452.0 Trading Scenarios Sell Stop 2420.0. Stop-Loss 2432.0. Objectives 2415.0, 2405.0, 2390.0, 2355.0, 2320.0, 2305.0 Buy Stop 2432.0. Stop-Loss 2420.0. Objectives 2438.0, 2452.0, 2500.00   *) For up-to-date and detailed analytics and news on the forex market visit Tifia company website tifia.com
|
|
#44
17-07-2017, 11:50
|
||||
|
||||
|
DJIA: the indices rose after the publication of inflation data
17/07/2017 Current dynamics After Friday's weak data on retail sales and inflation in the US were published, the main US stock indexes rose. As the US Department of Labor reported on Friday, the consumer price index (CPI) remained unchanged in June compared to the previous month (0.0% in June, + 1.6% in annual terms, vs forecast +0.1% and +1.7%, respectively). Retail sales in June, according to the data presented, fell by 0.2% compared to May (sales were expected to increase by 0.1%). These data are key for the Fed in the matter of making an interest rate decision. Investors bought shares and bonds on Friday, as weak data on retail sales and inflation suggest that the Federal Reserve is unlikely to raise interest rates and reduce assets in the coming months. Against the background of purchases of 10-year US Treasury bonds, their profitability declined from 2.319% to 2.298% after the publication of macro data. The S & P500 index rose 0.5% on Friday to 2459.00 points. The Dow Jones Industrial Average index increased by 0.4% to 21637.00 points. Last week was the most successful for both indices from the end of May. So, S&P500 for the week gained 1.4%, and DJIA grew by 1%. On Friday, the reporting season for US banks began, the results were published by Citigroup Inc., J.P. Morgan Chase & Co., Wells Fargo & Co. and PNC Financial Services Inc. Hopes for high financial results of companies for the 2-nd quarter also support the US stock indexes. Shares of US banks over the past three weeks have risen in price. Also last week, shares of technology companies in the United States grew. The subindex of the technology sector of the S & P500 grew by 3.8%, showing the best weekly result in 2017. Now, after the publication of the data, the probability of an increase in the rate in December, according to the CME Group, fell below the level of 50%. President of the Federal Reserve Bank of Dallas Robert Kaplan on Thursday made it clear that he would like to wait for the acceleration of inflation before raising interest rates again. It is likely that the Fed in the future may be more prudent approach to raising rates. If the Fed again adheres to mild rhetoric regarding monetary policy, it will stimulate the US stock market to further growth. *)An advanced fundamental analysis is available on the Tifia website at tifia.com/analytics Support and resistance levels DJIA updated its annual highs on Friday and reached a new absolute maximum near the mark of 21680.0. The DJIA index continues to grow steadily, starting from February 2016 and trading in the ascending channels on the daily and weekly charts. So far, the index is trading above the key support level of 20300.0 (EMA200 on the daily chart, as well as the Fibonacci level of 23.6% correction to the growth in the wave from the level of 15660.0 after rebounding in February this year to the collapse of the markets since the beginning of the year. The maximum of this wave and the Fibonacci level 0% is near the mark of 21536.0), its medium-term positive dynamics is preserved. The long positions in the DJIA index trade are relevant. Against the background of low inflation in the US and the Fed's predilection, in connection with this, to a cautious approach in the matter of further interest rate hikes, the further growth of the DJIA index is likely. Only in case of breakdown of the support level of 21360.0 (EMA200 on the 4-hour chart) can we again return to consideration of short positions on the DJIA index. And only in case of breakdown of the support level of 19380.0 (Fibonacci level of 38.2%) can we speak about the breakdown of the bullish trend. Support levels: 21510.0, 21360.0, 21100.0, 20600.0, 20300.0 Resistance levels: 21680.0, 22000.0 Trading Scenarios Buy Stop 21690.0. Stop-Loss 21500.0. Take-Profit 21700.0, 21800.0, 22000.0 Sell Stop 21500.0. Stop-Loss 21690.0. Take-Profit 21360.0, 21100.0, 21000.0, 20600.0   *) For up-to-date and detailed analytics and news on the forex market visit Tifia company website tifia.com
|
|
#45
18-07-2017, 11:15
|
||||
|
||||
|
GBP / USD: The pound fell after the publication of inflation data
18/07/2017 Current dynamics After the data on inflation in the UK were published at the beginning of today's European session, the pound fell sharply in the foreign exchange market. According to the National Bureau of Statistics, the UK consumer price index in June rose by 2.6% compared with the same period last year after rising by 2.9% in May. Although annual inflation remains well above the target level of the Bank of England at 2%, and consumer prices are growing stronger than the level of wages. The price pressure on the company is already decreasing for the 5th consecutive month. Wage growth rates lag behind inflation, so the British have already reduced their spending, which led to a slowdown in the economy in the first quarter of this year. The fall in household incomes, caused by a sharp drop in the pound, is a deterrent for the Bank of England in raising interest rates, despite high inflation. Today at 13:30 (GMT) the speech of the head of the Bank of England Mark Carney is scheduled. It will be interesting to hear what he thinks about the future plans of the Bank of England against the background of inflation data presented today. The pound fell sharply today and against the US dollar, despite the fact that the dollar fell significantly today in the foreign exchange market after it became known that the Obamacare health program will not be canceled in the near future. This means that other Trump legal initiatives (revision of the tax code or fiscal stimulus) may also run into obstacles. The ICE dollar index, reflecting the value of the dollar against a basket of six other currencies, fell by 0.3% on Tuesday, to a 10-month low. Since the beginning of this year, the dollar index fell by 7.2%. As the Deputy Governor of the Bank of England Ben Broadbent said last week, "at the moment, it is not worth making a decision (regarding raising rates). There are many factors that can not be measured accurately, "given the uncertainty of the prospects for the UK economy. *)An advanced fundamental analysis is available on the Tifia website at tifia.com/analytics Support and resistance levels After today's data on inflation, the pair GBP / USD fell sharply. The fall of the pair was approximately 100 points. Previously, the GBP / USD pair rose, updating the annual high near the 1.3120 mark. Indicators OsMA and Stochastics on the 1-hour, 4-hour charts turned to short positions, signaling the beginning of a downward correction. If the decline continues, the GBP / USD pair will go to support levels 1.2980 (EMA200 on the 1-hour chart), 1.2880 (2880 (EMA200 and the bottom line of the uplink on the 4-hour chart). In the case of breakdown of the support level 1.2820 (EMA200 on the daily chart), the GBP / USD decline will accelerate to targets near the levels of 1.2590 (June lows and the lower limit of the uplink on the weekly chart), 1.2365, 1.2110. The positive dynamics of the GBP / USD pair persists while it is trading above the key support level of 1.2820 (EMA200 on the daily chart). In case of breakdown of the local resistance level 1.3120, the GBP / USD pair will resume growth with the targets of 1.3210 (Fibonacci level 23.6% correction to the GBP / USD decline in the wave, which began in July 2014 near the level of 1.7200 and the upper limit of the rising channel on the weekly chart), 1.3300 (the upper line of the ascending channel on the weekly chart). Support levels: 1.3000, 1.2980, 1.2940, 1.2880, 1.2820, 1.2765, 1.2700, 1.2640, 1.2590, 1.2550, 1.2365, 1.2110 Resistance levels: 1.3050, 1.3100, 1.3120, 1.3210, 1.3300 Trading Scenarios Sell Stop 1.3000. Stop-Loss 1.3055. Take-Profit 1.2980, 1.2940, 1.2880, 1.2820, 1.2765, 1.2700, 1.2640, 1.2590, 1.2550, 1.2365, 1.2110 Buy Stop 1.3055. Stop-Loss 1.3000. Take-Profit 1.3100, 1.3120, 1.3210, 1.3300   *) For up-to-date and detailed analytics and news on the forex market visit Tifia company website tifia.com
|
|
#46
19-07-2017, 11:05
|
||||
|
||||
|
XAG/USD: precious metals rose in price
19/07/2017 Current dynamics Against the backdrop of a sharp weakening of the US dollar and again increased political uncertainty in the US, precious metals are once again rising in price. Last week, the dollar showed the strongest decline since May. Chairman of the US Federal Reserve Board, Janet Yellen, was more cautious in favor of further raising interest rates in the US. Published on Friday, inflation data in the US, which turned out to be much weaker than expected, triggered large-scale sales of the US dollar. At the moment, investors estimate the 48% probability that the Fed will perform another rate hike this year. Yesterday, the dollar received another blow after the news that the Republicans had failed to abolish the Obamacare Act. Another failure of the Republicans again brought back concerns about the ability of the presidential administration to fulfill pre-election promises to stimulate the US economy. The political uncertainty, aggravated in the US, weak US macroeconomic indicators, which contribute to the weakening of the dollar, once again raise investors' interest in buying precious metals, including silver. Precious metals do not bring investment income. However, in the context of increasing economic or political uncertainty, the demand for precious metals as a safe haven is growing. We are waiting for the data from the USA today. At 12:30 (GMT), data from the US primary housing market for June. The indicator of the dynamics of new building permits is an important indicator of the housing market. If the data prove to be better than the forecast (1.20 million new permits), the dollar will strengthen on the foreign exchange market. Otherwise, and with the arrival of weak data, the US dollar will decrease, and silver prices will rise. *)An advanced fundamental analysis is available on the Tifia website at tifia.com/analytics Support and resistance levels The pair XAG / USD was able to break through the short-term resistance level at 16.02 and is growing, pushing back at the end of last week from the support level of 15.60. Nevertheless, more confident growth of the pair XAG / USD and consideration of long positions on it can be said after the pair XAG / USD consolidates above the important short-term resistance level of 16.37 (EMA200 on the 4-hour chart). In the meantime, the negative medium-term dynamics prevails, while the pair XAG / USD is traded in the descending channel on the daily chart, well below the resistance level of 17.05 (EMA200, EMA144 on the daily chart). The lower boundary of the channel passes near the support level of 14.30 (the minimums of January 2016). In case of breakdown of the support level of 16.02, the fall of the pair XAG / USD will resume. The level of 14.30 will become the target mark with a further decline in the pair XAG / USD. A more distant goal is the level of 13.65 (the minimum of the global wave of decline in the pair XAG / USD from September 2012). Support levels: 16.02, 15.60, 15.25, 14.90, 14.30, 13.65 Resistance levels: 16.37, 16.68, 17.05 Trading Scenarios Sell Stop 16.10. Stop-Loss 16.38. Take-Profit 16.00, 15.25, 14.90, 14.30 Buy Stop 16.38. Stop-Loss 16.10. Take-Profit 16.68, 17.05, 17.10   *) For up-to-date and detailed analytics and news on the forex market visit Tifia company website tifia.com
|
|
#47
20-07-2017, 10:46
|
||||
|
||||
|
USD/JPY: Bank of Japan did not change monetary policy
20/07/2017 Current dynamics As expected, the Bank of Japan has upheld its monetary policy, while once again lowering the forecast for inflation. Now, the Bank of Japan expects that inflation will reach 2% around 2019 fiscal year, that is a year later than previously forecast. Last month, the Bank of Japan did not begin to change its monetary policy, retaining the aggressive incentive program, which represents the purchase of government bonds by about 80 trillion yen per year (720 billion US dollars), as well as maintaining the target yield of 10-year Japanese bonds around 0% and maintaining a short-term rate of -0.1%. This decision was expected by the majority of market participants and economists. The economy of Japan shows growth, albeit at a modest pace. However, inflation fluctuates near zero levels against the central bank's target level of 2%. During today's press conference, the Governor of the Bank of Japan Haruhiko Kuroda called the target level of 2% "world standard". "This level is necessary to maintain a stable exchange rate", Kuroda said and reiterated that the Bank of Japan continues to adhere to this target level. The lower inflation forecasts indicate the likelihood that the Bank of Japan will not change its monetary policy, although other central banks are inclined to tighten it, in the foreseeable future. The Japanese yen may decline due to tightening of monetary policy in other economically developed countries, which reduces the attractiveness of the yen for investors. The Japanese yen can still be in demand, but only as a safe haven. *)An advanced fundamental analysis is available on the Tifia website at tifia.com/analytics Support and resistance levels Not having reached the key support level 111.50 (ЕМА200, ЕМА144 on the daily chart), the pair USD / JPY has grown today after the publication of the decision of the Bank of Japan. The pair USD / JPY broke through the important short-term resistance level 112.20 (EMA200 on the 4-hour chart). In case of breakdown of one more important level of resistance 112.60 (EMA200 on the 1-hour chart), the pair USD / JPY growth may continue to the upper boundary of the range between the levels 114.40 and 108.40. If the pair USD / JPY can gain a foothold above 114.40, then its growth may continue with the targets 116.00 (Fibonacci level 61.8%), 118.60 (December and January highs), 121.30 (highs in January 2016) against the background of the difference in monetary policy of the Fed and Bank of Japan. Nevertheless, against the backdrop of the long-term bullish trend of the pair USD / JPY periods of active downward correction are highly probable, when the demand for yen rises in periods of geopolitical and financial instability. The reverse scenario involves a breakdown of the support level of 111.50 and a further decline in the pair USD / JPY with the target of 110.10 (Fibonacci level of 38.2% of the correction for the pair growth since August of last year and the level of 99.90), 108.40 (the lower bound of the range). Support levels: 111.50, 111.00, 110.10, 109.00, 108.40, 108.00, 106.50 Resistance levels: 112.60, 113.00, 114.40, 115.00, 116.00 Trading Scenarios Buy Stop 112.50. Stop Loss 111.90. Take-Profit 113.00, 114.40, 115.00, 116.00, 117.00, 118.60 Sell Stop 111.90. Stop Loss 112.50. Take-Profit 111.50, 111.00, 110.10, 109.00, 108.25, 106.50   *) For up-to-date and detailed analytics and news on the forex market visit Tifia company website tifia.com
|
|
#48
21-07-2017, 11:03
|
||||
|
||||
|
EUR/USD: The euro rose after the ECB meeting
21/07/2017 Current dynamics Today the pair EUR / USD continued its growth, started on Thursday after the ECB meeting and press conference, at which ECB President Mario Draghi spoke. He was very careful in his statements and tried not to cause unnecessary emotions for traders who traded the euro. "We studied the economic situation in the Eurozone and noticed the acceleration of economic growth with still slow inflation", Draghi said. He also noted that the future of the QE program during the two-day ECB meeting was not discussed, and "the discussion of this topic should begin in the fall". Investors took the words of Draghi as a signal to buy the euro. The pair EUR / USD reached almost 2-year high at 1.1679 in the first half of the European session. The growth of the pair was also promoted by Bloomberg's announcement that transactions in the companies belonging to the US president will be checked as part of the Trump investigation. This publication has increased the uncertainty surrounding the presidential administration and its plans to accelerate economic growth in the United States. Meanwhile, investors continue to evaluate ECB President Mario Draghi's comments on Thursday and expect ECB plans to wind down the stimulus program to be released in September. Meanwhile, according to the results of the poll published on Friday, in the next two years, inflation in the Eurozone will not reach the target level set by the ECB slightly below 2.0%. Quarterly survey conducted by the ECB among economists showed that this year inflation will be 1.5%, in the next - 1.4%, and in 2019 - 1.6%. According to the latest data, for the year prices rose by only 1.3%. Forecasts for each year were lowered by 0.1 percentage points compared to the results of the previous poll, which was held in April. Yesterday, Mario Draghi again stressed that the ECB leadership will be extremely cautious approach to the issue of curtailing its stimulus measures, focusing on the growth rate of inflation in the Eurozone. And the more inflation will be below the target level, the further the ECB will postpone the decision on curtailing the stimulus program and raising the interest rate in the Eurozone. And this is a negative factor for the euro. Today, at the end of the trading week, some investors will want to record profits in short positions on the US dollar, which may provoke some strengthening. It is likely that this may occur closer to the end of the US trading session. *)An advanced fundamental analysis is available on the Tifia website at tifia.com/analytics Support and resistance levels Yesterday, the pair EUR / USD broke through the key resistance level near the 1.1610 mark (EMA200 on the weekly chart), continuing to trade in the uplink on the daily chart. The positive dynamics of the EUR / USD pair remains. In case of consolidation above resistance level 1.1610, the pair EUR / USD growth may continue. In this case, the target will be the resistance level 1.1785 (the Fibonacci retracement level of 38.2% of the corrective growth from the lows reached in February 2015 in the last wave of the global fall from 1.3900). The reverse scenario implies a decrease to the zone below the level of 1.1285 (Fibonacci level of 23.6%), which will increase the risks of return to the downtrend. In the case of a breakdown of the short-term support level 1.1500 (EMA200 and the bottom line of the uplink on the 1-hour chart) and the acceleration of the downward dynamics, this scenario may develop. Support levels: 1.1610, 1.1500, 1.1400, 1.1370, 1.1285, 1.1240, 1.1120, 1.1000 Resistance levels: 1.1650, 1.1700, 1.1785 Trading Scenarios Sell Stop 1.1610. Stop-Loss 1.1685. Take-Profit 1.1500, 1.1400, 1.1370, 1.1285, 1.1240, 1.1120 Buy Stop 1.1685. Stop-Loss 1.1610. Take-Profit 1.1700, 1.1785, 1.1800   *) For up-to-date and detailed analytics and news on the forex market visit Tifia company website tifia.com
|
|
#49
24-07-2017, 11:19
|
||||
|
||||
|
Brent: the plan to reduce the excess supply is not working.
24/07/2017 Current dynamics On Monday in St. Petersburg is a meeting of some members of OPEC and countries outside the cartel. Saudi Energy Minister Khaled Al-Falih and Russian Energy Minister Alexander Novak will chair this meeting. The risk of failure of a deal to reduce oil production is in full swing, although, according to the Saudi Energy Minister, the degree of observance of quotas for oil production in the history of OPEC is a record, and the total degree of compliance with oil production quotas for 6 months was 98%. It was assumed that the agreement would reduce world oil production by almost 1.8 million barrels a day and lead to a reduction in excess supply in the market. In recent days, there has been some recovery in prices against the weakening dollar. However, oil prices remain steadily low due to the continued oversupply. It seems that the oil cartel still does not know how to deal with the US extraction, which remains outside the control of OPEC. Producers of oil shale in the US took advantage of the situation and, lowering the cost, increased production. Quotations of Brent crude oil fell 2.5% to $ 48.06 per barrel on Friday, due to doubts about OPEC's ability to restore balance on the market. According to the report of the oilfield service company Baker Hughes, presented on Friday, which is an important indicator of the activity of the oil sector of the US economy and significantly affects the quotes of oil prices, the number of active drilling platforms in the US is 764 units. The US increased production by 750,000 barrels a day to 9.3 million barrels a day, the highest since summer 2015. In fact, by the efforts of the US alone, more than a third of the reduced production was offset. According to OPEC representatives, one should not expect that some important actions will be taken Monday, although Nigeria, which, being a member of OPEC, remained outside the framework of the agreement, agreed to limit oil production to the level of 1.8 million barrels a day. Negotiations on limiting production in Libya and Nigeria are still underway. It is likely that without additional measures, OPEC will not be able to reverse the situation with an excessive supply of oil. And against this background, oil prices will be subject to further decline. As long as the dollar stabilizes in the foreign exchange market, the pressure on oil prices will increase. *)An advanced fundamental analysis is available on the Tifia website at tifia.com/analytics Support and resistance levels The price of Brent crude continues, meanwhile, to move in the uplink on the daily chart near the important support level of 48.50 (EMA200 on the 4-hour chart). Indicators OsMA and Stochastics on the 1-hour, 4-hour charts turned to long positions. If the price can consolidate above the short-term resistance level 49.10 (EMA50 on the daily chart), its growth may continue to the resistance level of 50.70 (EMA200, EMA144 on the daily chart, and the Fibonacci level of 61.8% correction to the decline from the level of 65.30 from June 2015 Year to the absolute minimums of 2016 near the mark of 27.00). Nevertheless, while the price is below the level of 50.70, the negative dynamics prevails. In case of breakdown of the 48.00 support level and renewal of the decline, the targets will be support levels of 47.70, 46.20 (50% Fibonacci level), 44.50 (year lows). The more distant goal is the level 41.70 (the Fibonacci level of 38.2% and the lower boundary of the descending channel on the weekly chart). Only in the case of fixing the price above the level of 50.70 can we again consider medium-term long positions. Support levels: 48.50, 48.00, 47.70, 46.20, 45.50, 44.50, 41.70 Levels of resistance: 49.10, 49.85, 50.70, 51.00 Trading scenarios Sell Stop 48.40. Stop-Loss 49.20. Take-Profit 48.00, 47.70, 46.20, 45.50, 44.50, 41.70 Buy Stop 49.20. Stop-Loss 48.40. Take-Profit 49.60, 50.00, 50.70, 51.00   *) For up-to-date and detailed analytics and news on the forex market visit Tifia company website tifia.com
|
|
#50
25-07-2017, 11:18
|
||||
|
||||
|
EUR/USD: The dollar remains weak
25/07/2017 Current dynamics "Core inflation is still slow and has not yet shown convincing signs of acceleration. Price pressure and wage growth are still restrained, "European Central Bank board member Yves Mersch said today in Singapore. The rate of price growth in the Eurozone last month slowed to 1.3% per annum, being significantly below the target level of the ECB, which is just under 2%. Because of low inflation, the Eurozone economy still needs "very significant" incentive measures, according to Yves Mersch. Today, the pair EUR / USD resumed its growth after the release of positive macroeconomic indicators at the beginning of the European session. So, the PMI index in the manufacturing sector of the Eurozone in July was 56.8, the PMI index for the services sector - 55.4, the composite PMI - 55.8. Nevertheless, the growth of the EUR / USD pair was insignificant, as the dollar today stabilized in the foreign exchange market on the eve of the publication of tomorrow results of the Fed meeting. The index of the dollar WSJ, which reflects the value of the US dollar against the basket of 16 other currencies, slightly increased and amounted to 86.58. At 18:00 (GMT) on Wednesday will publish the decision of the Fed on the interest rate in the US. It is widely expected that the rate will remain at the same level of 1.25%. According to the latest data of the CME Group, the probability of an increase in the rate at the December meeting of the Federal Reserve is 48%. From the US, we continue to receive weak macro data, against which the Fed will be very carefully approaching the issue of further tightening of monetary policy. It is likely that the dollar will remain under pressure until the domestic political situation in the United States normalizes and macroeconomic indicators start to arrive with strong indicators. We are waiting for data from the USA today. CB Consumer Confidence is published at 14:00 (GMT). This indicator reflects the confidence of American consumers in the economic development of the country. A high level indicates an increase in the economy, while a low indicates stagnation. The previous value of the indicator is 118.9. The growth of the indicator will strengthen USD, and a decrease in value will weaken the dollar. It is expected that this indicator will come out with a value of 116.5, which will negatively affect the dollar when the forecast is confirmed. *)An advanced fundamental analysis is available on the Tifia website at tifia.com/analytics Support and resistance levels The pair EUR / USD continues to trade in the uplink on the daily chart, the upper limit of which runs near the level of 1.1720. The EUR / USD is trying to gain a foothold above the key support level 1.1610 (EMA200 on the weekly chart). The positive dynamics of the EUR / USD pair remains. The growth of the EUR / USD pair may continue. In this case, the immediate target will be the resistance level 1.1785 (the Fibonacci retracement level of 38.2% of the corrective growth from the lows reached in February 2015 in the last wave of global decline from 1.3900). An alternative scenario for the decline will be related to the breakdown of the support level 1.1610. In case of breakdown of the support level 1.1560 (EMA200 on the 1-hour chart), the pair EUR / USD may fall to support level 1.1285 (Fibonacci level of 23.6%), and in case of its breakdown, risks of return to the downtrend will grow. However, in any case, while the EUR / USD pair is above the level of 1.1030 (EMA200 on the daily chart), a bullish trend remains. Support levels: 1.1610, 1.1560, 1.1500, 1.1400, 1.1370, 1.1285, 1.1240, 1.1120, 1.1030 Levels of resistance: 1.1650, 1.1700, 1.1720, 1.1785 Trading scenarios Sell Stop 1.1590. Stop-Loss 1.1685. Take-Profit 1.1560, 1.1500, 1.1400, 1.1370, 1.1285, 1.1240, 1.1120 Buy Stop 1.1685. Stop-Loss 1.1590. Take-Profit 1.1700, 1.1720, 1.1785, 1.1800   *) For up-to-date and detailed analytics and news on the forex market visit Tifia company website tifia.com
|
|
#51
26-07-2017, 11:21
|
||||
|
||||
|
DJIA: US indices rose
26/07/2017 Current dynamics The main US stock indices remain upward, gaining support from positive companies and soft rhetoric of the Fed representatives regarding plans for further tightening of monetary policy in the US. By the end of trading on Tuesday, the DJIA index increased by 0.5%, to 21614 points, Nasdaq Composite grew by about 0.1%, S & P500 gained 0.3%. Earlier, the indices were supported by the growth of shares of American banks, which in the last month gained about 6% in the hope that a gradual increase in interest rates will lead to an increase in their loan proceeds. The growth of the indices was also helped yesterday by the rising oil prices after Saudi Arabia, which is the world's largest oil exporter, said it would cut supplies in August. The cautious rhetoric of Fed Chairman Janet Yellen and a restrained assessment of the likelihood of another rate hike this year by a number of representatives of the Fed have contributed to weakening investors' expectations of further tightening of monetary policy in the US. Given the Fed's concerns about low inflation, rates are also unlikely to be raised at the two next Fed meetings in September and October. Preserving the soft monetary policy of the Fed is beneficially reflected in the US stock market. On the other hand, the negative political situation in the US and the problems in implementing the electoral program to stimulate the US economy by the administration of the US president put pressure on the stock indices. Today, investors will be focused on the publication (at 18:00 GMT) of the Fed's decision on the interest rate. According to the CME Group, the probability of a rate hike at the July meeting is only 3%, in December - 54%. Investors will carefully study the statement of the Fed and look for signals about further plans to raise interest rates and reduce the balance of the Fed. *)An advanced fundamental analysis is available on the Tifia website at tifia.com/analytics Support and resistance levels In July, the DJIA index reached a new absolute maximum near the mark of 21680.0. At the same time, the DJIA index keeps positive dynamics and continues to grow in the ascending channels on the daily and weekly charts. The positive dynamics of the DJIA is maintained as long as the index trades above the key support level 20400.0 (EMA200 on the daily chart, as well as the Fibonacci level of 23.6% correction to the wave growth from the level of 15660.0 after rebounding in February this year to the collapse of the markets since the beginning of the year. Of this wave and the Fibonacci level of 0% is near the mark of 21536.0). The long positions in the DJIA index trade are still relevant. Only in case of breakdown of the support level 21431.0 (EMA200 on the 4-hour chart) can we again return to consideration of short positions on the DJIA index with the aim near the levels 20400.0, 20300.0 (Fibonacci level 23.6%). And only in case of breakdown of the support level of 19380.0 (Fibonacci level of 38.2%) can we speak about the breakdown of the bullish trend. Support levels: 21510.0, 21431.0, 21360.0, 21100.0, 20600.0, 20400.0, 20300.0 Resistance levels: 21680.0, 22000.0 Trading scenarios Buy Stop 21690.0. Stop-Loss 21500.0. Take-Profit 21700.0, 21800.0, 22000.0 Sell Stop 21500.0. Stop-Loss 21690.0. Take-Profit 21360.0, 21100.0, 21000.0, 20600.0   *) For up-to-date and detailed analytics and news on the forex market visit Tifia company website tifia.com
|
|
#52
27-07-2017, 11:07
|
||||
|
||||
|
USD / CHF: the franc is down throughout the market
27/07/2017 Current dynamics As you know, the Fed did not change its monetary policy at its July meeting and kept the key rate in the range of 1% -1.25%. The decision to keep the current monetary policy unchanged was unanimously adopted and was published yesterday at 18:00 (GMT). The index of the dollar WSJ, reflecting the value of the dollar against the basket of 16 currencies, declined immediately after the publication of the Fed decision by 0.3%, to 86.42. The decision of the Fed was expected, however, the US dollar showed a large-scale decline in the foreign exchange market. With the opening of today's trading day, the dollar continued to decline in the foreign exchange market. However, it is worth paying attention to the fact that together with the dollar since the beginning of the European session, the Swiss franc also began to decline. It was a safe haven, although it significantly lost this quality due to the NBS's actions in the foreign exchange market, the franc, along with gold and the yen, was actively bought recently due to the continuing political uncertainty in the US. The Swiss National Bank has set a negative deposit rate, hoping that this will reduce the attractiveness of Swiss assets for international investors. Frack is usually strengthened during times of economic and political instability, thanks to Switzerland's strong economy, low levels of its debt and the stability of its political system. For the export-oriented Swiss economy, the exchange rate is especially important. A large share of its exports falls on the Eurozone, China, the United States and the rising franc leads to a rise in the price of Swiss goods. After this week's meeting of the Fed, the dollar significantly weakened in the foreign exchange market, while purchases of assets-shelters, including francs, increased significantly. The Swiss National Bank has traditionally stated that the Swiss franc is overbought, consistently advocating a soft monetary policy in the country. As a result of the efforts of the Swiss National Bank aimed at curbing the growth of its currency, its foreign exchange reserves grew to about 700 billion francs (735 billion US dollars). However, investor purchases continue. At the beginning of today's European session, there is a sharp decline in the franc, and to all major currencies, including against the yen, the dollar. It is possible that the NBS conducts another currency intervention, which it never announces either before or after. From the news for today we are waiting for the data from the USA. At 12:30 (GMT) a block of important macro data will be published: the weekly report of the US Department of Labor, containing data on the number of initial applications for unemployment benefits, orders for durable goods excluding transport in the US in June. The result above the expected indicates a weak labor market, which has a negative impact on the US dollar. The forecast is expected to increase to 240,000 versus 233,000 for the previous period, which should negatively affect the dollar. *)An advanced fundamental analysis is available on the Tifia website at tifia.com/analytics Support and resistance levels After reaching new annual lows near the 0.9445 mark at the end of last week, the pair USD / CHF rose during the last 4 trading sessions. Today, the pair USD / CHF is also actively growing since the beginning of the European trading session. At the beginning of the European session, the pair USD / CHF is trying to gain a foothold above the short-term resistance level 0.9540 (EMA200 on the 1-hour chart). Indicators OsMA and Stochastics on the 1-hour, 4-hour, daily charts turned to long positions. However, in order to break the bearish trend, the USD / CHF pair needs, first of all, to gain a foothold above the levels of 0.9620 (EMA200 on the 4-hour chart), 0.9650 (Fibonacci level of 23.6% of the upward correction to the last global decline wave from December 2016 and from the level 1.0300). If the price falls below the 0.9540 level, the USD / CHF decline may resume within the descending channel on the daily chart. The lower boundary of this channel passes near the support level 0.9400. This level will become the goal in case of resumption of the pair USD / CHF decline. The strong negative dynamics prevails. The main dynamics of the pair USD / CHF will still be connected with the dynamics of the dollar in the foreign exchange market. In the meantime, the dollar is weak. Support levels: 0.9540, 0.9500, 0.9440, 0.9400 Resistance levels: 0.9620, 0.9650, 0.9670, 0.9690, 0.9730, 0.9840, 0.9875 Trading Scenarios Buy Stop 0.9610. Stop-Loss 0.9560. Take-Profit 0.9650, 0.9670, 0.9690, 0.9730, 0.9840, 0.9875 Sell Stop 0.9560. Stop-Loss 0.9610. Take-Profit 0.9540, 0.9500, 0.9440, 0.9400   *) For up-to-date and detailed analytics and news on the forex market visit Tifia company website tifia.com
|
|
#53
28-07-2017, 10:32
|
||||
|
||||
|
S&P500: Shares of Technology Sector Decreased
28/07/2017 Current dynamics After the active growth the day before against the backdrop of a number of positive reports of companies about profits today The main US stock indexes are declining. Yesterday, the S & P500 and Nasdaq 100, which became the leaders in growth this year, held their worst day in three weeks. The sale of shares in technology companies pulled down not only the US, but also European and Asian stock indices. The European StoxxEurope600 Index dropped 0.9% at the beginning of trading. Shares of the US Company Amazon.com Inc., for example, yesterday fell significantly as the company reported a 77% drop in quarterly profits. Korean Kospi lost 1.7% during the Asian session, while the Australian S&P/ASX200 fell 1.4%. Also, the dynamics of US indices were affected by the next setbacks of the US presidential administration. Attempts by the US Republican Party to repeal the Law on Affordable Medical Services have failed: a package of proposals to refuse part of the provisions of this law from 2010 was not supported in the Senate. The US Department of Commerce today (12:30 GMT) will publish a preliminary estimate of GDP for the 2-nd quarter. It is expected that GDP in the US grew by 2.6% in the second quarter. If the data coincides with the forecast, they will confirm the economic recovery after the deterioration of the situation in the first three months of this year. This will support the stock indices. And vice versa. If the GDP data and the inflation indicators published simultaneously for the 2nd quarter are weaker than the forecast values, the stock indices will receive another portion of the negative and are likely to continue their decline. *)An advanced fundamental analysis is available on the Tifia website at tifia.com/analytics Support and resistance levels With the opening of today's trading day, the S & P500 index declined, continuing to develop short-term downward dynamics. Indicators OsMA and Stochastics on the daily, 4-hour and 1-hour charts turned to short positions, indicating a downward correction after many days of growth. The price broke through the short-term support level 2467.0 (EMA200 on the 1-hour chart, EMA50 on the 4-hour chart). If the negative dynamics will increase, then an additional reduction of the index to the support levels 2452.0 (EMA144), 2445.0 (EMA200 on the 4-hour chart and the bottom line of the uplink on the daily chart) is possible. Deeper decline in the index is - to the support levels of 2405.0 (June and July lows), 2390.0, 2355.0, near which the bottom line of the rising channel passes on the weekly chart. In general, the medium-term positive dynamics of the index remains. The index is growing, starting from February 2016 and trading in the upward channels on the daily and weekly charts. While the price is above 2338.0 (EMA200 on the daily chart), 2325.0 (Fibonacci level of 23.6% correction to growth since February 2016), the positive dynamics of the index remains. In the case of the breakdown of the resistance level of 2481.0 (the highs of July and the year), the growth of the index will resume. Support levels: 2452.0, 2445.0, 2405.0, 2390.0, 2355.0, 2338.0, 2325.0 Resistance levels: 2467.0, 2481.0 Trading Scenarios Sell Stop 2461.0. Stop-Loss 2474.0. Objectives 2452.0, 2445.0, 2405.0, 2390.0, 2355.0, 2338.0, 2325.0 Buy Stop 2474.0. Stop-Loss 2461.0. Objectives 2481.0, 2490.0, 2500.00   *) For up-to-date and detailed analytics and news on the forex market visit Tifia company website tifia.com
|
|
#54
31-07-2017, 10:31
|
||||
|
||||
|
Brent: the price of oil is growing for the sixth day in a row
31/07/2017 Current dynamics The report of the oil service company Baker Hughes, released on Friday, according to which the number of active drilling platforms in the US amounted to 766 units (against 764 last week), did not prevent the growth of oil prices. Brent oil was traded at the end of the trading day on Friday at a price of $ 52.21 per barrel, $ 0.7 higher than the opening price of Friday. In total, over the past week, the price for Brent crude rose $ 4 from $ 48.00 per barrel. A sharp decline in oil and oil products in the US last week (7.2 million barrels), as well as a large dollar weakening, contributes to the growth of oil prices. The meeting of some OPEC members and countries outside the cartel last week in St. Petersburg also left an imprint on the dynamics of oil prices. Saudi Arabia's oil minister Khaled Al-Falih said at the meeting that Saudi Arabia, the world leader in oil exports, intends to reduce oil exports in August to 6.6 million barrels per day from 7.46 million barrels a day recorded in 2016. Nigeria, a member of the cartel, but exempt from participation in the deal, also expressed its intention to limit production at 1.8 million barrels per day. If Saudi Arabia really further reduces oil exports, and other OPEC member countries follow its example, oil prices can restore the upward trend. This statement is also valid against the background of the weakness of the dollar. As long as the dollar stabilizes in the foreign exchange market, commodity prices, including oil, may again be under pressure. Some skepticism about the effectiveness of OPEC's actions to reduce oil production is still valid, because within OPEC there may be a split among the countries participating in the agreement. *)An advanced fundamental analysis is available on the Tifia website at tifia.com/analytics Support and resistance levels With the opening of today's trading day and at the beginning of today's European session, the price for Brent crude is close to $ 52.30 per barrel, trading in a narrow range. In the foreign exchange market there is a correction of the dollar after its strong decline last week. There is no important news on the oil market today, and an upward correction in the dollar may affect oil prices. Indicators OsMA and Stochastics on the daily and weekly charts recommend long positions. However, on the 4-hour and 1-hour charts, the indicators turned to short positions, signaling an overdue downward correction after a strong six-day price increase. The price broke through an important level of 50.70 (EMA200, EMA144 on the daily chart, EMA50 on the weekly chart, and the Fibonacci level of 61.8% correction to the decline from the level of 65.30 from June 2015 to the absolute lows of 2016 near the 27.00 mark), above which a positive dynamics. Preferred long positions with a target at 54.75 (EMA200 on the weekly chart and May highs). In the case of the breakdown of the support level of 50.70 and the resumption of the decline, the targets will be support levels of 49.70, 48.75, 48.00, 46.20 (Fibonacci 50%), 44.50 (lows of the year). The more distant goal is the level 41.70 (the Fibonacci level of 38.2% and the lower boundary of the descending channel on the weekly chart). Support levels: 52.00, 51.00, 50.70, 50.00, 49.70, 48.75, 48.00, 47.70, 46.20, 45.50, 44.50, 41.70 Levels of resistance: 53.00, 54.75 Trading Scenarios Sell Stop 51.90. Stop-Loss 52.60. Take-Profit 51.00, 50.70, 50.00, 49.70, 48.75, 48.00 Buy Stop 52.60. Stop-Loss 51.90. Take-Profit 53.00, 54.00, 54.75   *) For up-to-date and detailed analytics and news on the forex market visit Tifia company website tifia.com
|
|
#55
01-08-2017, 11:03
|
||||
|
||||
|
NZD/USD: unemployment in New Zealand remains relatively low
01/08/2017 Current dynamics Today at 21:45 (GMT) will be published data from the labor market of New Zealand. It is expected that unemployment in New Zealand declined in the second quarter by 0.1% to 4.8%. At levels below 5% unemployment in the country was in the period from 2003 to 2008. Nevertheless, unemployment of 4.9% is a significant improvement compared to the peak of 6.7% achieved after the financial crisis. The decrease in the unemployment rate and the increase in the labor force share in the total population (70.7% in the second quarter versus 70.6% in the first quarter) indicate a decrease in available resources in the labor market, which may finally lead to an increase in the level of salaries in the country, Stimulating domestic demand and GDP growth. If the data is confirmed, this will have a positive effect on the New Zealand currency. Also worth paying attention to the publication at 14:00 (GMT) of the price index for dairy products. The milk auction that was held two weeks ago indicated another growth in world prices for dairy products. The price index for dairy products, prepared by Global Dairy Trade, came out with a value of + 0.2%. The main export item of the country is dry milk. The next increase in prices will support the New Zealand currency. The New Zealand dollar in the NZD / USD pair also receives support from the declining US currency and positive data coming from China. China is the largest trade and economic partner of New Zealand and a buyer of its primary commodities, including dairy products. Strong macroeconomic indicators from China have a positive effect on the quotations of the New Zealand currency. Today, investors will also monitor the publication during the period 12:30 - 14:00 (GMT) of the important US inflation figures for June (personal income and personal consumption expenditure), as well as the ISM business activity index in the manufacturing sector of the US economy, which is an important An indicator of the state of the American economy as a whole. The result above 50 is considered positive and strengthens the USD, below 50 - as negative for the US dollar. Forecast: 56.5 in July (against 57.8 in June). If the indices come out with better indicators than the forecast, the US dollar will strengthen on the foreign exchange market. *)An advanced fundamental analysis is available on the Tifia website at tifia.com/analytics Support and resistance levels As a result of the three-month rally, the NZD / USD pair reached a new annual maximum and a resistance level of 0.7550 last week (Fibonacci level of 38.2% of the upward correction to the global wave of decline of the pair from the level of 0.8800, which began in July 2014, the low of December 2016). The pair NZD / USD very technically rebounded in mid-May from the support level of 0.6860 (Fibonacci level of 23.6%). So what next? The NZD / USD pair is in a global downtrend since July 2014. A break of 0.7550 would mean the end of the global bearish trend. Nevertheless, the current growth of the NZD / USD pair is largely due to the general weakening of the US dollar. Back in June, when the Reserve Bank of New Zealand kept interest rates unchanged at 1.75%, RBNZ Governor Graham Wheeler noted that "monetary policy will remain soft for a significant period". Now investors assess the prospects for the divergence of the directions of the monetary policy of the Fed and the RBNZ. If the Fed still confirms the intention to raise the rate in December, and the US will begin to receive positive macroeconomic data and the internal political crisis subsides, the US dollar will quickly regain its lost positions. Despite the fact that the indicators OsMA and Stochastics on the weekly and monthly charts recommend long positions, on the daily, 4-hour charts, the indicators moved to the side of sellers, signaling an overdue downward correction. While the NZD / USD pair is above the key support levels of 0.7275 (EMA200 on the weekly chart), 0.7240 (the Fibonacci level of 38.2%), its positive dynamics persists. In case of a breakdown at the level of 0.7240, the NZD / USD pair will accelerate its decline to the support level of 0.7150 (EMA200 on the daily chart). The more distant target of the decline is the support level of 0.6860 (Fibonacci level of 23.6% and the lower limit of the range located between the levels of 0.7550 and 0.6860). At the level of 0.6860 are also the minimums of December 2016 and May 2017. Support levels: 0.7455, 0.7335, 0.7275, 0.7240, 0.7150, 0.7100 Resistance levels: 0.7550 Trading Scenarios Sell Stop 0.7450. Stop-Loss 0.7520. Take-Profit 0.7335, 0.7275, 0.7240, 0.7150, 0.7100 Buy Stop 0.7520. Stop-Loss 0.7450. Take-Profit 0.7550, 0.7600   *) For up-to-date and detailed analytics and news on the forex market visit Tifia company website tifia.com
|
|
#56
02-08-2017, 10:58
|
||||
|
||||
|
EUR/USD: Inflationary pressure in the Eurozone remains weak
02/08/2017 Current dynamics According to the data published yesterday, the Eurozone's GDP in the second quarter increased by 0.6% (+ 2.1% in annual terms against + 1.9% in the previous quarter). Quarterly growth rates have become the highest since March 2015. This GDP growth indicates that the Eurozone has overcome the consequences of the financial crises of the last decade. The euro reacted rather weakly to the publication of data, and during the yesterday's trading day, the EUR / USD fell. Today, the dollar continues to recover in the foreign exchange market. However, against the euro, the dollar declined during today's Asian session. According to official data published today, the producer price index (PPI) of the Eurozone in June compared with May fell by 0.1%. The decline in producer prices in the Eurozone was noted following the results of three of the last four months. Compared to June last year, the index rose by 2.5%, but this was the weakest growth in 2017. In response to the publication, the pair EUR / USD declined, but remains positive. Suddenly, the strong recovery of the Eurozone economy in the first half of the year strengthened expectations of the curtailment of the QE program. In July, ECB President Mario Draghi called the restoration of the region's economy "strong" and promised that in the autumn the central bank's leaders would decide the fate of the bond purchase program, which ends in December. It is expected that the program will be extended for 2018, but its volumes will be reduced. At the same time, Draghi once again reminded that the level of inflation will be the basis for making a decision to reduce the stimulus program for the economy. It is necessary to be "consistent and patient", so that inflation grows to a target level of just below 2%, according to Draghi. Strengthening the same inflationary pressure in the coming months seems unlikely. Today we are waiting for the publication (12:15 GMT) of the employment report from ADP, which reflects the change in the number of employees in the US in July. Reducing the result weakens the US dollar. The growth is expected to reach 185 000 (against 158 000 in June), which should support the dollar. Also today (16:00 and 19:30 GMT) are key representatives of the Fed, members of the FOMC Loretta Meister and John Williams. Probably, they will again pay attention to the low level of inflation and will express their opinion that the Fed should be delayed with another increase in the interest rate in the US. Nevertheless, the Fed can still raise the rate again in December, despite the low level of inflation. As long as a strong labor market supports moderate wage growth, prospects for further tightening of monetary policy remain. In this regard, data on US employment on Friday may be very important. *)An advanced fundamental analysis is available on the Tifia website at tifia.com/analytics Support and resistance levels Today the pair EUR / USD has reached a new annual maximum near the level of 1.1865. The pair EUR / USD maintains positive momentum above support levels 1.1785 (the Fibonacci level of 38.2% of the corrective growth from the lows reached in February 2015 in the last wave of global decline of the pair from 1.3900 level), 1.1610 (EMA200 on the weekly chart). In case of further growth and breakdown of resistance level 1.1865, the pair EUR / USD may go to the long-term target 1.2180 (50% Fibonacci level). In fact, this will mean the cancellation of the global downward trend, which began in May 2014. The OsMA and Stochastic indicators on the daily and weekly charts still recommend long positions. In the alternative scenario and in case of breakdown of the support level 1.1610, the decline may accelerate inside the uplink on the daily chart, up to the level of 1.1490 (the bottom line of the uplink on the daily chart and EMA200 on the 4-hour chart). In case of breakdown of the support level 1.1285 (Fibonacci level of 23.6%), risks of return to the downtrend will grow significantly. Support levels: 1.1785, 1.1715, 1.1685, 1.1610, 1.1560, 1.1490, 1.1400, 1.1370, 1.1285, 1.1240, 1.1120, 1.1050 Resistance levels: 1.1865, 1.1900, 1.2000, 1.2180 Trading Scenarios Sell Stop 1.1790. Stop-Loss 1.1870. Take-Profit 1.1715, 1.1685, 1.1650, 1.1610, 1.1560, 1.1500, 1.14400, 1.1370, 1.1285, 1.1240, 1.1120 Buy Stop 1.1870. Stop-Loss 1.1790. Take-Profit 1.1900, 1.2000, 1.2180   *) For up-to-date and detailed analytics and news on the forex market visit Tifia company website tifia.com
|
|
#57
03-08-2017, 10:42
|
||||
|
||||
|
XAU/USD: gold is falling in price
03/08/2017 Current dynamics The focus of traders today is the meeting of the Bank of England. As expected, the central bank of Great Britain will keep the key interest rate unchanged after the Bank of England lowered the rate to a record low of 0.25% one year ago. Due to weak inflation and modest economic growth, most representatives of the Central Bank are expected to continue to oppose higher rates. The decision on the rates will be published at 11:00 (GMT), and at 11:30 (GMT) a press conference will begin, during which the Bank of England's head Mark Carney will outline the bank's position on the future of monetary policy in the UK, Current economic situation in the country. In the period from 11:00 to 12:00 (GMT), a surge in volatility is expected not only in pound trade, but throughout the financial market. After this, the attention of traders will shift to tomorrow's publication (12:30 GMT) of data from the labor market in the US for July. The dollar recovered slightly in the foreign exchange market during the Asian session and after the report on the change in the number of employees (from ADP) was published yesterday. This report indicated an improvement in the labor market situation in the US in July (+178,000 new employees in the private sector of the US against growth of 191,000 in June and a forecast of +185,000). The index of the dollar WSJ rose in the morning by 0.1%. Also today, it is worth paying attention to the publication at 13:45 and 14:00 (GMT) of the US data (business activity indices from Markit and ISM in the services sector for July and the level of production orders in June). If the data comes out with positive values, it will be of great importance for the dollar on the eve of tomorrow's publication of data from the labor market in the United States. It is expected that unemployment fell by 0.1% in July to 4.3%, while the number of people employed in the non-agricultural sector of the US economy increased by 183 000 in July. These are very strong indicators. As the president of the Federal Reserve Bank of Cleveland Loretta Mester stated yesterday, one should adhere to the planned course of monetary policy, The basic fundamental indicators of economic growth remain strong, which speaks in favor of strong economic growth next year. "I think it will be necessary to further curtail soft policy by gradually raising the rates for federal funds", Mester added. The prospect of raising rates puts pressure on prices for precious metals and stimulates dollar purchases. At the same time, the domestic political uncertainty in the US, connected with the difficulties in implementing President Donald Trump's presidential campaign to stimulate the US economy, contradictory indicators of the US economic indicators put pressure on the dollar and support the gold quotes. Gold does not bring interest income. But in periods of a soft monetary policy, the demand for gold, which has the status of a safe haven during periods of political instability, is growing. *)An advanced fundamental analysis is available on the Tifia website at tifia.com/analytics Support and resistance levels At the beginning of the month on the daily chart of the pair XAU/USD formed "Doge" and 2 more consecutively decreasing candles. The pair XAU / USD could not break the upper boundary of the descending channel on the daily chart near the level of 1273.00 and is deployed inside the channel. Indicators OsMA and Stochastics on the 4-hour and daily charts went to the side of sellers. In case of an increase in negative dynamics and breakdown of support levels of 1248.00 (the Fibonacci level of 50% correction to the wave of decline from July 2016 and EMA200 on the 4-hour chart), 1242.00 (ЕМА200, ЕМА144 on the daily chart), the pair XAU / USD will again return to the downtrend with immediate targets at support levels 1229.00, 1220.00 (Fibonacci level 38.2%), 1205.00 (July lows). In case of resumption of growth and after the breakdown of resistance levels 1273.00, 1277.00 (Fibonacci level 61.8%), the pair XAU / USD will go to the level of 1295.00 (highs of June and the year and the upper line of the range located between the levels 1185.00 and 1295.00). Support levels: 1260.00, 1248.00, 1242.00, 1229.00, 1220.00, 1205.00, 1185.00 Levels of resistance: 1273.00, 1277.00, 1295.00 Trading Scenarios Sell Stop 1255.00. Stop-Loss 1267.00. Take-Profit 1248.00, 1242.00, 1229.00, 1220.00, 1205.00, 1185.00 Buy Stop 1267.00. Stop-Loss 1255.00. Take-Profit 1273.00, 1277.00, 1295.00  *) For up-to-date and detailed analytics and news on the forex market visit Tifia company website tifia.com
|
|
#58
04-08-2017, 10:45
|
||||
|
||||
|
DJIA: US indices grow on the eve of NFP
04/08/2017 Current dynamics In anticipation of the publication of the monthly report on the US labor market, which will be released today at 12:30 (GMT), there is a sluggish dynamics in the financial markets. Today's data may be key to the dynamics of the dollar and US stock indices. It is expected that in July there were 180,000 new jobs in the non-agricultural sector of the economy (in June the increase was 222,000 seats). Market attention will also be focused on data on wages in the US. It is expected that hourly wages in the US in July increased by 0.3% compared with June. If the data on the labor market coincides with the forecast or will be better, the stock indexes will grow, despite the fact that the prospects for further tightening of monetary policy in the US remain. Yesterday, very positive macro statistics on the United States were published. Production orders in June increased by 3.0% compared to the previous month. According to the report, the growth of new orders was the strongest in two years, which led to the fact that the rate of increase in employment was the strongest this year. The composite index of supply managers (PMI) in July rose to 54.6 against 53.9 in June. Earlier in the week, ISM presented a report stating that "the conditions for doing business have improved, and new orders, production, employment, outstanding orders and exports increased in July compared to June." The data presented confirm the stable trend of the recovery of the US economy, and this supports the bullish trend of the American stock market. US indices this year reached new highs supported by good company results and signs of recovery of world economic growth. Today, the Dow Jones Industrial Average has risen to another record level of 22070.0, and its positive dynamics persists. Nevertheless, at the time of today's publication of data from the US labor market, a surge in volatility is expected across the entire financial market, which must be taken into account when making trade decisions. *)An advanced fundamental analysis is available on the Tifia website at tifia.com/analytics Support and resistance levels The DJIA index is developing the upward trend, being in a bullish trend since February 2016. For the last 4 months of continuous growth, DJIA has grown by more than 6%, and today has updated the annual and absolute maximum, having risen to 22070.0. Long positions are still relevant. Only in case of breakdown of the short-term support level of 21880.0 (EMA200 on the 1-hour chart) can we again return to consideration of short positions with the aim near the levels 20600.0, 21300.0 (July lows). And only in case of breakdown of the support level of 20500.0 (the Fibonacci level of 23.6% of the correction to the growth in the wave from the level of 15660.0 after the recovery in February of this year to the collapse of the markets since the beginning of the year.The maximum of this wave and the Fibonacci 0% level is near the mark of 22000.0) We can talk about the breakdown of the bullish trend. Through the level 20500.0 also passes EMA200 on the daily chart. This level, therefore, is the key. Support levels: 22000.0, 21880.0, 21600.0, 21300.0, 21000.0, 20500.0 Resistance levels: 22070.0, 22300.0 Trading Scenarios Buy Stop 22080.0. Stop-Loss 21950.0. Take-Profit 22150.0, 22300.0 Sell Stop 21950.0. Stop-Loss 22080.0. Take-Profit 21880.0, 21600.0, 21300.0, 21000.0, 20500.0   *) For up-to-date and detailed analytics and news on the forex market visit Tifia company website tifia.com
|
|
#59
07-08-2017, 09:53
|
||||
|
||||
|
XAU/USD: Dollar grows on positive NFP
07/08/2017 Current dynamics After the strongest monthly increase recorded on Friday, when favorable macro data on the US labor market came out, the dollar continues to strengthen in the foreign exchange market from the opening of the trading day on Monday. The number of jobs outside of US agriculture increased by 209,000 in July (the forecast was + 180,000 jobs), the unemployment rate decreased by 0.1% to 4.3%, the average hourly wage rose by 0.3% (+2,5% in annual terms). Such data was led on Friday by the US Department of Labor showed that the conditions in the US labor market remain a positive factor in the recovery of the US economy. Favorable data on employment in the US have eased fears about the probability of an increase in interest rates by the Fed this year. Thus, according to the CME Group, the probability of an increase in rates by the end of the year is estimated at about 50% versus 43% before the release of the labor market report. Prices for asylum assets, such as government bonds, yen, franc and gold, sensitive to higher rates in the US, after the release of data on the labor market declined. Yield of 10-year US government bonds, according to Tradeweb, rose to 2.269% compared with the level of 2.230% recorded on Thursday. August gold futures fell by 0.7% to 1258.30 dollars. The spot price for gold at the beginning of today's European session is near the mark of 1258.00 dollars per troy ounce, which is slightly lower than the closing price on Friday. The prospect of raising rates puts pressure on prices for precious metals and stimulates dollar purchases. Gold does not bring interest income. In periods of the interest rate increase, the cost of its acquisition and storage is growing. Also, the dollar quotes reacted positively to the comments of the director of the National Council for Economy under the White House Gary Cohn about the prospects for tax reform in a television interview. According to him, the tax plan of the White House provides for stimulating American companies to repatriate foreign incomes, which will support the national currency. *)An advanced fundamental analysis is available on the Tifia website at tifia.com/analytics Support and resistance levels Indicators OsMA and Stochastics on the 4-hour, daily, monthly charts of the pair XAU / USD went to the side of sellers. XAU / USD broke the short-term support level of 1261.00 (EMA200 on the 1-hour chart) and continues to develop a downward trend towards the support levels of 1255.00 (EMA200 on the weekly chart), 1250.00 (EMA200 on the 4-hour chart), 11248.00 (Fibonacci level 50% correction to the wave of decline since July 2016). The breakdown of the support level of 1244.00 (EMA200 on the daily chart) will provoke further decline of the pair XAU / USD and its return to the downward trend. In case of resumption of growth and after the breakdown of resistance levels 1273.00, 1277.00 (Fibonacci level 61.8%), the pair XAU / USD will go to the level of 1295.00 (highs of June and the year and the upper line of the range located between the levels 1185.00 and 1295.00). So far, the downward trend is prevailing. Support levels: 1255.00, 1250.00, 1248.00, 1244.00, 1229.00, 1220.00, 1205.00, 1185.00 Resistance levels: 1261.00, 1273.00, 1277.00, 1295.00 Trading scenarios Sell Stop 1255.00. Stop-Loss 1260.00. Take-Profit 1250.00, 1248.00, 1242.00, 1229.00, 1220.00, 1205.00 Buy Stop 1260.00. Stop-Loss 1255.00. Take-Profit 1273.00, 1277.00, 1295.00   *) For up-to-date and detailed analytics and news on the forex market visit Tifia company website tifia.com
|
|
#60
08-08-2017, 11:06
|
||||
|
||||
|
EUR/USD: the euro keeps positive momentum
08/08/2017 Current dynamics Despite data provided yesterday by the German Ministry of Economy, industrial production in June fell by 1.1%. This was the first reduction in production since December last year. Germany's exports in June compared with May decreased by 2.8%. The reduction of exports was noted this year for the first time: in the period from January to May, exports grew. Such data was provided today by the statistical office of Germany. Nevertheless, Germany's foreign trade surplus rose in June (EUR 21.2 billion versus EUR 20.3 billion in May and EUR 21.0 billion forecasted). The positive balance of the current account of Germany's balance of payments in June amounted to 23.6 billion euros compared to 16 billion euros in May. Despite the unexpected decline in industrial output in June, the German economy shows steady signs of stable recovery. According to the forecast of the IFO Institute, in the second quarter Germany's GDP grew by 0.8% (official data will be released next week). On September 24 parliamentary elections are planned in Germany. They will go against the backdrop of strong economic growth and low unemployment, which in turn will contribute to the victory of the center-right bloc headed by Chancellor Angela Merkel. Stability of the domestic political situation in Germany, as well as strong growth rates of the largest economy of the Eurozone contribute to the positive dynamics of the EUR / USD pair. Meanwhile, the dollar stabilized on Tuesday after strong growth on Friday amid glaring indicators of the US labor market. Yesterday's comments by the President of the Federal Reserve Bank of St. Louis James Bullard that the latest inflation data "cast doubt on the view that US inflation is confidently returning to the target level" contributed to a reduction in the likelihood of another increase in the interest rate in the United States. According to the CME Group, investors consider a 46% chance of raising the Fed's key interest rate this year, against 50% on Monday. Slowing inflation may not allow the Fed to raise interest rates, and this is a strong negative factor for the dollar. Friday (12:30 GMT) data on inflation in the US for July will be published, and if it fall below the forecast, the pressure on the dollar may recover. Today, in the absence of important news, it is assumed that the volume of trading will be small, and the dynamics of currency pairs, including the EUR / USD pair, is weak. *)An advanced fundamental analysis is available on the Tifia website at tifia.com/analytics Support and resistance levels Support level 1.1780 (EMA200 on 1-hour, EMA50 on 4-hour charts and Fibonacci level 38.2% of corrective growth from the lows reached in February 2015 in the last wave of global decline of the pair from 1.3900 level) did not allow the EUR / USD pair to develop a downward correction against the background of the publication on Friday of data from the American labor market. Despite a 100-point corrective decline, the pair EUR / USD remains positive, trading in the uplink on the daily chart, above the key support level 1.1610 (EMA200 on the weekly chart). In case of resumption of growth and breakdown of the local resistance level 1.1890, the target will be the levels of 1.2050, 1.2180 (Fibonacci level of 50%). The signal to decline will be the consolidation below the support level 1.1780. In this case, a decrease to levels 1.1610 is likely. Only in case of breakdown of the support level 1.1570 (EMA200 on the 4-hour chart) can we take the short positions on the EUR / USD pair more seriously. Support levels: 1.1780, 1.1715, 1.1685, 1.1610, 1.1570 Resistance levels: 1.1890, 1.2050, 1.2180 Trading Scenarios Sell Stop 1.1765. Stop-Loss 1.1830. Take-Profit 1.1715, 1.1685, 1.1650, 1.1610, 1.1570 Buy Stop 1.1830. Stop-Loss 1.1765. Take-Profit 1.1890, 1.2000, 1.2050, 1.2100, 1.2180   *) For up-to-date and detailed analytics and news on the forex market visit Tifia company website tifia.com
|
|
#61
09-08-2017, 11:12
|
||||
|
||||
|
XAG/USD: demand for precious metals has increased
09/08/2017 Current dynamics The escalation of geopolitical tensions, provoked by North Korea's threats against the United States, caused a sharp increase in demand for safe haven assets - yen, franc and precious metals. In recent days, North Korea has threatened to use nuclear weapons against the US in the event of a military provocation. Yesterday, the media reported that the North Korean army is "carefully studying" the operational plan for a missile strike on Guam. If the plan is implemented, "the United States will be the first to experience the power of strategic weapons", the DPRK said. On Tuesday, US President Donald Trump demanded that North Korea "stop further threats" against the US, saying that the answer would be "the fire and fury that the world has not seen so far". At the end of yesterday's trading session and with the opening of today's trading day, prices for precious metals soared. The troy ounce of gold has risen today by 7 dollars to 1267.00 dollars, silver - by 0.2 dollars to 16.60 dollars. The investors' withdrawal from risks in connection with the increased geopolitical tension provoked also a decline in world stock indices and a rise in prices for government bonds. As long as the situation around North Korea does not calm down, the demand for safe haven assets will continue. The dollar will also remain under pressure, despite strong data on the US labor market, published on Friday, which increases the likelihood of further interest rate increases in the US this year. Precious metals do not bring investment income. However, in the context of increasing economic or political uncertainty, the demand for precious metals as a safe haven is growing. Under conditions of an increase in the interest rate in the US, the price of precious metals is falling, as the cost of their acquisition and storage is growing. Today, investors will follow the publication (at 12:30 GMT) of data on labor costs and labor productivity in the US (excluding the agricultural sector) for the 2nd quarter. Positive data will support the dollar. Expected to grow by 1.2% and 0.7%, respectively. Investors also expect the release of inflation data in the US (on Friday 12:30 GMT) to assess the pace of inflation acceleration after its recent slowdown. The growth of inflation indices can strengthen expectations regarding the increase in interest rates of the Fed, and this is a negative factor for the precious metals market. The probability of another increase in interest rates in the US this year is estimated today at about 46%, according to the CME Group. *)An advanced fundamental analysis is available on the Tifia website at tifia.com/analytics Support and resistance levels Since the middle of April, the pair XAG / USD is declining in the descending channel on the daily chart. The lower boundary of the channel passes near the 14.30 mark (July lows), and the upper one - near the level of 16.80. A little higher, near the 17.00 mark, the resistance level passes (EMA200 on the daily chart). While XAG / USD is below these levels, the downward trend prevails, despite the current upward correction associated with the escalation of tensions between the US and North Korea. In case of breakdown of the support level of 16.45 (EMA200 on 1-hour and 4-hour charts), the descending dynamics will return, and after the breakdown of the local support level of 16.12 (August lows), the pair XAG / USD will go into the downlink on the daily chart with targets of 15.60, 14.90, 14.30 (July lows), 13.65 (the minimum of the global wave of decline in the pair XAG / USD since September 2012). Support levels: 16.45, 16.12, 15.60, 15.25, 14.90, 14.30, 13.65 Resistance levels: 16.80, 17.00 Trading Scenarios Sell Stop 16.43. Stop-Loss 16.68. Take-Profit 16.38, 16.12, 15.60, 15.25, 14.90, 14.30 Buy Stop 16.68. Stop-Loss 16.43. Take-Profit 16.80, 17.00   *) For up-to-date and detailed analytics and news on the forex market visit Tifia company website tifia.com
|
|
#62
10-08-2017, 10:35
|
||||
|
||||
|
NZD / USD: monetary policy has not changed
10/08/2017 Current dynamics As expected, the RBNZ kept the current interest rate in New Zealand at the same level of 1.75%. The RBNZ stated that against the backdrop of "many uncertainties," monetary policy "will remain soft in the foreseeable future," but "can be adjusted accordingly." For a stable recovery of the New Zealand economy and rising inflation of the value of traded goods, "a lower New Zealand dollar rate is needed." In response to the publication of the decision on the rate of the pair, the New Zealand dollar / dollar briefly jumped to 0.7370 from 0.7340, but then declined during the Asian session, and at the beginning of the European session it was already trading near the 0.7270 mark. Commodity currencies, including the New Zealand dollar, continue to decline in the foreign exchange market amid the continuing geopolitical tensions in the Asian region. The second day in a row, North Korea is threatening the United States. On Tuesday, the media reported that the North Korean army is "carefully studying" the operational plan for a missile strike on Guam. "The United States will be the first to experience the power of strategic weapons," the DPRK declared. US President Donald Trump demanded that North Korea "stop further threats" against the US, saying that the answer would be "the fire and the rage that the world has not seen so far." This time, North Korea threatened to "shell out from all sides" the territory of Guam in the coming weeks. As a result of its 10-day decline, the pair NZD / USD completely leveled its July growth. According to economists, "the current rate is more appropriate to short-term fundamental factors" and "approached its average value over the past year." As the geopolitical situation in the Asian region stabilizes, the New Zealand dollar will be able to maintain its position in the foreign exchange market due to rising commodity prices, also receiving support from long-term investors who prefer safe long-term investments. Preservation of the current interest rate at 1.75% in the long term will also contribute to this. *)An advanced fundamental analysis is available on the Tifia website at tifia.com/analytics Support and resistance levels The pair NZD / USD broke through an important short-term support level of 0.7350 (EMA200 on the 4-hour chart) and remains under pressure. Today, the NZD / USD pair has reached an important support level of 0.7285 (EMA200 on the weekly chart) and is developing a downward movement to the level of support 0.7240 (Fibonacci retracement level of 38.2% of the upward correction to the global wave of decline of the pair from the level of 0.8800, which began in July 2014, the low of December 2016). Indicators OsMA and Stochastics on the 4-hour, daily, weekly charts went to the side of sellers, signaling a strong negative impulse. While NZD / USD is trading above the support level of 0.7150 (EMA200 on the daily chart), the upward dynamics is maintained. In the case of breakdown at the level of 0.7150, a further decline to support levels of 0.6860 (Fibonacci level of 23.6% and a lower limit of the range located between the levels of 0.7550 and 0.6860) is possible. At the level of 0.6860 are also the minimums of December 2016 and May 2017. A break at the level of 0.6860 will mean the end of the upward correction, which began in September 2015, and a return to the downward trend. The alternative scenario is to return to the zone above the level of 0.7350 and resume growth towards the annual maximum and the resistance level of 0.7550 (50% Fibonacci level). Meanwhile, it is too early to talk about long positions on the NZD / USD pair. Only a breakdown at 0.7550 would mean the end of the global bearish trend. Support levels: 0.7240, 0.7150 Resistance levels: 0.7285, 0.7350, 0.7418, 0.7455, 0.7500, 0.7550 Trading Scenarios Sell Stop 0.7250. Stop-Loss 0.7310. Take-Profit 0.7200, 0.7150 Buy Stop 0.7310. Stop-Loss 0.7250. Take-Profit 0.7418, 0.7455, 0.7500, 0.7550, 0.7600   *) For up-to-date and detailed analytics and news on the forex market visit Tifia company website tifia.com
|
|
#63
11-08-2017, 09:35
|
||||
|
||||
|
Brent: World oil supply grows
11/08/2017 Overview and dynamics As reported today by the International Energy Agency (IEA), the world oil supply in July increased by 520,000 barrels a day, even despite the arrangements in OPEC. Growth in the supply of oil has been observed for 3 consecutive months. The supply of oil in the world increased in July to 98.16 million barrels per day, which is by 500,000 barrels per day more than in the same period last year. OPEC oil production in July increased by 230,000 barrels per day and reached 32.84 million barrels per day, the high of 2017. The increase in OPEC production of the cartel is primarily due to the increase in production in Libya and Nigeria, which are exempt from participation in the transaction. The investors' skepticism about the effectiveness of OPEC measures is maintained due to poor compliance with the agreements on the reduction of oil production. All this imposes a negative imprint on the dynamics of oil prices. Prices fell on Thursday, despite the earlier data from the US Energy Ministry on oil reserves in the US (Wednesday 14:30 GMT). According to the report of the Energy Information Administration (EIA) of the United States, US oil inventories fell 6.451 million barrels last week, which was the sixth consecutive week. Today we are waiting for the publication at 17:00 (GMT) of the report of the oilfield service company Baker Hughes on the number of active drilling platforms in the US, which is an important indicator of the activity of the oil sector of the US economy and significantly affects the quotes of oil prices. The US successfully used the situation with a rise in prices against OPEC actions last year and increased production by 750,000 barrels a day to 9.3 million barrels per day, the highest since summer 2015. In fact, by the efforts of the US alone, more than a third of the reduced production was offset. At the moment, there are 765 active drilling rigs in the USA. If the number of installations increases again, this will negatively affect oil prices. *)An advanced fundamental analysis is available on the Tifia website at tifia.com/analytics Support and resistance levels The price of Brent crude oil was unable to develop an upward trend above the resistance level of 52.90 (EMA144 on the weekly chart) on Thursday and the second day is going down. While the price is below the short-term resistance level of 51.85 (EMA200 on the 1-hour chart), the downside dynamics will increase, and the downside correction target will be the support level of 50.70 (EMA200, EMA144 on the daily chart, EMA50 on the weekly chart, as well as Fibonacci 61, 8% correction to the decline from the level of 65.30 from June 2015 to the absolute minimums of 2016 near the mark of 27.00). Indicators OsMA and Stochastics on the 4-hour, daily charts went to the side of sellers. If the price breaks through the key support level of 50.70, then the decline will accelerate, risking again moving into a bearish trend. The targets then will be support levels 49.70, 48.75, 48.00, 46.20 (50% Fibonacci level), 44.50 (lows of the year). The more distant goal is the level 41.70 (the Fibonacci level of 38.2% and the lower boundary of the descending channel on the weekly chart). The scenario for growth implies breakdown of the resistance level of 52.90 and an increase to the resistance level of 54.75 (EMA200 on the weekly chart and May highs). The signal to growth will be the fixing of the price above the level of 51.85. Support levels: 51.00, 50.70, 50.00, 49.70, 48.75, 48.00, 47.70, 46.20, 45.50, 44.50, 41.70 Resistance levels: 51.85, 52.90, 54.00, 54.75 Trading Scenarios Sell Stop 51.10. Stop-Loss 52.10. Take-Profit 50.70, 50.00, 49.70, 48.75, 48.00, 46.20, 44.50 Buy Stop 52.10. Stop-Loss 51.10. Take-Profit 52.90, 54.00, 54.75 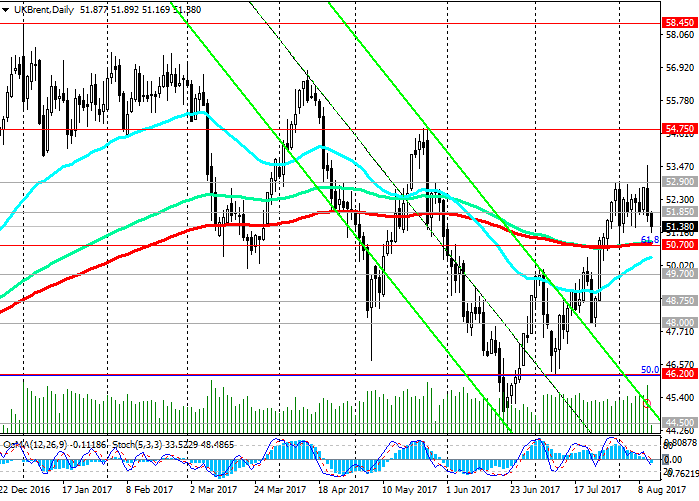 *) For up-to-date and detailed analytics and news on the forex market visit Tifia company website tifia.com
|
|
#64
14-08-2017, 11:14
|
||||
|
||||
|
XAU/USD: the dollar regains positions
14/08/2017 Current dynamics Friday's weak inflation data in the US, as well as an escalation in tensions between the US and North Korea, caused the dollar to fall on Friday and the demand for safe haven assets was growing. As reported by the US Labor Department, in July, consumer prices rose by 0.1% (the forecast was + 0.2%). The index pointed to a worsening of the outlook for price growth in the US, which weakened expectations of an increase in interest rates by the Fed this year. At the same time, US President Donald Trump said on Thursday that his previously voiced threats to reply North Korea with "fire and fury" apparently sounded "not tough enough." And on Saturday Donald Trump said that the United States is ready to strike North Korea, if it does not stop threatening the United States. As a result, on Friday, demand for gold continued to remain at high levels. On Friday, the president of the Federal Reserve Bank of Dallas, Robert Kaplan, said that the current level of interest rates is acceptable. Another Fed spokesman, the president of the Federal Reserve Bank of Minneapolis, Neil Kashkari, said that the Fed should wait with higher rates until inflation approaches the target of 2%. "We still can not reach the target level of inflation, and the growth of wages remains slow," Kashkari said. Now investors expect a rate hike in December with a probability of 38% (on Friday the probability was estimated at 47%), according to the CME Group. Gold, as you know, does not bring interest income. But it is growing in price in periods of low interest rates and political or economic instability in the world. So far, the demand for it is supported, mainly against the backdrop of domestic political instability in the United States and the tension in relations with the DPRK. As the geopolitical tensions decrease, investors' attention will again shift to economic indicators. Still, the risk of an increase in the US interest rate in December, despite the low level of inflation, exists. Strong labor market in the US indicates a stable state of the economy in the country. Tomorrow, investors will focus on the publication of inflation indicators for the United States. At 12:30 (GMT) are published retail sales indices for July, which are a leading indicator, and indices of export-import prices. Forecast: retail sales increased by 0.3% (against -0.2% in June), which should support the dollar quotes. *)An advanced fundamental analysis is available on the Tifia website at tifia.com/analytics Support and resistance levels With the opening of today's trading day, the dollar is recovering its positions in the foreign exchange market, and gold is getting cheaper. Indicators OsMA and Stochastics on the 1-hour, 4-hour charts of the pair XAU / USD turned to short positions. Probably further decline to support levels 1277.00 (Fibonacci level 61.8% correction to the wave of decline since July 2016), 1273.00 (EMA200 on the 1-hour chart). In the case of breakdown of these levels and the development of a downward correction, it is likely that the support level of 1260.00 (the bottom line of the uplink and EMA200 on the 4-hour chart) will decrease to the support level. The breakdown of support levels 1248.00 (Fibonacci 50.0%), 1244.00 (EMA200 on the daily chart) will provoke further decline of the pair XAU / USD and its return to the downtrend. The alternative scenario is connected with the breakdown of the resistance level of 1295.00 (the highs of June and the year and the upper line of the range located between the levels of 1185.00 and 1295.00) and further growth. So far, against the background of the dollar's recovery, the downward short-term dynamics is dominating. Support levels: 1277.00, 1273.00, 1260.00, 1248.00, 1244.00, 1229.00, 1220.00, 1205.00, 1185.00 Levels of resistance: 1295.00 Trading scenarios Sell in the market. Stop-Loss 1285.00. Take-Profit 1277.00, 1273.00, 1260.00, 1248.00, 1244.00 Buy Stop 1285.00. Stop-Loss 1279.00. Take-Profit 1290.00, 1295.00   *) For up-to-date and detailed analytics and news on the forex market visit Tifia company website tifia.com
|
|
#65
15-08-2017, 11:12
|
||||
|
||||
|
GBP/USD: producer price growth slowed
15/08/2017 Current dynamics The consumer price index (CPI) of the UK in July compared with July last year increased by 2.6% (the forecast was + 2.7%). Thus, according to the data presented today, in July the annual rate of consumer inflation did not change with respect to June. But the annual growth rate of purchasing prices of producers in July slowed sharply - to 6.5% from 10% in June. As a result of the sharp weakening of the pound after the referendum on Brexit in May, consumer price inflation accelerated to a maximum of 2.9% in mid-2013. Against the background of the weakening of the pound, the purchasing power of the British sharply decreased, which sharply limited their spending. Retail sales are one of the main "fillers" of British GDP. The slowdown in inflation favorably influences the British economy, which is oriented primarily toward the domestic market. Improving the situation in the service sector for consumers, which has recovered due to strong retail sales, contributes to GDP growth in the UK. So, according to official data released last Wednesday, in the second quarter, the British economy grew by 0.3% after rising 0.2% in the 1st quarter. The pound declined after the publication of today's data on inflation, but the British stock index FTSE rose, indicating the favorable impact of slowing inflation on the growth of the British economy. Yet the main risk for the UK economy remains Brexit. For today (at 12:30 GMT) it is planned to publish important data from the US - inflation indicators for July (retail sales), as well as import-export price indices. High level of retail sales will strengthen the US dollar. Forecast: + 0.4% (against -0.2% in June). The weak values of the indicators will put pressure on the dollar, which is now recovering in the foreign exchange market after it became known that the DPRK leader Kim Jong-un decided not to attack Guam after consulting with the military command. This was also facilitated by China's decision to support the sanctions against Pyongyang imposed by the United States. *)An advanced fundamental analysis is available on the Tifia website at tifia.com/analytics Support and resistance levels The pair GBP / USD broke through the important short-term support levels of 1.3000 (EMA200 on the 4-hour chart), 1.2960 (EMA50 on the daily chart, the bottom line of the uplink on the 4-hour chart) and is rapidly declining to the key support level 1.2860 (EMA200 on the daily chart). Break of this level will speak about the completion of the upward correction and will strengthen the risks of GBP / USD returning to a downtrend. The alternative scenario is connected with the return of GBP / USD to the zone above the level of 1.3000 and the resumption of growth. The closest target in this case will be resistance level 1.3210 (Fibonacci level 23.6% correction to the decline of the GBP / USD pair in the wave, which began in July 2014 near the level of 1.7200). Levels of 1.3300 (the upper limit of the channel on the weekly chart), 1.3460 (July and September highs) will be the next target. So far, the downward trend is dominating, as evidenced by the indicators OsMA and Stochastics, which on the 1-hour, 4-hour, daily and weekly charts turned to short positions. Support levels: 1.2860, 1.2800 Resistance levels: 1.2960, 1.3000, 1.3100, 1.3210, 1.3300, 1.3400, 1.3460 Trading Scenarios Sell Stop 1.2850. Stop-Loss 1.2910. Take-Profit 1.2815, 1.2765, 1.2700, 1.2640, 1.2590, 1.2550, 1.2365 Buy Stop 1.2910. Stop-Loss 1.2850. Take-Profit 1.2960, 1.3000, 1.3100, 1.3210, 1.3300, 1.3400, 1.3460   *) For up-to-date and detailed analytics and news on the forex market visit Tifia company website tifia.com
|
|
#66
16-08-2017, 09:35
|
||||
|
||||
|
XAG / USD: demand for precious metals declined
16/08/2017 Current dynamics After the tension in relations between North Korea and the United States declined and against the background of positive data on retail sales received from the US, the dollar regains its positions in the foreign exchange market, and the demand for safe haven assets, including precious metals, is declining. A few hours after China supported sanctions against Pyongyang imposed by the United States, North Korea refused to threaten to attack the United States. As reported yesterday by the US Department of Commerce, July data on retail sales exceeded expectations, an increase of 0.6% against the forecast (0.4%). Data on retail sales supported the further strengthening of the dollar and encouraged the buyers of the dollar, putting on its further growth. Today, the focus of traders will be the publication (18:00 GMT) of the protocol from the July Fed meeting to understand the prospects for monetary policy in the US. In recent weeks, Fed officials have talked about the weakness of inflation and uncertainty in fiscal policy. Published on Friday, inflation data increased fears that the price dynamics did not meet the expectations of the Fed. The consumer price index (CPI) in July rose by 0.1% compared to June, and by 1.7% compared to July of the previous year (the target level of annual inflation established by the Federal Reserve is 2%). The protocols, apparently, will also contain information on the continuation of the discussion on inflation, which remains weak and, in the opinion of some leaders of the Fed, may become a hindrance to further tightening of monetary policy in the US. This year, the Fed will hold three more meetings devoted to monetary policy: September 19 - 20, October 31 - November 1, and December 12 - 13. After the September and December meetings, the Fed will publish its new economic forecasts, while Fed Chairman Janet Yellen will hold a press conference. According to the CME Group, investors are taking into account the 53% chance of raising the Fed's interest rates in the price this year. Before the release of data on retail sales, they estimated such a probability of 37%. As is known, in the conditions of increase in the rate the price for precious metals, including silver, falls, as the cost of its acquisition and storage is growing. *)An advanced fundamental analysis is available on the Tifia Forex Broker website at tifia.com/analytics Support and resistance levels The pair XAG / USD was unable to develop an uptrend above the resistance level of 17.22 (August highs and the top line of the descending channel on the daily chart). Having broken the key level 17.00 (EMA200 on the daily chart), XAG / USD is falling deeper into the descending channel on the daily chart. At the moment, XAG / USD is trading at the support level of 16.58 (EMA200, EMA144 on the 4-hour chart). A break of this level will signal the continuation of the downward movement. While XAG / USD is below the level of 17.00, the downside dynamics prevails. In case of breakdown of the local support level of 16.12 (August lows), the pair XAG / USD will go into the downward channel on the daily chart towards its lower boundary with the targets of 15.60, 14.90, 14.30 (July lows), 13.65 (minimum of the global wave of the pair XAG / USD decline September 2012). Support levels: 16.58, 16.45, 16.12, 15.60, 15.25, 14.90, 14.30, 13.65 Levels of resistance: 16.80, 17.00, 17.22 Trading scenarios Sell Stop 16.55. Stop-Loss 16.70. Take-Profit 16.45, 16.38, 16.12, 15.60, 15.25, 14.90, 14.30 Buy Stop 16.70. Stop-Loss 16.55. Take-Profit 16.80, 17.00, 17.22   *) For up-to-date and detailed analytics and news on the forex market visit Tifia Forex Broker website tifia.com
|
|
#67
17-08-2017, 10:56
|
||||
|
||||
|
GBP/USD: revenue growth lags behind inflation
17/08/2017 Current dynamics As follows from yesterday's July minutes of the Fed meeting, there is no consensus among US central bank executives about further interest rate hikes. Slowing inflation forced some Fed officials to propose to refrain from further raising rates. "In the current conditions, the Fed can show patience", the protocols say. Earlier, the Fed planned to raise rates three times this year, but the protocols published on Wednesday make it doubtful. After the publication of the minutes, the dollar fell sharply in the foreign exchange market. The index of the US dollar, WSJ, estimating the value of the dollar against 16 other major world currencies, fell by 0.4%, to 86.33. Nevertheless, today the dollar is recovering its positions during the European trading session. This applies to the pair GBP / USD, which is declining after the publication of data on retail sales in the UK for July. According to the National Bureau of Statistics (ONS), presented today at the beginning of the European session, retail sales growth in the UK in July was modest (+ 0.3% vs. +0.2 forecast). The estimation of sales growth for June was reduced to 0.3% from 0.6%. In annual terms, growth was also modest (+ 1.3% vs. + 1.4%, according to the forecast). The British economy, largely dependent on domestic consumption, grew by just 0.3% in the second quarter (+ 0.2% in the first quarter). According to data published earlier this week, real British salaries in June declined for the fourth consecutive month. Because of the sharp increase in inflation against the backdrop of a sharp weakening of the pound after the referendum on Brexit, the real income growth of the British lags behind inflation, which is confirmed by the almost zero increase in personal expenses of the British and the level of retail sales. Sales in all categories, except for food and household goods, in comparison with the previous month decreased. In July, inflation was 2.6% against a nearly four-year high of 2.9% in May, well above the Bank of England's target of 2%. We are waiting for the data from the USA today. At 12:30 (GMT), the US Department of Labor will publish a weekly report on the number of initial applications for unemployment benefits. The forecast is expected to decline to 240,000 versus 244,000 for the previous period, which should positively affect the dollar. If the data is confirmed or better, the dollar will receive additional support. *)An advanced fundamental analysis is available on the Tifia Forex Broker website at tifia.com/analytics Support and resistance levels Since the beginning of August, the GBP / USD pair is actively declining. On the daily chart, GBP / USD fell back to the key support level of 1.2860 (EMA200). Downward dynamics prevails. Breakdown of this level will strengthen the risk of GBP / USD returning to a downtrend. Indicators OsMA and Stochastic daily, weekly, monthly charts were deployed to short positions. An alternative scenario relates to the return of GBP / USD to the zone above the level of 1.2980 (EMA200 on 1-hour and 4-hour charts) and the resumption of growth. The closest target in this case will be the resistance level 1.3210 (Fibonacci level 23.6% correction to the decline in the GBP / USD pair in the wave, which began in July 2014 near the level of 1.7200). Levels of 1.3300 (the upper limit of the channel on the weekly chart), 1.3460 (July and September highs) will be the next growth target. Support levels: 1.2860, 1.2800 Resistance levels: 1.2980, 1.3000, 1.3100, 1.3210, 1.3300, 1.3400, 1.3460 Trading scenarios Sell Stop 1.2850. Stop-Loss 1.2910. Take-Profit 1.2815, 1.2765, 1.2700, 1.2640, 1.2590, 1.2550, 1.2365 Buy Stop 1.2910. Stop-Loss 1.2850. Take-Profit 1.2960, 1.3000, 1.3100, 1.3210, 1.3300, 1.3400, 1.3460   *) For up-to-date and detailed analytics and news on the forex market visit Tifia Forex Broker website tifia.com
|
|
#68
18-08-2017, 11:46
|
||||
|
||||
|
EUR/USD: The ECB is concerned about the strengthening of the euro
18/08/2017 Current dynamics Despite the decline in the dollar, the pair EUR / USD remains under pressure (so far in the short term). Published on Thursday, the minutes of the July meeting of the ECB pointed out that the central bank is concerned about the strengthening of the single European currency this year. "There were fears about the risk of excessive growth of the euro in the future", - so it was said in the minutes. The strengthening of the Euro-currency negatively affects the economy of the Eurozone, as it makes European goods less competitive abroad. Weak rates of inflation in the Eurozone also contribute to the ECB's prolonging the stimulus program for the Eurozone economy for at least six months. As you know, the program QE in the Eurozone ends in December. Despite the fact that the Eurozone economy shows signs of stable growth, which is also due to the ECB, which pursues an extra soft monetary policy, inflation is still far below the target level of the ECB just below 2.0%. At the same time, the dollar also remains under pressure after the minutes published on Wednesday from the July Fed meeting. Investors continue to assess the prospects for an increase in the Federal Reserve's key interest rate in December with a probability of below 40%. The leadership of the US central bank still can not unanimously decide to raise rates in conditions of slow inflation. And this is a negative factor for the dollar. Thus, the EUR / USD pair is currently in the grip of the need to maintain a low interest rate in the Eurozone and the Fed's hesitancy in the matter of monetary policy, which makes both currencies vulnerable from this point of view. The US dollar, meanwhile, declined during the Asian session and at the beginning of the European session. If we consider that today is the last trading day of the week, then in the second half of the US session, we should expect some strengthening of the US currency against the background of closing short positions on the dollar and fixing profits. The news background is calm today. Volatility may intensify at the beginning of the US trading session, when at 12:30 (GMT) the consumer price index (CPI) in Canada (for July) is published. *)An advanced fundamental analysis is available on the Tifia Forex Broker website at tifia.com/analytics Support and resistance levels The pair EUR / USD is in a downward correction short-term trend since the beginning of August, when strong data was published from the US labor market. Repeated attempts to test the support level 1.1690 (EMA144 on the 4-hour chart) have not yet led to its breakdown. If the EUR / USD decline continues, the breakdown of the support level 1.1630 (EMA200 on 4-hour and weekly charts) will strengthen the risks of a return to the downtrend. However, only in case of breakdown of the support level 1.1150 (EMA200 on the daily chart) will EUR/USD return to a downtrend. Indicators OsMA and Stochastics do not give a clear signal. In the alternative scenario and after the breakdown of the local resistance level 1.1780 (the Fibonacci retracement level of 38.2% of the corrective growth from the lows reached in February 2015 in the last wave of the global decline from 1.3900), the EUR / USD is likely to strengthen further. The growth targets will be the levels of 1.1835, 1.1890 (the highs of the year), 1.1950, 1.2050, 1.2180 (50% Fibonacci level). Support levels: 1.1690, 1.1630 Resistance levels: 1.1780, 1.1835, 1.1890, 1.1910, 1.1950, 1.2050, 1.2180 Trading Scenarios Sell in the market. Stop-Loss 1.1785. Take-Profit 1.1690, 1.1630, 1.1600, 1.1550 Buy Stop 1.1785. Stop-Loss 1.1710. Take-Profit 1.1835, 1.1890, 1.2000, 1.2050, 1.2100, 1.2180   *) For up-to-date and detailed analytics and news on the forex market visit Tifia Forex Broker website tifia.com
|
|
#69
21-08-2017, 10:52
|
||||
|
||||
|
DJIA: the decline continues
21/08/2017 Current dynamics After Thursday, Wal-Mart Stores and Cisco Systems reported on the results, their shares fell significantly, pulling the Dow Jones Industrial Average, which dropped 1.2% (274 points) to 21751 points. This was the most significant decline since May 2017. The shares of all 30 companies, traded in DJIA, and all 11 main sectors in the S & P500 index fell. A portion of the disappointing financial statements of companies, which include large retailers and giants of the technology sector, as well as the terrorist attack in Spain, provoked the strongest intraday drop in the major US stock indices, which was the second this month. On Monday, there is a continued decline in major US stock indexes, including DJIA. Investors' attention this week will be focused on comments by representatives of world central banks, including Fed Chairman Janet Yellen and ECB President Mario Draghi. In general, the negative mood of investors, the tendency to exit from risky assets and the withdrawal of funds into safe assets prevail. Thus, the yield of 10-year US bonds rose to 2.202% from 2.196%, gold quotes also remain propped up after last Friday the price of gold exceeded the annual maximum and the mark of 1300.00 dollars per ounce for a short time. If today the decline in indices continues, it will be the third consecutive week of falling indices. The news background today for the US stock market, in general, is neutral. Low trading volumes and investor caution on the eve of the Jackson Hole conference increase the likelihood of a short-term spike in volatility and a return of the price to the current range. *)An advanced fundamental analysis is available on the Tifia Forex Broker website at tifia.com/analytics Support and resistance levels Having broken through the important short-term support levels 21825.0 (EMA144 on the 4-hour chart), 21755.0 (EMA200), DJIA found today support at the level of 21650.0 (EMA50 on the daily chart). The predominant negative short-term dynamics. Indicators OsMA and Stochastics on the 4-hour, daily, weekly charts went to the side of sellers. Probably the continuation of the correction decrease to the level of support 21500.0 (the bottom line of the ascending channel on the daily chart). In case of resumption of growth and consolidation above the level of 21825.0 (EMA144 on the 4-hour chart), the DJIA will move towards the recent absolute maximum near the level of 22177.0. If the decline continues, then after the breakdown of the support level of 21500.0, the target may be the support level of 20630.0 (Fibonacci level of 23.6% correction to the wave growth from the level of 15660.0 after recovery in February of this year to the collapse of the markets since the beginning of the year.The maximum of this wave and the level Fibonacci 0% is near the mark of 22000.0). Through the level 20630.0 also passes EMA200 on the daily chart. This level, therefore, is key to the bullish trend of DJIA. Support levels: 21710.0, 21650.0, 21500.0, 21300.0, 21000.0, 20630.0 Resistance levels: 21770.0, 21840.0, 21950.0, 22060.0, 22177.0, 22300.0 Trading Scenarios Buy Stop 21785.0. Stop-Loss 21600.0. Take-Profit 21825.0, 21950.0, 22060.0, 22177.0, 22300.0 Sell Stop 21600.0. Stop-Loss 21785.0. Take-Profit 21500.0, 21300.0, 21000.0, 20630.0   *) For up-to-date and detailed analytics and news on the forex market visit Tifia Forex Broker website tifia.com
|
|
#70
22-08-2017, 11:18
|
||||
|
||||
|
USD/CAD: the US dollar is recovering
22/08/2017 Current dynamics During today's Asian session and at the beginning of the European session, the US dollar is restoring its positions in the foreign exchange market. In recent days, both domestic political uncertainty in the US, as well as ambiguous US economic indicators, have reduced the hopes of investors who are betting on the growth of the dollar that the Federal Reserve will implement the third rate hike this year. According to interest rate futures, on Monday, market participants assessed the likelihood of further increases in US Fed rates this year at 40% versus 43% last month. From 24 to 26 August in Jackson Hole (USA) will host an annual economic conference, organized by the Fed, which will address the heads of the world's largest central banks. In the center of attention is the speech of the head of the US Federal Reserve, Janet Yellen. She is expected to point out how the management of the central bank assesses the situation in the country's economy, and what are the prospects for further tightening of monetary policy in the US. If she makes any hints about the possibility of another interest rate hike by the end of the year, despite the low inflation in the US, the dollar will significantly strengthen in the foreign exchange market. Meanwhile, the Canadian dollar on Monday rose slightly against the US dollar, which was down against the major currencies. The strengthening of the Canadian currency was also due to the reduction in the difference in the yields of government bonds of Canada and the United States. Today, the US dollar is growing, restoring positions, which is also reflected in the growth of USD / CAD. Today its dynamics can be affected by the publication (at 12:30 GMT) of data on retail sales in Canada for June. The index is published monthly by Statistics Canada and estimates the total amount of retail sales. This index is often considered an indicator of consumer confidence and reflects the state of the retail sector in the short term. The growth of the index is usually a positive factor for CAD, the decline in the index will negatively affect CAD. A slight, almost zero, growth is expected (+ 0.3% vs. + 0.6% in May). If the data is even weaker, the Canadian dollar will fall in the foreign exchange market, including the USD / CAD pair. *)An advanced fundamental analysis is available on the Tifia Forex Broker website at tifia.com/analytics Support and resistance levels Late last month, the pair USD / CAD reached its next annual low near support level 1.2420 and returned to the range located between 1.2490 (EMA200) and 1.2740 (EMA144 on the weekly chart, Fibonacci level of 38.2% of the downward correction to the pair's growth in the global ascending Trend since September 2012 and the level of 0.9700). Near the level of 1.2740 also passes the top line of the descending channel on the daily chart and EMA200 on the 4-hour chart. In case of consolidation above the level of 1.2635 (EMA200 on the 1-hour chart), the USD / CAD growth will resume with the target of 1.2740. A more distant goal is the level of 1.3120 (EMA50 on the weekly chart, EMA200 on the daily chart and the December lows). The OsMA and Stochastic indicators on the 4-hour and weekly charts turned to long positions. If the pair continues to decline, the USD / CAD will go to support level 1.2490 (EMA200 on the weekly chart). The breakdown of support levels 1.2170 (50% Fibonacci level), 1.2030 (EMA200 on the monthly chart) will finally break the long-term bullish trend of the pair USD / CAD, which began in September 2012. Support levels: 1.2565, 1.2490, 1.2420, 1.2170, 1.2030 Resistance levels: 1.2605, 1.2635, 1.2700, 1.2740, 1.2785, 1.2800, 1.2860, 1.2920, 1.3015, 1.3120, 1.3200 Trading Scenarios Buy Stop 1.2610. Stop-Loss 1.2565. Take-Profit 1.2635, 1.2700, 1.2740, 1.2785, 1.2800, 1.2860, 1.2920 Sell Stop 1.2565. Stop-Loss 1.2610. Take-Profit 1.2500, 1.2400, 1.2170   *) For up-to-date and detailed analytics and news on the forex market visit Tifia Forex Broker website tifia.com
|
|
#71
23-08-2017, 11:59
|
||||
|
||||
|
NZD/USD: New Zealand economic growth forecasts revised
23/08/2017 Current dynamics According to a report published on Tuesday on economic and financial conditions in New Zealand, forecasts for the growth of the New Zealand economy were revised with a slight decrease. Finance Minister Stephen Joyce said that in the next four years, the average growth rate of New Zealand's GDP could reach 3%, whereas earlier it was forecasted an average annual growth rate of 3.1%. The New Zealand dollar is actively declining since the beginning of August. Over the past two days, the NZD / USD pair has declined by about 100 points or by 1.3%. This is also promoted by the growth of quotations of the US dollar on the eve of the economic conference in Jackson Hole, which will be held on August 24-26. The conference will feature the heads of the world's leading central banks. From the chairman of the Fed, Janet Yellen is waiting for statements in favor of a third increase in interest rates in the US for the current year. The dollar fell more than 7% this year, it will have a significant growth space if the Fed's rhetoric points to their tendency to tighten monetary and credit policy. The growth of the US dollar is also facilitated by the fact that investors are less concerned about the tensions between the US and North Korea, as well as political uncertainty in Washington. Yesterday's comments by Paul Ryan, Speaker of the House of Representatives of the US Congress, and Mitch McConnell, leader of the republican majority in the Senate, that the tax reform and raising the public debt limit will be implemented without difficulty, also contribute to improving investor sentiment towards the US currency. Today (22:45 GMT) important data on New Zealand's foreign trade balance are published. A slight increase in the balance deficit in July (-200 million New Zealand dollars) is expected, which should negatively affect the New Zealand dollar with the confirmation of the forecast. Any change in the state of the foreign trade balance of New Zealand will support the New Zealand currency. *)An advanced fundamental analysis is available on the Tifia Forex Broker website at tifia.com/analytics Support and resistance levels The pair NZD / USD broke through important short-term support levels of 0.7325 (EMA200 on the 4-hour chart), 0.7300 (EMA200 on the 1-hour chart) and currently trades at the support level of 0.7240 (Fibonacci level of 38.2% of the upward correction to the global fall wave Pair from the level of 0.8800, which began in July 2014, the minimums of December 2016). Indicators OsMA and Stochastics on the 4-hour, daily, weekly charts went to the side of sellers, signaling a strong negative impulse. While NZD / USD is trading above the support level of 0.7165 (EMA200 on the daily chart), the upward dynamics is maintained. In case of breakdown at the level of 0.7165, a further decline to support levels of 0.6860 (Fibonacci level of 23.6% and a lower limit of the range located between the levels of 0.7550 and 0.6860) is possible. At the level of 0.6860 are also the minimums of December 2016 and May 2017. A break at the level of 0.6860 will mean the end of the upward correction, which began in September 2015, and a return to the downward trend. The alternative scenario involves a return to the zone above the level of 0.7325 and the resumption of growth towards the annual maximum and the resistance level of 0.7550 (50% Fibonacci level and the upper limit of the rising channel on the weekly chart). Meanwhile, it is too early to talk about long positions on the NZD / USD pair. Only a breakdown at 0.7550 would mean the end of the global bearish trend. Support levels: 0.7240, 0.7165 Resistance levels: 0.7255, 0.7300, 0.7325, 0.7455, 0.7500, 0.7550 Trading scenarios Sell Stop 0.7205. Stop-Loss 0.7255. Take-Profit 0.7165 Buy Stop 0.7255. Stop-Loss 0.7205. Take-Profit 0.7300, 0.7325, 0.7455, 0.7500, 0.7550   *) For up-to-date and detailed analytics and news on the forex market visit Tifia Forex Broker website tifia.com
|
|
#72
24-08-2017, 11:37
|
||||
|
||||
|
Brent: prices stabilized in the range
24/08/2017 Current dynamics On Thursday, oil prices showed a slight decrease, without leaving the range between the levels of 53.00, 51.00 dollars per barrel of Brent crude oil. A wider range is located between the levels of 53.40, 50.0 dollars per barrel, in which Brent crude is traded last month. On Wednesday, the Energy Information Administration (EIA) of the US Energy Ministry reported a drop in commercial oil and gasoline reserves in the country. Thus, crude oil inventories fell by 3.3 million barrels (forecast was -3.375 million barrels), gasoline stocks fell by 1.2 million barrels last week (the forecast was 500,000 barrels). As a result, oil prices rose on Wednesday. Oil futures on the NYMEX closed up by 1.21% at $ 48.41 per barrel. The spot price for Brent crude at the end of yesterday's trading day was close to $ 52.20 per barrel, which is about $ 1.0 higher than the previous closing price. Nevertheless, significant price increases are not observed, despite the risks of interruptions in the work of US refineries associated with the storm in the Gulf of Mexico, and the reduction in oil and oil products in the United States. Prospects of growth in oil production in the US have a negative impact on oil prices. World oil supply in July, according to the International Energy Agency (IEA), rose by 520,000 barrels a day, even despite the arrangements in OPEC. Growth in the supply of oil has been observed for 3 consecutive months. The activity of US oil companies is growing, significantly offsetting OPEC's efforts to reduce oil production and exports. Today and tomorrow, investors will follow the speeches of the leaders of the Fed and the ECB at a conference in Jackson Hole on the plans of the central banks to tighten monetary policy. If Janet Yellen signals the markets about the possibility of another increase in the interest rate this year, the dollar will rise sharply in the foreign exchange market. Commodity prices, including oil, will come under pressure in this case. On Friday at 5:00 pm (GMT), Baker Hughes, the oil service company, will publish a weekly report on the number of active drilling platforms in the US, which is an important indicator of the activity of the US oil sector and significantly affects the quotations of oil prices. If the number of installations increases again, this will also negatively affect oil prices. *)An advanced fundamental analysis is available on the Tifia Forex Broker website at tifia.com/analytics Support and resistance levels The price for Brent crude was in the range between levels of 53.40, 50.0 dollars per barrel in August. Despite today's decline, the price keeps positive dynamics above the key support levels of 50.70 (EMA50 on the weekly chart, as well as the Fibonacci level of 61.8% correction to the decline from the level of 65.30 from June 2015 to the absolute minimums of 2016 near the 27.00 mark), 50.90 (EMA200, EMA144 on the daily chart). Indicators OsMA and Stochastics on the 4-hour, daily, weekly charts again moved to the side of buyers. If the growth continues, the target will be 52.90 (EMA144 on the weekly chart), 53.40 (August highs), 54.70 (EMA200 on the weekly chart and the upper bound of the rising channel on the daily chart). The scenario for the decline involves a breakdown at the level of 50.70. The targets then will be support levels of 50.00, 48.75, 48.00, 46.20 (50% Fibonacci level), 44.50 (lows of the year). A more distant target is the level 41.70 (the Fibonacci level of 38.2% and the lower border of the descending channel on the weekly chart), which increases the risks of price return in the bearish trend. Support levels: 51.30, 50.90, 50.70, 50.00, 48.75, 48.00, 47.70, 46.20, 45.50, 44.50, 41.70 Resistance levels: 52.90, 53.40, 54.00, 54.70 Trading Scenarios Sell by the market. Stop-Loss 52.35. Take-Profit 51.30, 50.90, 50.70, 50.00, 48.75, 48.00, 47.70, 46.20 Buy Stop 52.35. Stop-Loss 51.70. Take-Profit 52.90, 53.40, 54.00, 54.75   *) For up-to-date and detailed analytics and news on the forex market visit Tifia Forex Broker website tifia.com
|
|
#73
25-08-2017, 10:40
|
||||
|
||||
|
EuroStoxx50: Stabilization before the speech of the head of the ECB
25/08/2017 Market participants took a wait-and-see approach on the eve of the Fed Chairman's statement (14:00 GMT) and the ECB head (19:00 GMT). As follows from the minutes of the ECB meeting of July 20 published last week, the ECB's Governing Council is alarmed by the current strength of the euro. It is likely that the ECB will not rush to tighten the policy. Mario Draghi will try not to disturb the markets and is likely to favor the extension of the QE program and will be concerned about the high cost of the euro. In this case, the European indices will receive support and an incentive to resume growth. *)An advanced fundamental analysis is available on the Tifia Forex Broker website at tifia.com/analytics Levels of support and resistance Since May, when the EuroStoxx50 index reached its annual maximum near the 3680.0 mark, a downward correction began. The EuroStoxx50 index fell to support level 3440.0 (EMA144 on the daily chart and Fibonacci level of 23.6% of the downward correction to the wave of growth since July 2016 and from the level of 2675.0). In case of breakdown of the level 3440.0, the EuroSTOXX50 index will go to the key support level of 3400.0 (EMA200 on the daily chart). Breakdown of this level increases the risks of further decline and breakdown of the bullish trend. The reduction targets then can be support levels 3295.0 (Fibonacci level 38.2%), 3265.0 (EMA200, EMA144 on the weekly chart). The negative dynamics prevails. The European stock indexes are significantly influenced by the expectation of an early curtailment of the QE program in the Eurozone, which ends in December. Preferred short positions, until the situation on this issue is clarified, and the QE program will not be extended. Support levels: 3440.0, 3400.0, 3325.0, 3295.0, 3265.0 Resistance levels: 3482.0, 3500.0, 3590.0, 3610.0, 3680.0, 3700.0 Trading Scenarios Sell Stop 3430.0. Stop-Loss 3480.0. Take-Profit 3390.0, 3325.0, 3295.0, 3265.0 Buy Stop 3480.0. Stop-Loss 3430.0. Take-Profit 3550.0, 3590.0, 3610.0, 3680.0, 3700.0   *) For up-to-date and detailed analytics and news on the forex market visit Tifia Forex Broker website tifia.com
|
|
#74
28-08-2017, 11:15
|
||||
|
||||
|
NZD/USD: Janet Yellen did not mention the topic of raising rates
28/08/2017 Current dynamics The head of the Fed, Janet Yellen, disappointed investors who were betting on the growth of the US dollar, after not speaking last Friday on the topic of monetary policy and not signaling a further increase in the rate. The US dollar fell sharply on Friday, and 10-year US government bonds rose in price. Their yield on the basis of trading on Friday was 2.169% against 2.194% on Thursday. Gold futures on Friday in the US rose in price by 0.4%, to 1291 dollars per ounce. Meanwhile, the New Zealand dollar became the leader of the decline last week after the New Zealand government lowered its forecast for economic growth for 2017-2018. Treasury Secretary Steven Joyce said that in the next four years, the average growth rate of New Zealand's GDP could reach 3%, whereas earlier it was forecasted an average annual growth rate of 3.1%. The New Zealand dollar remains under pressure also on the eve of the forthcoming parliamentary elections in the country, scheduled for September 23. On September 27, the RBNZ regular meeting on monetary policy will be held. In early August, RBNZ kept the current interest rate in New Zealand at the same level of 1.75%. The RBNZ stated that against the backdrop of "many uncertainties", monetary policy "will remain soft in the foreseeable future", but "can be adjusted accordingly". For a stable recovery of the New Zealand economy and rising inflation, "a lower New Zealand dollar rate is needed". It is likely that the interest rate will remain at the current level of 1.75%, and in the RBNZ will once again confirm the bank's propensity to pursue a soft monetary policy, which will keep the pressure on the New Zealand currency. For today, the economic calendar is empty. In the course of the American session, a correction is likely on the US dollar against its decline on Friday. *)An advanced fundamental analysis is available on the Tifia Forex Broker website at tifia.com/analytics Technical analysis In July, the pair NZD / USD reached a new annual high near the mark of 0.7550 (Fibonacci level of 50% and the upper limit of the rising channel on the weekly chart). However, the further growth of the pair stalled. In the future, as a result of the active decline, NZD / USD broke through the important support levels of 0.7300 (EMA200 on the weekly chart), 0.7240 (the Fibonacci level of 38.2% of the upward correction to the global wave of decline of the pair from the level of 0.8800, which began in July 2014, the low of December 2016) and decreased to the level of support 0.7190 (EMA144 on the daily chart). The pressure on the New Zealand dollar and the NZD / USD pair persists. Indicators OsMA and Stochastics on the daily, weekly charts went to the side of sellers. It is likely that the decline will continue to levels 0.7190, 0.7165 (EMA200 on the daily chart). In the case of breakdown at the level of 0.7165, a further decline to support levels of 0.6860 (Fibonacci level of 23.6% and a lower range between 0.7550 and 0.6860 levels) is possible. At the level of 0.6860 are also the minimums of December 2016 and May 2017. A break at the level of 0.6860 will mean the end of the upward correction, which began in September 2015, and a return to the downward trend. The alternative scenario involves a return to the zone above the level of 0.7300 and a resumption of growth towards the annual maximum and the resistance level of 0.7550 (50% Fibonacci level and the upper limit of the uplink on the weekly chart). Support levels: 0.7190, 0.7165 Resistance levels: 0.7300, 0.7320, 0.7455, 0.7500, 0.7550 Trading Scenarios Sell Stop 0.7220. Stop-Loss 0.7260. Take-Profit 0.7190, 0.7165 Buy Stop 0.7260. Stop-Loss 0.7220. Take-Profit 0.7300, 0.7320, 0.7455, 0.7500, 0.7550   *) For up-to-date and detailed analytics and news on the forex market visit Tifia Forex Broker website tifia.com
|
|
#75
29-08-2017, 12:13
|
||||
|
||||
|
Brent: amid the hurricane in the US
29/08/2017 Current dynamics The dollar continues to decline actively in the foreign exchange market. Nevertheless, on oil prices denominated in dollars, so far this fact is reflected little. Much more impact on oil prices had a storm in the US in the Houston area, a hurricane, later a "tropical storm", Harvey. Hurricane caused damage to oil refineries located in this part of the US, leading to their closure. Nearly 30% of the country's oil refining facilities are located on the Texas coast. Also, several offshore oil and gas platforms in the Gulf of Mexico were closed, accounting for about 22% of offshore oil production in the Gulf. Their closure will negatively affect oil demand in the US, and will also affect world oil prices. According to experts of the oil market, the negative impact of the consequences of the storm can drag on for several weeks, because it will take time to restart the refinery. Even yesterday, futures for Brent crude on ICE Futures fell 1.3% to 51.74 dollars per barrel. Today, oil prices continued to decline. The spot price for Brent crude at the beginning of today's European session was close to $ 51.00 per barrel. Wednesday (14:30 GMT) will publish weekly data of the Ministry of Energy on oil reserves in the US. Decrease in demand from the refinery will probably cause an increase in inventories, since oil produced earlier and domestically is not being processed. This can cause pressure on oil prices. Also today, it is worth paying attention to the weekly published data at 20:30 (GMT) on oil reserves from the American Petroleum Institute, which largely correlates with official data from the US Energy Ministry. *)An advanced fundamental analysis is available on the Tifia Forex Broker website at tifia.com/analytics Support and resistance levels The price of Brent oil broke through the short-term support level of 51.65 (EMA50 on the 4-hour chart, EMA200 on the 1-hour chart) and found support today at 50.95 (EMA200 on the 4-hour chart, EMA144 on the daily chart, EMA50 on the weekly chart). Short-term negative dynamics prevails. In case of breakdown of the support levels of 50.95, 50.70 (EMA50 on the weekly chart, as well as the Fibonacci level of 61.8% of the correction to the decline from the level of 65.30 from June 2015 to the absolute minimums of 2016 near the 27.00 mark), the decline may last to the support level of 50.00 (lows August). Further objectives are support levels 48.75, 48.00, 46.20 (50% Fibonacci level), 44.50 (year lows). A more distant goal is the level 41.70 (the Fibonacci level of 38.2% and the lower boundary of the descending channel on the weekly chart), which increases the risks of price return in the bearish trend. Indicators OsMA and Stochastics on the 4-hour, daily, weekly charts again moved to the side of sellers. In case of resumption of growth and breakdown of resistance level 52.20, the target will be 52.90 (EMA144 on the weekly chart), 53.40 (August highs), 54.70 (EMA200 on the weekly chart and the upper bound of the rising channel on the daily chart). Support levels: 50.95, 50.70, 50.00, 48.75, 48.00, 47.70, 46.20, 45.50, 44.50, 41.70 Levels of resistance: 51.65, 52.20, 52.90, 53.40, 54.00, 54.70 Trading Scenarios Sell by the market. Stop-Loss 51.70. Take-Profit 50.90, 50.70, 50.00, 48.75, 48.00, 47.70, 46.20 Buy Stop 51.70. Stop-Loss 50.80. Take-Profit 52.00, 52.20, 52.90, 53.40, 54.00, 54.75   *) For up-to-date and detailed analytics and news on the forex market visit Tifia Forex Broker website tifia.com
|
|
#76
30-08-2017, 11:32
|
||||
|
||||
|
EUR/USD: the dollar continues to weaken
30/08/2017 Current dynamics The sharp increase in EUR / USD, observed from the beginning of the year and, especially, in recent days, is connected both with the weakening of the dollar and with the continuing purchases of the euro. Heads of the Fed and the ECB did not make any hints at the last conference in Jackson Hole about the timing of further interest rate hikes. Investors regarded this as the Fed's tendency to soft monetary policy and that the current euro rate is satisfied with the ECB leaders. Since the beginning of this year, the trade-weighted index of the euro has increased by more than 7%. This was the best result for the currency since its inception in 1999. The single European currency receives support and against the backdrop of strengthening the economy of the Eurozone, which is often mentioned by the head of the ECB Mario Draghi. Euro since the beginning of the year it has added more than 14% against the dollar. The pair EUR / USD has reached the maximum mark since January 2015. In the minutes of the July meeting of the ECB, there were "concerns about the rise in value (euro) in the future". Nevertheless, many economists believe that the ECB will begin to wind down the bond purchase program in December this year. The ECB simply does not have assets to buy. At the same time, the ECB is in a difficult situation, since inflation is below the target level of just under 2.0%. Still, the ECB is likely to have to roll back the stimulus even if the outlook for inflation worsens. In view of this, it is likely that the euro will continue to grow. Much will depend also on the pace at which the ECB will begin to reduce purchases of assets. Today we are waiting for the data from the USA. Starting at 12:15 (GMT) a number of important macroeconomic indicators will appear, including the report on employment from ADP for August, data on spending on personal consumption in the US for the second quarter, annual GDP for the second quarter. In this period, a surge in volatility is expected in trading in financial markets, including the EUR / USD pair, which should be taken into account when opening trade positions at this time. The GDP is expected to grow by 2.7% (against + 2.6% in the first quarter). If the forecast is justified, the dollar will receive support. Meanwhile, the prospect of further weakening of the USD and the growth of the EUR / USD pair remains. *)An advanced fundamental analysis is available on the Tifia Forex Broker website at tifia.com/analytics Support and resistance levels Despite the current corrective decline, the pair EUR / USD keeps positive dynamics, trading in the uplink on the daily chart. Yesterday EUR / USD set another 4-month record, reaching 1.2070 and returning to the levels of December 2014. If the growth resumes, the targets will be the levels of 1.2050 (low of July 2012), 1.2070, 1.2180 (the Fibonacci level of 50% of the corrective growth from the minimums reached in February 2015 in the last wave of global decline from 1.3900), 1.2370 (EMA200 on the monthly chart). You can return to consideration of short positions in case of EUR / USD return to support level 1.1780 (Fibonacci level 38.2%). The breakthrough of support level 1.1620 (EMA200 on the weekly chart) increases the risk of EUR / USD returning to a downward global trend. Support levels: 1.1890, 1.1835, 1.1780, 1.1720, 1.1670, 1.1620 Resistance levels: 1.2050, 1.2070, 1.2100, 1.2180 Trading Scenarios Sell Stop 1.1920. Stop-Loss 1.1985. Take-Profit 1.1890, 1.1835, 1.1780, 1.1720, 1.1670, 1.1620 Buy Stop 1.1985. Stop-Loss 1.1920. Take-Profit 1.2050, 1.2070, 1.2100, 1.2180   *) For up-to-date and detailed analytics and news on the forex market visit Tifia Forex Broker website tifia.com
|
|
#77
31-08-2017, 14:48
|
||||
|
||||
|
S&P500: indexes rose against the backdrop of strong macro data
31/08/2017 Current dynamics Strong macro data, received from the US at the beginning of today's US session, caused the growth of the main US stock indices. Nasdaq Composite climbed 18.00 points (0.30%), S & P500 rose 6.34 points (0.26%), DJIA started trading with an increase of 47.83 points (0.22%). Personal incomes of Americans in July increased by 0.4% (the forecast was + 0.3%), personal expenses (indicator, estimating household costs) in July, adjusted for seasonal fluctuations, increased by 0.3% (forecast was +0, 4%). The increase in income raises the Americans' confidence in the government and economy. Consumer spending accounts for the bulk of US GDP. Published on Thursday, the report showed that the annual growth in US GDP in the 2nd quarter of this year was 3%. Presented by the US Department of Commerce data indicate a positive momentum in the US economy in the second half of the year. However, the price index for personal consumption expenditure (RFE), the Fed's preferred inflation indicator, rose 0.1% in July from the previous month after a lack of growth in June and a drop of 0.1% in May. Compared to the same period last year, the index grew by 1.4%, which is below the target level of the Fed, which is 2%. Presented today by the US Department of Labor data indicate a steady increase in employment. Thus, the number of initial applications for unemployment benefits was 236,000 in the week of August 20-26. The number of primary applications has fluctuated historically in the past few years. They remain below 300,000 for 130 consecutive weeks, which is the longest period since 1970. As a percentage of labor, the indicator of layoffs is at the lowest level since the 1960s. Secondary applications for unemployment benefits fell by 12,000 to 1.942 million. The consistently low level of applications for unemployment benefits is one of the signs of a strong labor market, which is approaching the state of maximum employment. Against the backdrop of the data, US stock indexes rose. The growth of the indices continues, therefore, for the fourth trading session in a row, and for the seventh month in a row, which indicates the confidence of investors in the strength of the American economy. At the same time, the weakness of inflationary pressures in the US economy makes it more difficult for the Federal Reserve to raise short-term interest rates before the end of the year. Thus, the data presented today contribute to the further growth of the US stock market. It seems that the consequences of Hurricane Harvey, the geopolitical tensions associated with the terrorist attacks in Europe and the provocations with missile launches by North Korea are receding into the background. And, in general, the positive dynamics of the US stock market remains. *)An advanced fundamental analysis is available on the Tifia Forex Broker website at tifia.com/analytics Support and resistance levels Twice this month, pushing away from the support level of 2418.0 (the bottom line of the rising channel on the daily chart), the S & P500 index keeps positive dynamics and is traded in the uplink on the weekly chart. There is a possibility of further growth. The alternative scenario will be connected with the breakdown of the short-term support level 2450.0 (EMA200 on the 4-hour chart) and the continuation of the decline with the targets 2405.0 (June-July low and the lower limit of the uplink on the weekly chart), 2390.0 (March highs). The upward trend in the S & P500 index is maintained as long as it trades above the key support levels of 2365.0 (EMA200 on the daily chart), 2325.0 (Fibonacci level of 23.6% correction to growth since February 2016). About the reversal of the bullish trend is not yet talking. Support levels: 2450.0, 2433.0, 2418.0, 2405.0, 2390.0, 2365.0, 2325.0 Resistance levels: 2473.0, 2481.0, 2489.0, 2500.0 Trading Scenarios Sell Stop 2454.0. Stop-Loss 2474.0. Objectives 2450.0, 2433.0, 2418.0, 2405.0, 2390.0, 2365.0, 2325.0 Buy Stop 2474.0. Stop-Loss 2454.0. Objectives 2481.0, 2489.0, 2500.0   *) For up-to-date and detailed analytics and news on the forex market visit Tifia Forex Broker website tifia.com
|
|
#78
01-09-2017, 11:32
|
||||
|
||||
|
DJIA: US stock indexes continue to grow
01/09/2017 Current dynamics Major US stock indexes began the month with a slight increase. Investors are waiting for a monthly report on the US labor market, which will be published at 12:30 (GMT). This report is extremely important in assessing the prospects for the dollar and the US stock market, because it characterizes the stability of the US economy, the largest in the world. On Thursday, US stock indexes rose thanks to a series of positive macro data. According to a report published by the US Department of Commerce on Thursday, the costs and incomes of Americans grew quite rapidly in July. The index of prices for personal consumption expenditure (PCE) increased by 1.4% compared to the same period of the previous year. The income of Americans in July rose by 0.4% compared to June, which was the strongest growth since February. Americans have a large amount of cash for the next few months ahead, which could have a positive impact on GDP growth. Data from ADP for August, which characterize the level of employment in the private sector of the US economy, also came out better than the forecast, indicating that the labor market is approaching full employment. And at the same time, the US economy has a controversial situation: the growth of consumer spending in combination with the fall in unemployment indicates a fairly rapid and stable economic growth. However, inflation still remains slow, below the target level of the Fed in 2%. In the data block from the US labor market, investors are particularly interested in the wage growth indicator, which will be used to judge the prospects for monetary policy in the coming months. Although unemployment is low and job creation is stable, wages have been rising at a moderate pace for a long time. In view of the low inflation of space, the Federal Reserve has little to raise rates. According to futures on federal funds, which track the CME Group, investors estimate the probability of a rate hike by the end of December at 37%. And yet, the overall state of the US economy is encouraging, prompting investors to buy high-yielding high-risk assets. This is evidenced by the multi-month bullish trend of the US stock market. And, if today's publication of data from the US labor market is also positive, close to the forecast values, the US stock indexes will continue to grow. *)An advanced fundamental analysis is available on the Tifia Forex Broker website at tifia.com/analytics Support and resistance levels DJIA maintains positive dynamics and continues to grow in the uplink on the daily chart, striving for the level of 22177.0 (the highs of the year and August). Long positions are relevant. Only in case of breakdown of the important support levels 21800.0 (EMA200 on the 4-hour chart), 21700.0 (EMA50 and the bottom line of the ascending channel on the daily chart), we can return to consideration of short positions on the DJIA. Indicators OsMA and Stochastics on the 4-hour, daily charts are on the buyers side. In case of breakdown of the support level 21700.0, the target of the decrease may be support levels 20750.0 (EMA200 on the daily chart), 20630.0 (Fibonacci level of 23.6% correction to the wave growth from the level of 15660.0 after recovery in February this year to the collapse of the markets since the beginning of the year. The maximum of this wave, and the Fibonacci level of 0%, is near the mark of 22177.0). Levels 20750.0, 20630.0, thus, are key to long-term bullish trend of DJIA. Support levels: 21800.0, 21700.0, 21500.0, 21300.0, 21000.0, 20750.0, 20630.0 Resistance levels: 22060.0, 22177.0, 22300.0 Trading Scenarios Buy Stop 22050.0. Stop-Loss 21950.0. Take-Profit 22177.0, 22300.0, 22350.0 Sell Stop 21950.0. Stop-Loss 22050.0. Take-Profit 21800.0, 21700.0, 21500.0, 21300.0, 21000.0, 20750.0   *) For up-to-date and detailed analytics and news on the forex market visit Tifia Forex Broker website tifia.com
|
|
#79
04-09-2017, 11:02
|
||||
|
||||
|
GBP/USD: amid talks on Brexit
04/09/2017 Current dynamics The GDP growth in the UK this year has significantly slowed. Economic growth in the 1st and 2nd quarters was half that of the last three months of 2016. High inflation, exceeding the target level of the Bank of England, continues to reduce the disposable income of the British, which reduces domestic demand. The British economy, largely dependent on domestic consumption, grew by only 0.3% in the second quarter (+ 0.2% in the first quarter). In a situation of shrinking domestic demand, British companies will have to increase capital investment. The decline in consumer spending and the slowdown in the UK economy, which are taking place against the background of Brexit, will help the Bank of England continue to adhere to extra soft monetary policy. As you know, last summer the Bank of England lowered the interest rate to a record level of 0.25%, the lowest for the last 300 years. The slowdown in the UK economy, the protracted Brexit talks and the unclear prospects for the monetary policy of the UK central bank continue to have a negative impact on the pound quotes. It is likely that the pound will remain under pressure at the beginning of this week before the debate in parliament on Thursday. On Friday (11:30 GMT + 3), the National Statistical Office of Great Britain will publish July data on industrial production and manufacturing in the manufacturing industry, which will allow us to assess the state of the British economy at the beginning of the third quarter. It is expected that the data will come with almost zero growth, which will also negatively affect the quotes of the pound. Today, most of the US financial markets are closed due to the celebration of Labor Day. The low activity of traders and low trading volumes in the foreign exchange market are expected. The growth of volatility in the foreign exchange market will begin tomorrow, when during the Asian session (02:01 GMT + 3) the British Retail Consortium (BRC) will publish a report on retail sales for August, and at 07:30 (GMT + 3) the RBA will publish a decision on interest rate in Australia. *)An advanced fundamental analysis is available on the Tifia Forex Broker website at tifia.com/analytics Support and resistance levels Despite continued pressure on the pound, the pair GBP / USD remains positive, trading above support levels 1.2935 (EMA200 on the 4-hour chart, EMA50 on the daily chart), 1.2860 (EMA200 on the daily chart) in the uplink on the daily chart. Breakdown of the local resistance level 1.2980 will create the prerequisites for the recovery of the mid-term upward correction trend. The closest target in this case will be the resistance level 1.3210 (Fibonacci level 23.6% correction to the decline in the GBP / USD pair in the wave, which began in July 2014 near the level of 1.7200). Levels of 1.3300 (the upper limit of the channel on the weekly chart), 1.3460 (July and September highs) will be the next growth target. A fall below support level 1.2860 will strengthen the risk of GBP / USD returning to a downtrend. Indicators OsMA and Stochastics on the 4-hour, daily, weekly, monthly charts were deployed to short positions. Support levels: 1.2935, 1.2912, 1.2860, 1.2800 Resistance levels: 1.2980, 1.3000, 1.3100, 1.3210, 1.3300, 1.3400, 1.3460 Trading Scenarios Sell Stop 1.2910. Stop-Loss 1.2990. Take-Profit 1.2860, 1.2765, 1.2700, 1.2640, 1.2590, 1.2550, 1.2365 Buy Stop 1.2990. Stop-Loss 1.2910. Take-Profit 1.3050, 1.3100, 1.3210, 1.3300, 1.3400, 1.3460   *) For up-to-date and detailed analytics and news on the forex market visit Tifia Forex Broker website tifia.com
|
|
#80
05-09-2017, 11:45
|
||||
|
||||
|
NZD/USD: rebound from the support level of 0.7165
05/09/2017 Current dynamics After yesterday, marked by sluggish dynamics and low volumes, today we see an increase in volatility and the resumption of a decline in the US dollar. The continuing tension in the Asia-Pacific region continues to stimulate purchases of assets-shelters, such as gold, yen, and franc. There is also an increase in the prices of oil and other commodities, along with which the quotations of commodity currencies are growing. The New Zealand dollar is also growing today against the US dollar, despite a number of fundamental factors. This is the continuing commitment of the RBNZ to conducting soft monetary policy, the uncertainty surrounding the elections in New Zealand scheduled for September 23, geopolitical tensions in the region due to the continuing provocations by North Korea against the US and Japan. For a stable recovery in the New Zealand economy and rising inflation, "a lower New Zealand dollar rate is needed", the RBNZ said recently. We are waiting for today data from the auction of dairy products, the publication of which is scheduled for the period after 14:00 (GMT). The price index for dairy products, prepared by Global Dairy Trade, came out last time with a value of -0.4%. If the prices for milk powder decrease again, it will have a negative impact on the New Zealand dollar. *)An advanced fundamental analysis is available on the Tifia Forex Broker website at tifia.com/analytics Support and resistance levels Today, NZD / USD is trading in the range between support levels of 0.7165 (EMA200), 0.7190 (EMA144 on the daily chart). A breakthrough in one direction or another may determine the direction of further medium-term movement of the NZD / USD pair. The fastening above the levels of 0.7240 (the Fibonacci level of 38.2% of the upward correction to the global wave of decline of the pair from the level of 0.8800, which began in July 2014, the minimums of December 2016), 0.7270 (EMA200 on 4-hour, weekly charts) will confirm the return of the upward dynamics. In the alternative scenario and in case of a breakdown of the level 0.7165, a further decline to the support levels 0.6860 (Fibonacci level of 23.6% and the lower limit of the range located between the levels of 0.7550 and 0.6860) is possible. A break at the level of 0.6860 will mean the end of the upward correction, which began in September 2015, and a return to the downward trend. Indicators OsMA and Stochastics on the daily, weekly charts recommend short positions. Support level: 0.7165 Resistance levels: 0.7190, 0.7240, 0.7270, 0.7300, 0.7320, 0.7455, 0.7500, 0.7550 Trading Scenarios Sell Stop 0.7170. Stop-Loss 0.7210. Take-Profit 0.7160, 0.7100, 0.7000, 0.6860 Buy Stop 0.7210. Stop-Loss 0.7170. Take-Profit 0.7240, 0.7270, 0.7300, 0.7320, 0.7455, 0.7500, 0.7550   *) For up-to-date and detailed analytics and news on the forex market visit Tifia Forex Broker website tifia.com
|
|
|
|
 Similar Threads
|
||||
| Thread | Thread Starter | Forum | Replies | Last Post |
| Tifia Daily Market Analytics | TifiaFX | Forex Analysis | 0 | 22-03-2017 14:17 |
| Tifia Daily Market Analytics | TifiaFX | Forex Analysis | 0 | 16-03-2017 14:48 |
| Tifia Daily Market Analytics | TifiaFX | Forex Analysis | 0 | 14-03-2017 09:52 |
| Daily Market Analysis by FxGrow | FxGrow10 | Forex Analysis | 0 | 06-05-2015 01:03 |
| Daily Market update by UWC | effexx | Trading Journals | 156 | 01-03-2012 10:40 |


