Forex Forums | ForexLasers.com |
|
|||||||
 |
|
|
LinkBack | Thread Tools | Search this Thread |
|
#1
 23-03-2017, 12:24
|
||||
|
||||
|
NZD/USD: the interest rate has not changed
23/03/2017 Overview and Dynamics As already known, on Wednesday evening, the Reserve Bank of New Zealand saved the key rate unchanged at 1.75%. As RBNZ Governor Graham Wheeler said later, "monetary policy will remain soft for a long time." In New Zealand, property prices are steadily growing, while the growth of inflation and economy in the country, according to the RBNZ, is still insufficient. In general, such a decision of the bank was the expected market participants. The main attention of investors in the dynamics of the NZD / USD pair is now focused on the dynamics of the US dollar, which has significantly surrendered its positions in the foreign exchange market recently. Nevertheless, today the US dollar can get support. At 12:45 (GMT), the speech of the head of the Federal Reserve, Janet Yellen, begins. If she gives a signal to accelerate the rate of rate hikes in the US, then the dollar's position may strengthen in the foreign exchange market. Also worth paying attention to today's publication (at 21:45 GMT) of New Zealand's trade balance for February. It is expected that the trade surplus will be NZ $ 160 million (against NZ $ -285 million in January). The main export item of the country is dairy products and especially dried milk. Against the backdrop of the negative dynamics of prices for milk powder, observed in February, expectations regarding the growth of the surplus balance may not be justified. If the trade balance data is weak, the New Zealand dollar may fall in the foreign exchange market. Technical analysis In the course of today's European session, the NZD / USD pair is declining. The pair could not develop an upward movement above the level of 0.7065 (EMA200 on the 4-hour chart). Indicators OsMA and Stochastics on the 1-hour and 4-hour charts went to the side of sellers, signaling the completion of the upward correction, which began on March 9 from the level of 0.6890 (the lower limit of the descending channel on the 4-hour chart). The NZD / USD pair also remains below the key resistance level of 0.7085 (EMA200 on the daily chart). Below this level, the negative dynamics of the NZD / USD pair will prevail. Only in case of consolidation above the level of 0.7085 can long long-term positions in the NZD / USD pair with the growth probability to the levels of 0.7235 (EMA144 on the weekly chart), 0.7310 (EMA200 on the weekly chart) be considered. Below the level of 0.7065, short positions are relevant with targets at support levels of 0.6975 (November lows), 0.6900, 0.6870. Support levels: 0.7015, 0.6975, 0.6940, 0.6900, 0.6870 Resistance levels: 0.7065, 0.7085, 0.7200, 0.7235, 0.7310, 0.7375 Trading recommendations Sell in the market. Stop-Loss 0.7055. Take-Profit 0.7015, 0.6975, 0.6940, 0.6900, 0.6870 Buy Stop 0.7055. Stop-Loss 0.7025. Take-Profit 0.7065, 0.7085, 0.7200, 0.7235 
|
|
#2
16-05-2017, 10:21
|
||||
|
||||
|
S&P500: US indices rise against the backdrop of rising commodity prices
16/05/2017 Current dynamics The recovery of prices for oil and other commodities supports US stock indices. The increase in prices for iron ore and base metals supported the shares of companies in the mining sector. In the oil market, positive dynamics has also been prevailing over the last week. After last Wednesday the Ministry of Energy of the United States presented data that showed a significant drop in oil and petroleum products in the United States, oil prices have appreciated by 8.5% by today. At the same time, investors do not lose hope for an extension of the agreement on the reduction of oil production in the framework of OPEC. So, recently the Saudi oil Minister Khaled Al-Falikh and the Russian energy Minister Alexander Novak expressed support for the extension of the agreement on the reduction of production for another 9 months. The next OPEC meeting will be held on May 25. As a result, against the background of positive expectations on the oil market, WTI futures for NYMEX closed on Monday with an increase of $ 1.01 (or 2.1%) at $ 48.85 per barrel. The sub-index of the oil and gas sector in the S&P500 grew by 0.6%, which gave a positive momentum to the entire S&P500 index. As a result of yesterday's trading day, the S&P500 grew by 0.5%, Nasdaq Composite - by 0.5%, Dow Jones Industrial Average - by 0.4%. From the US continue to receive positive macroeconomic data. Despite some deviation from the forecasted values in the smaller direction, in general, the indicators of inflation and the labor market of the USA point to the growth of the economy in the country. As long as the economy is growing, investors will prefer stocks and other asset-safe havens and other risky instruments. Nevertheless, investors still believe that the Fed will raise interest rates in June. According to CME Group, the probability of a rate hike next month is estimated at 74% (last week the probability was at 83%). The likelihood of an early increase in the interest rate is holding back from more active purchases on the US stock market, which, nevertheless, is dominated by a positive trend. From the news for today we are waiting for the data from the USA. At 12:30 (GMT), a report on the dynamics of new permits for the construction of houses in the US for April, which is an important indicator of the housing market, will be presented. The higher the value, the more positive the effect is on the stock indices. Forecast: 1.27 million new permits (against 1.26 million permits last month). If the data prove to be better than the forecast, then the US indices will grow. At 13:15 (GMT) the report of the Board of Governors of the US Federal Reserve on the volume of industrial production and use of production capacities for April is published. A high result may indicate the existence of inflationary expectations and, consequently, a rapid rate increase, so a high figure strengthens the US dollar. But at the same time, strong macro data contribute to the growth of investor confidence in the stability and growth of the US economy. And this is a positive fundamental factor for the US stock market. In general, the positive background for stock indices remains. Support and resistance levels Since the opening of today's trading day, the S & P500 index has slightly decreased. Nevertheless, the positive dynamics of the S & P500 index remains. Since February 2016, the S & P500 index has been steadily growing and is in the ascending channels on the daily and weekly charts. At the moment, the S & P500 again tests the resistance level of 2400.0, reached in early March, for breakdown. Indicators OsMA and Stochastics on the daily, weekly, monthly charts went to the side of buyers. In case of resumption of growth, the nearest target will be level 2412.0 (the upper limit of the ascending channel on the daily chart). The reverse scenario will be related to the breakdown of the short-term support level 2392.0 (EMA200 on the 1-hour chart) and the decrease with the nearest targets near the levels 2360.0 (the bottom line of the uplink on the daily chart), 2326.0 (April lows). The breakdown of support levels of 2275.0 (EMA200 on the daily chart), 2265.0 (Fibonacci level of 23.6% correction to growth since February 2016) will cancel the bullish trend of the index. Support levels: 2392.0, 2375.0, 2360.0, 2326.0, 2275.0, 2265.0 Resistance levels: 2400.0, 2412.0 Trading Scenarios Sell Stop 2390.0. Stop-Loss 2405.0. Objectives 2375.0, 2360.0, 2326.0, 2275.0, 2265.0 Buy Stop 2405.0. Stop-Loss 2390.0. Objectives 2412.0, 2420.0   *) Actual and detailed analytics can be found on the Tifia website at tifia.com/analytics
|
|
#3
17-05-2017, 10:48
|
||||
|
||||
|
Brent: Middle of the range and key level 51.70
17/05/2017 Current dynamics Interrupted by a series of non-stop 4-day growth, the price for Brent crude oil finished yesterday's trading day with a decrease of 1% or $ 0.6 per barrel. Published at the end of yesterday's trading day, data from the American Petroleum Institute (API) was the final chord of yesterday's decline in the price of oil. According to the API, oil reserves in the US increased by 882,000 barrels in the week of May 6-12. The presented data again revived fears of investors that the growth of oil production in the US is negating the efforts of the Organization of the Petroleum Exporting Countries (OPEC) to restore the balance in the market. Oil prices in different directions are pulling information on the growth of oil reserves and production outside the cartel and the expectation that OPEC and countries outside the cartel are supporting the extension of the deal to cut production. On Monday, it was reported that Saudi Arabia and Russia expressed a propensity to extend the agreement to reduce production for another 9 months. The OPEC meeting on this issue will be held next week (May 25). The skepticism about the efficiency of the OPEC deal returned to the oil market after the International Energy Agency (IEA) published data on Tuesday that according to which in the 1st quarter commercial oil reserves in developed countries increased by 24.1 million barrels. IEA data also indicate the growth of stocks in oil storage facilities and in April. According to analysts of the oil market, OPEC will be able to achieve the goal, and world oil reserves in the storage facilities will drop to an average of 5-year level provided that in the next year the supply of oil is reduced by 1 million barrels per day. Some of the economists are of the opinion that the OPEC reduction deal should be extended for 2018 as well. The increase in the number of drilling rigs and the increase in production in the United States go faster and larger than expected, offsetting the efforts of OPEC. This could lead to the fact that production in the US will continue to grow, and support from OPEC in 2018 will end. In this case, the risks of a sharp drop in oil prices rise significantly against the backdrop of a growing surplus of oil supply. Today at 14:30 (GMT) will be a report from the US Department of Energy on the change in oil and petroleum products in the US over the past week. It is expected that oil and petroleum products in the US fell by another 2.283 million barrels (after a recent weekly reduction of 5.247 million barrels). When confirming the forecast, the price of oil should rise. Closer to the end of the US trading session (18:00 GMT) on Friday a report will be published from the American oil service company Baker Hughes on the number of active drilling rigs in the US. It is expected that the number of active oil drilling rigs in the United States has again increased (in the previous week their number was 712 units). The next growth will negatively affect oil prices. Support and resistance levels After a sharp decline at the beginning of the month to 47.00, the price of Brent crude oil was able to significantly adjust to today's expectations on the expectation that OPEC will be able to agree on an extension of the agreement to reduce oil production. Today, Brent crude trades near the key resistance level at 51.70 (EMA200 on the daily chart). This level is also a kind of middle line of the range formed between the levels 52.35 (EMA144, EMA50 on the daily chart) and 50.70 (the Fibonacci retracement level of 61.8% correction to the decline from the level of 65.30 from June 2015 to the absolute minimums of 2016 near the 27.00 mark). The price for Brent crude oil remains within the descending channel on the daily chart, the lower limit of which is near the support level of 46.20 (50% Fibonacci level). If the support level breaks through 50.70, the price will go down to levels 48.35, 47.10, 46.20. In the case of consolidation below 46.20 (50% Fibonacci level), the upward trend in the price of Brent crude oil will be canceled. An alternative scenario for growth is associated with a return of the price above the level of 52.35. Long-term goals in the case of this scenario are near 55.60 (EMA200 on the weekly chart), 56.70 (April highs), 57.50, 58.40 (highs of the year). Support levels: 50.70, 48.35, 47.00, 46.20 Resistance levels: 51.70, 52.35 Trading Scenarios Sell Stop 51.25. Stop-Loss 51.85. Take-Profit 50.70, 50.00, 48.35, 48.00, 47.10, 46.20 Buy Stop 51.85. Stop-Loss 51.25. Take-Profit 52.35, 54.00, 55.00, 55.60, 56.70, 57.00, 57.50   *) Actual and detailed analytics can be found on the Tifia website at tifia.com/analytics
|
|
#4
18-05-2017, 10:38
|
||||
|
||||
|
EUR/USD: short-term downward correction is likely
18/05/2017 Current dynamics Aggravated in the US political uncertainty caused sales in global stock markets, especially American ones. Investors once again fear that the Trump administration will face difficulties in carrying out tax reform and budget incentives. The dollar fell sharply in the foreign exchange market. The ICE dollar index, estimating its rate to the basket of six major currencies, fell by 0.4% to 97,685, being near the minimum mark since November 4. Yesterday was also associated with an increase in demand for asylum assets, such as the yen, gold, US government bonds. So, the yield of 10-year US Treasury bonds, according to Tradeweb, fell yesterday to 2.247% from 2.329%. We are waiting for the data from the USA today. At 12:30 (GMT), the US Department of Labor will publish a weekly report on the number of new applications for unemployment benefits. The forecast: 240 000 (against 236 000 the previous week), which should negatively affect the dollar. Also at the same time published an index of business activity in the manufacturing sector from the Federal Reserve Bank of Philadelphia in May. The result is higher than expected (19.5 against 22.0 in April) will strengthen the US dollar. Support and resistance levels Despite today's decline, the positive dynamics of the pair EUR / USD persists. On a strong positive momentum, the EUR / USD pair broke the upper border of the rising channel on the daily chart near 1.1100. In case of resumption of growth and renewal of the local and annual maximum near the 1.1170 level, the targets will be levels 1.1280 (Fibonacci level 23.8% corrective growth from the minimums reached in February 2015 in the last wave of global decline of the pair from the level of 1.3900), 1.1340 (EMA144 on a weekly basis Chart). In case the EUR / USD pair returns to the zone below the support level 1.1100 (the upper line of the rising channel on the daily chart), the fall in the EUR / USD pair may accelerate into the channel. Strong levels of support are also levels 1.1035, 1.1000, 1.0950. Breakdown of support levels 1.0820 (EMA200), 1.0780 (EMA144 on the daily chart) will cancel the uptrend. Support levels: 1.1100, 1.1080, 1.1035, 1.1000, 1.0950, 1.0900, 1.0875, 1.0820, 1.0800, 1.0780 Resistance levels: 1.1156, 1.1170, 1.1200, 1.1280, 1.1340 Trading Scenarios Sell Stop 1.1115. Stop-Loss 1.1175. Objectives 1.1100, 1.1080, 1.1035, 1.1000, 1.0950, 1.0900, 1.0875, 1.0820, 1.0800, 1.0780 Buy Stop 1.1175. Stop-Loss 1.1115. Objectives 1.1200, 1.1280. 1.1340  *) Actual and detailed analytics can be found on the Tifia website at tifia.com/analytics
|
|
#5
19-05-2017, 10:52
|
||||
|
||||
|
DJIA: American stock market rebounds
19/05/2017 Current dynamics World and, above all, American stock markets are recovering after a serious fall two days ago. The fall of the dollar and US stock indices on Wednesday was caused by reports in the media that Trump allegedly asked former FBI director James Komi, who was dismissed from his post a few days earlier, to stop the investigation against Michael Flynn, who previously held the position of adviser President for national security. The news came after reports that Trump handed classified information to Russian authorities, which could harm the US national security. Against this background, talk of possible impeachment of Trump increased. Nevertheless, since yesterday, there has been a recovery of the dollar and US indices. Yesterday, US Treasury Secretary Stephen Mnuchin and the president of the Federal Reserve Bank of Cleveland, Loretta Mester, hastened to reassure investors. Stephen Mnuchin said that "President Trump is determined to carry out the tax reform as quickly as possible". Loretta Mester, who is also a member of the FOMC of the Fed, gave a positive assessment to the US economy and said that the central bank will continue to raise interest rates to "avoid increasing risks to macroeconomic stability that may arise if the economy overheats". The dollar and US indices received yesterday also support from published data on the number of applications for unemployment benefits in the US, which declined for the third consecutive week, indicating a steady increase in the number of jobs. The index of business activity for May, published by the Fed-Philadelphia, significantly exceeded the expectations of economists, which also gave confidence to investors (38.8 against the forecast of 19.5 and 22.0 in April). Today, the economic calendar for the United States is empty; however, it is worth paying attention to the speech of FOMC member and head of the Federal Reserve Bank of St. Louis James Bullard (starts at 13:15 GMT). It is likely that Bullard, also following Mester, will point to a high probability of an early interest rate increase in the United States. The next meeting of the Federal Reserve on this issue will be held on June 13-14, and many investors are already laying a price hike on prices in this meeting. According to the CME Group, the probability of an increase in rates next month is again estimated at 74%. On the one hand, the probability of an early increase in the interest rate is holding back from more active purchases on the American stock market, raising the rate makes the dollar more expensive. On the other hand, as the head of the Federal Reserve, Janet Yellen, pointed out more often, the rate increase speaks about the strength of the American economy, and this is a positive factor for the dollar and the US stock market, which, nevertheless, is dominated by positive dynamics. Support and resistance levels As a result of the recent fall, the DJIA index has lost all the achievements of recent weeks, falling below the opening level of the previous month near the mark 20650.0. The DJIA index broke through the support level of 20620.0 (the bottom line of the ascending channel on the daily chart), falling to the level of 20500.0. With the opening of today's trading day and the beginning of the European session, the DJIA index continues to recover, once again returning to the upward channel on the daily chart, the upper limit of which passes above the level of 21170.0 (absolute and annual highs). To confirm the upward dynamics, the DJIA index needs to gain a foothold above the level 20825.0 (EMA200 on the 4-hour and 1-hour charts). The indicators OsMA and Stochastics on the 1-hour and 4-hour charts turned to long positions. Positive dynamics of the index can fully recover already above the level of 20820.0. Long positions can be opened already in the zone above the resistance level 20750.0 (EMA50 on the daily chart). In an alternative scenario, the index should drop below the local and May low near the 20500.0 mark If the downward trend is to increase, the decline in the index may continue to support levels of 20360.0 (April lows), 19990.0 (December highs), 19850.0 (EMA200 on the daily chart and Fibonacci level of 23.6% correction to the wave growth from the level of 15660.0 after recovery In February of this year to the collapse of the markets since the beginning of the year. The maximum of this wave and the Fibonacci level of 0% is near the mark of 21170.0). The change in the bullish trend for the bearish will occur only after the DJIA index falls below the level of 19850.0. So far, the bullish trend prevails. Support levels: 20620.0. 20500.0, 20360.0, 20110.0, 19990.0, 19850.0 Resistance levels: 20750.0, 20820.0, 20885.0, 20980.0, 21170.0 Trading Scenarios Buy in the market. Stop-Loss 20610.0. Take-Profit 20750.0, 20820.0, 20885.0, 20980.0, 21170.0 Sell Stop 20610.0. Stop-Loss 20760.0. Take-Profit 20500.0, 20360.0, 20110.0, 19990.0, 19850.0  *) Actual and detailed analytics can be found on the Tifia website at tifia.com/analytics
|
|
#6
22-05-2017, 10:25
|
||||
|
||||
|
Brent: Investors' optimism is growing
22/05/2017 Current dynamics The previous week, oil prices continued to rise. Optimism of investors was caused by media reports that Saudi Arabia and Russia are in favor of a 9-month extension of the agreement. Other OPEC member countries support the extension of the deal to reduce production for 9 months, said Saudi Arabia's oil minister Khaled Al-Falih. According to Al-Falih, the extension of the deal until March 2018 will allow OPEC to achieve its goal and reduce world reserves to an average of 5-year level, and restore the balance in the oil market. As is known, at the end of last year, 13 OPEC countries and 11 countries outside the cartel agreed on a total reduction of oil production by almost 1.8 million barrels a day until June. However, this was not enough to restore the balance of supply and demand in the oil market. Other major oil-producing countries, such as the United States and Canada, have been actively increasing production, while the countries participating in the agreement have reduced production. Last week, the International Energy Agency (IEA) published data according to which in the 1st quarter commercial oil reserves in developed countries increased by 24.1 million barrels. IEA data also indicate the growth of stocks in oil storage facilities and in April. The US continues to increase oil production, which largely neutralizes the efforts of OPEC. So, according to the data provided by American oil service company Baker Hughes on Friday, the number of active oil drilling rigs in the United States again rose to 720 units in the previous week. Some economists doubt that the OPEC deal will have the desired effect on the supply surplus. The increase in the number of drilling rigs and the increase in production in the United States go faster and larger than expected. This could lead to the fact that production in the US will continue to grow, and support from OPEC in 2018 will end. In this case, the risks of a sharp drop in oil prices rise significantly against the backdrop of a growing surplus of oil supply. Nevertheless, the oil market is on the rise. The next OPEC meeting will be held on May 25 in Vienna, and much in the future dynamics of oil prices will depend on the decisions taken at this meeting. If it is indeed decided to extend the agreement for another 9 months, and also expressed the intention to continue to actively influence the balance of the oil market in the direction of reducing the level of oil supply, then oil prices will be a powerful incentive for further growth. Support and resistance levels The previous week the price for Brent crude oil has significantly strengthened. The growth was almost 6%. The price has added 3 dollars per barrel, having risen to the level of 53.86 dollars. Today's trading day began for oil with a small gap in price. However, in the future the momentum faded and the price for Brent crude at the beginning of the European session is close to the level of 54.00 (today's opening price). Given that today the dollar is strengthening in the foreign exchange market, partially restoring its positions after a strong fall last week, it is also likely to reduce oil prices. Indicators OsMA and Stochastics on the 1-hour and 4-hour charts went to the side of sellers, signaling an overdue downward correction. The price is on the upper border of the descending channel on the daily chart (level 54.00). Withdrawal from this level will create prerequisites for further price reduction inside the channel to support levels of 52.35 (EMA144, EMA50 on the daily chart), 52.05, 51.70 (EMA200 on the daily chart). A stronger correction is possible to support level 50.70 (Fibonacci level 61.8% correction to decrease from 65.30 from June 2015 to absolute minimums of 2016 near the 27.00 mark). If the support level breaks through 50.70, the price will go down to levels 48.35, 47.10, 46.20. In case of consolidation below level 46.20 (the Fibonacci level of 50% and the lower border of the descending channel on the daily chart), the upward trend in the price of Brent crude oil will be canceled. The scenario for price growth is connected with the breakdown of the level of 54.00 and further strengthening to the levels of 55.60 (EMA200 on the weekly chart), 56.70 (April highs), 57.50, 58.40 (highs of the year). On the daily and weekly charts, the OsMA and Stochastic indicators recommend long positions, and the price on the weekly chart is in the middle of the rising channel, the upper limit of which runs near the level of 62.00. Support levels: 53.00, 52.35, 52.05, 51.70, 51.40, 50.70, 48.35, 47.00, 46.20 Resistance levels: 54.00, 55.60, 56.70, 57.50 Trading scenarios Sell Stop 53.80. Stop-Loss 54.30. Take-Profit 53.00, 52.35, 52.05, 51.70, 51.40, 50.70 Buy Stop 54.30. Stop-Loss 53.80. Take-Profit 55.00, 55.60, 56.70, 57.00, 57.50   *) Actual and detailed analytics can be found on the Tifia website at tifia.com/analytics
|
|
#7
23-05-2017, 10:37
|
||||
|
||||
|
NZD/USD: commodity prices rose
23/05/2017 Current dynamics Against the background of the weakening of the US dollar and the rise in commodity prices, the NZD / USD pair has significantly increased over the past 1.5 weeks. Despite the growth of expectations of an increase in the interest rate in the US, the US dollar demonstrates a large-scale decline in the foreign exchange market. According to the CME Group, investors are expecting an increase in the Fed's key rate at a meeting scheduled for June 13-14 at 78.5% against 59% in mid-April. The probability of an increase in the rate in July is 80.0%, in September 86%. Nevertheless, the US dollar is losing all acquisitions since November 8, when the new US president was elected. The index of the dollar WSJ, reflecting the value of the US dollar against 16 other currencies, decreased by 0.1% to 88.60. The NZD / USD pair also rose on the eve of the publication of forecasts for milk powder prices for the New Zealand company Fonterra, the largest dairy producer in the country. As you know, milk powder is the main export item of New Zealand. It is expected that the forecast of Fonterra for milk powder prices will rise to 6.75 US dollars per kilogram. In addition, on Thursday (02:00 GMT), the budget of the New Zealand government is published for the fiscal year 2017-2018. It is expected that the budget will show a moderate surplus and reflect the good state of the national economy. The growth of the budget surplus and the New Zealand economy leads to an increase in expectations about the increase in the key interest rate of the central bank of New Zealand, which will positively affect the New Zealand dollar. Nevertheless, the RBNZ stated that it will keep its stake on the same level due to the uncertainty surrounding the US economic and foreign trade policy up to Q3 2018. If the Fed starts a gradual increase in the rate in the US, then the hours of the balance will be steadily and gradually tilt in favor of the US dollar. The difference between the monetary policies of RBNZ and the Fed will remain the main fundamental factor in favor of the US dollar in the next few months. From the news for today, we are waiting for data from the US, which are published between 12:55 and 14:00 (GMT). Business activity indices (PMI) in the US manufacturing and service sectors for May (preliminary release) should show a slight increase (53.0 and 53.1, respectively). Also today, comments Fed representatives - Neil Kashkari and FOMC member Patrick Harker, at 13:00, 19:00 and 21:00, respectively. At 22:45 (GMT), the main articles of New Zealand's foreign trade balance for April will be published, which is expected with a decrease in surplus (NZ $ 268 million versus NZ $ 332 million in the previous month). In this case, the New Zealand dollar may decline. Tomorrow, the attention of traders will be focused on the publication (18:00 GMT) of the protocol from the last meeting of the committee on open market operations of the Fed ("FOMC minutes"), which may contain indications of the future of US monetary policy. Volatility, as always, is expected at this time high for all dollar pairs. Technical analysis As a result of growth during the last three trading sessions, the NZD / USD pair came close to the resistance level 0.7030 (EMA200, EMA144 on the daily chart, the upper limit of the descending channel on the weekly chart). A little below this level, near the mark of 0.7000, the upper limit of the descending channel passes on the daily chart. It's not easy to pass this level to NZD / USD pair. Only in case of fastening above the resistance level 0.7070 (EMA200 on the monthly chart) can consideration of long medium-term positions in the NZD / USD pair. The most likely rebound from the current level of 0.7030. As the political tension in the US decreases, the US dollar will begin to recover in the foreign exchange market. In this case, the high probability of a rapid increase in the interest rate in the United States will again come to the fore, and this is a strong fundamental factor in favor of the US dollar. The return of the pair NZD / USD under the support level 0.6945 (EMA200 on the 4-hour chart, March, April highs) will return the downward dynamics to the pair NZD / USD. The targets will be the levels of 0.6885 (March lows), 0.6860 (the Fibonacci level of 23.6% of the upward correction to the global wave of decline of the pair from the level of 0.8800, which began in July 2014, the low of December 2016), 0.6818 (May minima and the bottom line of the downward channel on Day chart). In case of breakdown of the support level of 0.6818, the global downtrend of the NZD / USD pair, which began in July 2014, will resume. The minima of the wave of this trend are close to the level of 0.6260, which were reached in September 2015, and from which the current upward correction began. Support levels: 0.7000, 0.6945, 0.6900, 0.6885, 0.6860, 0.6818, 0.6800, 0.6680 Resistance levels: 0.7030, 0.7070  *) Actual and detailed analytics can be found on the Tifia website at tifia.com/analytics
|
|
#8
24-05-2017, 10:30
|
||||
|
||||
|
S&P500: US indices recovered after falling
24/05/2017 Current dynamics The US stock markets recovered completely after a sharp fall in the middle of last week, which arose amid growing political tensions in the US, which could become an obstacle to the implementation of President Donald Trump's program. However, strong corporate reports and positive fundamental macroeconomic indicators of the US helped keep the stock indices from a deeper fall. An additional positive factor for the US stock markets was yesterday the decline in political confrontation in the US after US President Donald Trump presented the draft budget for 4.1 trillion dollars. According to the budget, which provides for major changes in the social security system, the amount of US government spending in the next 10 years will be reduced by 4.5 trillion dollars. Tax cuts will also help increase economic growth. All together will help to cover the budget deficit, as it is supposed, for 10 years. Yesterday's hearings in the US Congress, which did not reveal the links of President Donald Trump's campaign headquarters with Russia, also contributed to a reduction in domestic political tension in the United States. The growth of shares of financial companies and oil and gas companies contributed to the increase in US stock indices for the fourth consecutive session. The Dow Jones Industrial Average rose 0.2% to 20937.00 points yesterday, the S & P500 rose 0.2% to 2398.00 points, Nasdaq Composite - by 0.1% to 6138.00 points. Today investors are waiting for the release of the minutes of the May meeting of the Fed (18:00 GMT), which will look for hints on the timing of the next rate hikes and on plans to reduce the balance of 4.5 trillion dollars. As the head of the Fed-Philadelphia Patrick Harker said yesterday, "raising rates in June is quite possible". He considers it appropriate to raise interest rates this year two more times. In itself, an increase in the interest rate will not be able to break the bullish trend of the US stock market, despite the fact that the dollar will receive strong support. As the head of the Federal Reserve, Janet Yellen, stated more than once, "a rate hike speaks about the strength of the American economy". From the US continue to receive positive macroeconomic data. Despite some deviation from the forecasted values in the smaller direction, in general, the indicators of inflation and the labor market of the USA point to the growth of the economy in the country. As long as the economy is growing, investors will prefer stocks and other asset-seekers shares and other high-risk risky instruments. In general, the positive background for the main US stock indices remains. Support and resistance levels As a result of the four-day growth, the S & P500 index fully recovered losses suffered earlier amid renewed hype around the US president. With the opening of today's trading day, the S & P500 index is trading in a narrow range, pending the publication of the minutes from the May meeting of the Fed. The positive dynamics of the S & P500 index is preserved. Since February 2016, the S & P500 index has been growing steadily and is in the ascending channels on the daily and weekly charts. At the moment, the S & P500 again tests the resistance level of 2400.0, reached in early March, for breakdown. The indicators OsMA and Stochastics on the daily chart again turned to long positions. In case of resumption of growth, the nearest target will be level 2415.0 (the upper limit of the uplink on the daily chart). The reverse scenario will be associated with breakdown of the short-term support level 2386.0 (EMA200 on the 1-hour chart) and a decrease with the nearest targets near the levels 2355.0 (bottom line of the uplink on the daily chart), 2326.0 (April lows). Only the breakdown of support levels of 2275.0 (EMA200 on the daily chart), 2265.0 (Fibonacci level of 23.6% correction to growth since February 2016) will cancel the bullish trend of the index. Support levels: 2386.0, 2375.0, 2355.0, 2326.0, 2305.0, 2275.0, 2265.0 Resistance levels: 2400.0, 2415.0 Trading Scenarios Sell Stop 2385.0. Stop-Loss 2405.0. Objectives 2375.0, 2355.0, 2326.0, 2275.0, 2265.0 Buy Stop 2405.0. Stop-Loss 2385.0. Objectives 2415.0, 2450.0, 2500.00   *) Actual and detailed analytics can be found on the Tifia website at tifia.com/analytics
|
|
#9
25-05-2017, 10:30
|
||||
|
||||
|
Brent: in the focus of OPEC
25/05/2017 Current dynamics As the Minister of Oil of Saudi Arabia, OPEC and countries outside the cartel stated in Vienna today, they will probably leave the amount of reduction unchanged under the 9-month extension of the deal. According to the minister, if necessary, OPEC may increase the volume of production reduction, but so far it is not necessary. After the Saudi oil minister's speech, oil prices fell sharply. Meanwhile, the increase in oil production in the US and other major oil-producing countries, largely offset the efforts of OPE to limit oil production. After the entry into force of the OPEC agreement, other countries as a whole reduced production by about 1.8 million barrels a day. During the same time, the US increased production by 750,000 barrels per day to 9.3 million barrels a day, the maximum since the summer of 2015. In fact, by the efforts of the US alone, more than a third of the reduced production was offset. And this, apart other countries, such as Brazil, Libya, Canada. In the US there is an active increase in oil production. So, according to the data provided by American oil service company Baker Hughes on Friday, the number of active oil drilling rigs in the United States again rose to 720 units in the previous week. The number of drilling in the US has been steadily increasing since the summer of last year. American investment companies continue to invest in shale companies. At the same time, American drilling companies have developed a number of financial protection tools that insure against losses in the event of a fall in prices. Innovations in the oil industry of the US economy make it possible to achieve all the best results in oil production. The increase in efficiency makes it possible to reduce the cost of production to less than $ 40 per barrel against $ 63 in 2014. There are all prerequisites to the fact that the volume of supply of oil in the US will increasingly increase, further reducing the effect of the agreement within OPEC. If, at the OPEC meeting, it is announced that it is possible to expand the volume of cuts and further extend after the expiration of the next 9-month period, the price of oil will be a powerful stimulus for growth. In general, the extension of the deal to reduce production in the same volumes was expected by market participants, and it is mostly already taken into account in prices. It is possible that after a small increase in oil prices will return to a downward trend. Support and resistance levels The price of Brent crude oil could not gain a foothold above the level of resistance at 54.30 (the upper limit of the descending channel on the daily chart) and in the course of today's European session is declining. Indicators OsMA and Stochastics on the 1-hour and 4-hour charts went to the side of sellers. On the daily chart, indicators also unfold to short positions. After the speech of Saudi Arabia's oil minister, the price dropped sharply, reaching a short-term support level of 53.00 (EMA200 on the 1-hour chart). If the price roll is repeated downward, and support levels of 53.00, 52.50 (EMA200 on the 4-hour chart, EMA144 on the daily chart) will be broken, it is likely that the price will decline further to support level 51.90 (EMA200 on the daily chart). In the event of a breakthrough in the support level of 50.70 (the Fibonacci level of 61.8% of the correction to the decline from the level of 65.30 from June 2015 to the absolute minimums of 2016 near the 27.00 mark) the price will go deeper into the descending channel on the daily chart and to levels 48.35, 47.10, 46.20. In case of consolidation below level 46.20 (the Fibonacci level of 50% and the lower border of the descending channel on the daily chart), the upward trend in the price of Brent crude oil will be canceled. The scenario for strengthening the price is connected with the breakdown of the local resistance level at 54.30 and further growth in the uplink channel on the weekly chart, the upper limit of which passes near the level of 62.00. Support levels: 53.00, 52.35, 52.05, 51.70, 51.40, 50.70, 48.35, 47.00, 46.20 Resistance levels: 54.00, 55.60, 56.70, 57.50 Trading Scenarios Sell Stop 53.80. Stop-Loss 54.30. Take-Profit 53.00, 52.35, 52.05, 51.70, 51.40, 50.70 Buy Stop 54.30. Stop-Loss 53.80. Take-Profit 55.00, 55.60, 56.70, 57.00, 57.50   *) Actual and detailed analytics can be found on the Tifia website at tifia.com/analytics
|
|
#10
26-05-2017, 11:05
|
||||
|
||||
|
GBP/USD: pound is under pressure
26/05/2017 Current dynamics Several fundamental factors that occurred this week contributed to the pound's weakening in the foreign exchange market. According to polls conducted on the eve of June 8, when early parliamentary elections will be held in Great Britain, the support of the ruling Conservative Party, led by Prime Minister Teresa May, declined. In the middle of last month Teresa May unexpectedly announced early parliamentary elections. The purpose of these elections is to ensure the dominant position of the Conservative Party in the parliament on the eve of the June elections, in order to agree with the EU on more favorable conditions for Brexit. If the Conservative Party has more seats in the parliament, this will neutralize the influence of the supporters of the tough scenario Brexit. However, among investors, there is growing doubt about the development of this scenario. Another negative factor for the pound was the terrorist attacks in Britain, where explosions during the concert were blown up this week at the stadium in Manchester. Theresa May raised the level of the terrorist threat to a critical one. From the side of the macro data, a portion of the negative also arrived. According to the data published yesterday, UK GDP growth for the first quarter was revised downward (+ 0.2% instead of 0.3%, + 2.0% instead of + 2.1% in annual terms, as reported in the first GDP estimate). Thus, the pound was among the leaders of the fall this week. The GBP / USD pair seems to be closing this week with a decline of almost 1.0% or about 130 points. From the news for today, we are waiting for data on the United States. At 12:30 (GMT) important macroeconomic indicators will be published: the adjusted value of the GDP index for the first quarter, orders for durable goods for April. If the value of GDP (the second estimate) is revised upward, the dollar will strengthen in the foreign exchange market, including in the GBP / USD pair. This will be another argument in favor of raising the interest rate in the US at a meeting of the Fed on June 13-14. Conversely, if the indicators come out weaker than expected, this will lead to a decrease in the dollar. Today is Friday, the end of the last full trading week of the month. At the end of the US trading session, it is possible to fix short positions on the dollar, which can cause the dollar to rise and decline against it other major currencies, including the pound. Support and resistance levels The pair GBP / USD broke through the short-term support level of 1.2950 (EMA200 on the 1-hour chart) and falls to support level 1.2840 (EMA200 on the 4-hour chart). A little lower, at 1.2800 there is another strong support level of 1.2800 (EMA200 on the daily chart). In the case of an increase in negative dynamics and breakdown of support levels of 1.2700 (bottom line of the upward channel on the daily chart), 1.2680 (EMA144 on the daily chart), the upward trend of the pair, which began in January 2017, could grow into a downtrend. Indicators OsMA and Stochastics on the 4-hour and daily charts went to the side of sellers. On the weekly chart, the indicators also unfold to short positions. You can return to consideration of long positions for the GBP / USD pair after its return to the zone above the level of 1.2950. In case of breakdown of the local maximum near the 1.3050 mark, the GBP / USD pair growth will resume within the upward channel on the daily chart. The closest target will then be the level of 1.3210 (Fibonacci level of 23.6% correction to the decline in the GBP / USD pair in the wave, which began in July 2014 near the level of 1.7200). Support levels: 1.2790, 1.2680, 1.2590, 1.2485, 1.2340, 1.2110 Resistance levels: 1.2990, 1.3000, 1.3100, 1.3210 Trading Scenarios Sell in the market. Stop-Loss 1.2955. Take-Profit 1.2840, 1.2800, 1.2680, 1.2590, 1.2485, 1.2340 Buy Stop 1.2955. Stop-Loss 1.2890. Take-Profit 1.2990, 1.3050, 1.3100, 1.3210   *) Actual and detailed analytics can be found on the Tifia website at tifia.com/analytics
|
|
#11
29-05-2017, 10:08
|
||||
|
||||
|
GBP/NZD: at a strong support level
29/05/2017 Current dynamics Last week, the US dollar strengthened strongly against the pound and about the same weakened against the New Zealand dollar (+ 1.8% and -1.9%, respectively). The reason for this behavior of the dollar against the pound was associated with a massive decline in the pound in the foreign exchange market after the weak macro data on the UK came out and it became known that the gap between the Labor Party and the Conservative parties had significantly reduced before the elections to the country's parliament. New Zealand's same currency strengthened after last week the New Zealand government has submitted a budget for 2017-2018. According to this document, a budget surplus is expected, strong GDP growth and tax cuts. The budget indicates that the Reserve Bank of New Zealand may soon begin to consider raising the interest rate in the country, which is currently one of the highest among the advanced economies (1.75%). The New Zealand dollar became the leader of growth last week. Proceeding from the above, the fall of the pound against the New Zealand dollar is especially strong. Today in the UK is a bank holiday. Important economic news in the calendar is also not contained. Arguments for the growth of the NZD / USD pair: The GBP / NZD pair has reached an important support level of 1.8190 (200-period moving average on the daily chart). Even if there is a breakdown of this level and further reduction of the NZD / USD pair, before the further decline, a rebound from the level of support and corrective growth is possible. The GBP/NZD has been in an uptrend since the beginning of the year. After a strong multidirectional movement last week against the US dollar, some correction is expected this week in NZD / USD, GBP / USD pairs. Tomorrow (20:00 GMT) RBNZ will publish a semi-annual report on financial stability. If the report contains information about the difficulties and problems of the effectiveness of the financial system of New Zealand, the New Zealand currency after strong growth last week could significantly adjust, including in the pair GBP / NZD. Support and resistance levels The pair GBP / NZD broke through the short-term support level 1.8460 (EMA200 on 1-hour and 4-hour charts) and fell to the key support level 1.8190 (EMA200 on the daily chart). Near the level of 1.8460 also passes the bottom line of the rising channel on the daily chart. Despite the fact that OsMA and Stochastic indicators on the daily and weekly charts recommend sales, on short-term periods (1-hour and 4-hour) the indicators turned to long positions, signaling an upward correction. If the NZD / USD pair returns to a zone above 1.8460, its further growth may resume. The closest target will be the recent May highs near the level of 1.8490. More distant targets will be the levels of 1.9300, near which there is an upper bound of the rising channel on the daily chart, 1.9750 (EMA200 on the weekly chart). The key date in the further dynamics of the GBP / NZD pair will be June 8, when extraordinary elections to the British Parliament will be held. If the Conservatives win at the head of Prime Minister Theresa May, the pound may sharply strengthen in the currency market, including in the GBP / NZD pair. The reverse scenario will be connected with the breakdown of the support level 1.8050 (EMA144 on the daily chart) and further decrease towards annual lows near the level of 1.6850. Support levels: 1.8050, 1.7800, 1.7500, 1.7200, 1.6850 Resistance levels: 1.8460, 1.8940, 1.9300, 1.9750 Trading Scenarios Sell Stop 1.8130. Stop-Loss 1.8210. Take-Profit 1.8050, 1.7800, 1.7500, 1.7200, 1.6850 Buy Stop 1.8210. Stop-Loss 1.8130. Take-Profit 1.8460, 1.8940, 1.9300, 1.9750   *) Actual and detailed analytics can be found on the Tifia website at tifia.com/analytics
|
|
#12
30-05-2017, 10:30
|
||||
|
||||
|
AUD/USD: attention to retail sales data
30/05/2017 Current dynamics The Australian dollar has recently remained one of the weakest against the US dollar. Despite the fact that earlier in the month the RBA retained the interest rate in Australia at 1.5%, among market participants the opinion is growing that the RBA can go on reducing the interest rate in the country due to a record household debt, a record low salary growth and a weak market Labor. Domestic consumption makes a big contribution to GDP growth. In view of the weak growth in consumption in Australia, some economists forecast zero or insignificant GDP growth for the first quarter. From the protocol published at the beginning of the month since the last meeting of the RBA, it follows that the bank as a whole is still optimistic about the situation in the Australian economy. However, according to the bank, "an increase in the interest rate will complicate the correction of the economy." On Thursday, important macro data for Australia will be published, including retail sales for April and companies' investments for the first quarter. A slight, almost zero growth in the level of retail sales is expected in April (+ 0.3%). Another weak data on sales will strengthen the opinion of market participants that the interest rate in Australia will soon be lowered. The RBA's restrained position on the rate in Australia and, conversely, the Fed's positive view on the process of raising the interest rate in the US strengthen the position of sellers of the Australian dollar against the US dollar. The negative medium-term dynamics of the AUD / USD pair remains. Support and resistance levels Indicators OsMA and Stochastics at different time intervals show mixed dynamics. Nevertheless, the pair AUD / USD continues to remain within the downward channel on the daily chart, trading below the important resistance levels 0.7460 (Fibonacci level of 23.6% correction to the wave of decline of the pair since July 2014), 0.7470 (EMA200 on the 4-hour chart), 0.7510 (EMA200 on the daily chart). Fundamental factors create the prerequisites for further reduction of the AUD / USD pair. The nearest target in case of further decline of the pair will be the level of 0.7330 (November minima and the bottom line of the ascending channel on the weekly chart). The next target in case of breakdown of this support level is the level of 0.7155 (May, December minima of 2016). The minimum wave of the last global decline of the pair since July 2014 is close to the level of 0.6830. The alternative scenario is related to the return of the pair AUD / USD to the zone above the level of 0.7510 and further growth to the resistance levels of 0.7610, 0.7680, 0.7760, 0.7840 (Fibonacci retracement of 38.2% correction to the fall wave from July 2014). Meanwhile, the negative dynamics of the pair AUD / USD prevails. Support levels: 0.7420, 0.7330, 0.7300, 0.7200, 0.7155 Resistance levels: 0.7460, 0.7470, 0.7510, 0.7545, 0.7570, 0.7610, 0.7680 Trading Scenarios Sell Stop 0.7410. Stop-Loss 0.7465. Take-Profit 0.7330, 0.7300, 0.7200, 0.7155 Buy Stop 0.7465. Stop-Loss 0.7410. Take-Profit 0.7500, 0.7535, 0.7545, 0.7570, 0.7600   *) Actual and detailed analytics can be found on the Tifia website at tifia.com/analytics
|
|
#13
31-05-2017, 10:40
|
||||
|
||||
|
EuroStoxx50: decline in the fifth consecutive session
31/05/2017 Current dynamics It seems that the main European stock indexes can finish this week in a negative territory. The election of the president of France is already behind, and the positive momentum begins to fade as weak macro statistics from the Eurozone arrive. ECB President Mario Draghi earlier this week confirmed that economic recovery is accelerating, but core inflation is still too weak to change the monetary policy of the bank. Here and today in the Eurozone came some macro statistics, which confirm the words of Mario Draghi. So, the preliminary index of consumer prices (CPI) of the Eurozone in May grew by 1.4% (against the forecast of + 1.5% and + 1.9% in April). Unemployment in the Eurozone in April fell by 0.1%, but still remains high (9.3%). Decrease in indices is observed throughout the world. So, the US stock indexes on Tuesday fell under the pressure of shares of oil and gas and financial companies. The oil and gas subindex in the S & P500 showed the worst results for the day, falling by 1.3%. The European StoxxEurope600 index lost another 0.3% on Tuesday, with banks and insurance companies leading the decline. The EuroStoxx50 index was down yesterday for the fifth consecutive session. At the beginning of today's European trading session, the EuroStoxx50 index is trading in a narrow range near the mark of 3554.0, however, is under pressure from incoming weak macro statistics for the Eurozone. As has been repeatedly announced by the leaders, the ECB is unlikely to go on winding up the extra soft monetary policy at the moment. The ECB management believes that the growth of the Eurozone economy is still weak enough to begin curtailing the QE program in the Eurozone. So far, this supports European indices. And still, among investors, there is talk that the ECB may announce the curtailment of the QE program in the Eurozone. The ECB's next meeting on monetary policy will be held on June 8. As ECB leaders said earlier, the rate hike will not begin earlier than the quantitative easing program, at which the European Central Bank will buy European assets worth 60 billion euros a month, will be completed. Support and resistance levels At the beginning of the month against the backdrop of the election of the new French president, the EuroStoxx50 index reached a new annual maximum near the mark of 3680.0. After that, a gradual decline in the index started, and at the moment the EuroStoxx50 index is traded at the short-term support level of 3550.0 (EMA144 and the bottom line of the uplink on the 4-hour chart). Indicators OsMA and Stochastics on the 4-hour, daily, weekly charts went to the side of sellers. If the EuroStoxx50 index falls further, the next target will be the support level of 3525.0 (EMA200 on the 4-hour chart, EMA50 on the daily chart). The level is strong enough. In general, the positive dynamics of the EuroStoxx50 index remains. In case of rebound from the level of 3525.0, the growth of the EuroStoxx50 index may resume. At least, the ECB's propensity to continue the extra soft monetary policy contributes to this. Medium-term short positions will become relevant only after the EuroStoxx50 index falls below the level of 3500.0 (March and April highs on the eve of the first round of presidential elections in France). The reduction targets will be support levels 3435.0 (Fibonacci level 23.6% correction to the wave of growth since June 2016), 3380.0 (EMA144), 3325.0 (EMA200 on the daily chart). Support levels: 3525.0, 3500.0, 3435.0, 3380.0, 3325.0 Resistance levels: 3580.0, 3680.0, 3700.0 Trading Scenarios Sell Stop 3520.0 Stop-Loss 3590.0. Take-Profit 3500.0, 3435.0, 3380.0, 3325.0 Buy Stop 3590.0. Stop-Loss 3520.0. Take-Profit 3600.0, 3680.0, 3700.0   *) Actual and detailed analytics can be found on the Tifia website at tifia.com/analytics
|
|
#14
01-06-2017, 10:53
|
||||
|
||||
|
AUD/USD: Against the background of weak macro data from China
01/06/2017 Current dynamics After extremely volatile trading, the Australian dollar fell sharply during the Asian session today. After the release of optimistic data on retail sales in Australia in April (+ 1.0% vs. the forecast + 0.3%), the Australian currency strengthened. This is the largest monthly increase in more than two and a half years. However, soon the Australian dollar fell sharply after China's production report, which turned out to be weak, was published. The index of supply managers (PMI) for China's manufacturing sector from Caixin Media Co. In May, it fell to 49.6 (against 50.3 in April). China is Australia's largest trade and economic partner and a consumer of Australian iron ore and coal. The growth of the Australian economy still depends heavily on the commodity sector. And the decline in commodity prices, as well as the slowdown in the economy of the Australian partner countries, have a strong impact on the Australian dollar, undervaluing its value. At the same time, despite the unexpected growth in retail sales in April, other statistics still indicate a limited increase in consumer spending. Domestic consumption makes a big contribution to GDP growth. In view of the weak growth in consumption in Australia, some economists forecast zero or insignificant GDP growth for the first quarter. The consumer confidence index is weak, salaries are growing slowly, and purchasing power is limited. House prices also began to decline, which unleashes the hands of the RBA in the matter of lowering the interest rate. Earlier this month, the RBA retained its interest rate in Australia at 1.5%. However, the RBA can go on reducing the interest rate in the country due to record household debt, a record low salary growth and a weak labor market. At the same time, the US dollar is showing growth today in the foreign exchange market. Despite the problems that have arisen with the administration of the US President in implementing the plans for a new economic policy, investors focus on positive macro statistics coming from the United States. President of the Fed-San Francisco and FOMC member John Williams today expressed confidence that the strengthening of the US economy justifies "three or four rate hikes" this year. Thus, the difference between the monetary policy of the Fed and the RBA is the main driver for reducing the pair AUD / USD. Today we are waiting for data from the USA. Between 12:15 and 14:00 (GMT) a whole block of important macroeconomic indicators is published. Among the data - the index of business activity ISM in the manufacturing sector (in May) and the index of gradual acceleration of inflation. We expect weaker indicators than in the previous month, which could negatively affect the dollar. Nevertheless, in absolute terms, the figures look very positive. Also worth paying attention to the report of ADP on the level of employment in the private sector of the US for May. Investors often consider it a harbinger of the NFP, although no direct correlation with Non-Farm Payrolls is usually noted. Strong data positively affects the dollar. Here the growth is expected (185,000 versus 177,000 in April), which will support the US dollar. In general, macro statistics are expected to be very positive, which will have a positive impact on the US dollar, including in the pair AUD / USD. Support and resistance levels Since mid-March, the AUD / USD pair is actively declining in the downlink on the daily chart. The pair AUD / USD is below the important resistance levels 0.7510 (EMA200 on the daily chart), 0.7460 (Fibonacci level of 23.6% correction to the wave of decline of the pair since July 2014, as well as the upper limit of the descending channel on the daily chart, EMA200 on the 4-hour Chart). The negative dynamics prevails. Indicators OsMA and Stochastics on the 1-hour, 4-hour, daily charts went to the side of sellers. The closest target in case of further decline of the pair will be the level of 0.7330 (November, May minima and the bottom line of the rising channel on the weekly chart). The next target in case of breakdown of this support level is the level of 0.7155 (May, December minima of 2016). The minimum wave of the last global decline of the pair since July 2014 is close to the level of 0.6830. The alternative scenario is related to the return of the pair AUD / USD to the zone above the level of 0.7510 and further growth to the resistance levels of 0.7610, 0.7680, 0.7760, 0.7840 (Fibonacci retracement of 38.2% correction to the fall wave from July 2014). Fundamental factors create the prerequisites for further reduction of the AUD / USD pair. Support levels: 0.7380, 0.7330, 0.7300, 0.7200, 0.7155 Resistance levels: 0.7420, 0.7460, 0.7510, 0.7545, 0.7570, 0.7610, 0.7680 Trading scenarios Sell Stop 0.7380. Stop-Loss 0.7420. Take-Profit 0.7330, 0.7300, 0.7200, 0.7155 Buy Stop 0.7420. Stop-Loss 0.7380. Take-Profit 0.7460, 0.7510, 0.7535, 0.7545, 0.7570, 0.7600   *) Actual and detailed analytics can be found on the Tifia website at tifia.com/analytics
|
|
#15
02-06-2017, 10:21
|
||||
|
||||
|
XAG/USD: pending publication of data from the labor market
02/06/2017 Current dynamics The focus of attention of all participants of financial markets today is the publication of data from the US labor market, which is scheduled for 12:30 (GMT). Very positive data are expected. Thus, according to the forecast it is expected that the growth of the average hourly wage will be 0.2% (against 0.3% in April), unemployment will not grow (4.4% against 4.4% in April). But perhaps the main focus will be on Non-Farm Payrolls (the number of new jobs created in the non-agricultural sector of the US economy). Yesterday Automatic Data Processing Inc. And Moody's Analytics reported data that in May the number of jobs in the private sector in the US increased by 253,000, which is significantly better than the forecast (185,000 and 174,000 in the previous month). This is the highest growth in the number of jobs since 2014. Recent positive macro data from the US significantly strengthened investors' opinion that the Fed will raise the interest rate by 0.25% to 1.25% on June 13-14. So, positive ADP data on employment contributed to the growth of the dollar and the yield of treasury bonds. The index of the dollar WSJ rose by 0.2%, and the yield of 10-year Treasury bonds rose to 2.225% from 2.198% recorded on Wednesday. Investors are not so much worried about slipping into plans to reform the tax system and stimulate budget spending in the US, focusing on macroeconomic indicators. So, the index of business activity ISM published in the manufacturing sector (for May) released yesterday with a value of 54.9 (the forecast was 54.5 and 54.8 in April). The index of business activity ISM in the manufacturing sector of the US economy is an important indicator of the state of the American economy as a whole. Along with the data from ADP, the publication of the ISM index further stimulated the closing of short positions in the dollar on the eve of today's NFP publication. The Fed pays particular attention to data on the number of jobs, and by many investors they are perceived as the most important indicator of the state of the American economy. Now, many investors expect the Fed to raise rates more rapidly. That's the president of the Fed-San Francisco and FOMC member John Williams today, that the strengthening of the US economy justifies "three or four rate hikes" this year. If the data from the labor market, which are published today, really "do not disappoint", then the dollar will receive a powerful positive impulse before the Fed meeting on June 13-14. Then the market participants will have no doubt that the Fed will raise the rate at this meeting. Higher interest rates make dollar assets more attractive to investors. Precious metals, which do not bring interest income, become cheaper in the conditions of the rate increase; the cost of their acquisition and storage is growing. With disappointing data on the US labor market, the dollar may weaken significantly in the foreign exchange market, and demand for precious metals, particularly silver, with the continuing political tension in the US around President Donald Trump will grow again. Support and resistance levels The pair XAG / USD could not gain a foothold above the key resistance level of 17.35 (EMA200 and the upper limit of the descending channel on the daily chart) and the third day is falling. Indicators OsMA and Stochastics on the 4-hour, daily, weekly charts went to the side of sellers. The pair XAG / USD is in the zone of short-term support levels 17.18 (EMA200 on the 1-hour chart), 17.14 (EMA200 on the 4-hour chart). If the NFP data prove to be strong, the pair XAG / USD will break through the levels of 17.18, 17.14 and go to the support level of 16.85 (Fibonacci level of 23.6% of corrective growth to fall in the pair since August 2016 and level 20.59) with the prospect of a downward movement - 15.72 (low of 2016). You can return to consideration of long positions after fixing a pair above the level of 17.35. Support levels: 17.18, 17.14, 16.85, 16.20, 15.72 Resistance levels: 17.35, 17.58, 18.17, 18.55, 18.75 Trading Scenarios Sell Stop 17.10. Stop-Loss 17.28. Take-Profit 17.00, 16.85, 16.20, 15.72 Buy Stop 17.28. Stop-Loss 17.10. Take-Profit 17.35, 17.58, 18.17, 18.55, 18.75   *) Actual and detailed analytics can be found on the Tifia website at tifia.com/analytics
|
|
#16
05-06-2017, 10:24
|
||||
|
||||
|
GBP/USD: on the eve of parliamentary elections
05/06/2017 Current dynamics The PMI index (or the index of business activity) for the UK services sector in May was 53.8 (the forecast was 55.0, which is lower than the April index of the index 55.8). This index is an indicator of the economic situation in the service sector of Great Britain. The PMI of the UK service sector does not have such a strong impact on GDP as PMI in the manufacturing sector or the level of retail sales and consumer activity in the UK. At the same time, the decline in the PMI index for the service sector negatively affects the British currency. After the publication (08:00 GMT) of this index, the pound declined in the foreign exchange market. Nevertheless, the GBP / USD pair closed its sharp decline (with a gap of 30 points after the next terrorist act in Great Britain last weekend) during today's European session at the opening of today's trading day. Against the backdrop of the weakening dollar, the GBP / USD pair remains positive ahead of the June 8 elections to the UK Parliament. As you know, in mid-April, British Prime Minister Theresa May unexpectedly announced early parliamentary elections to ensure the dominant position of the Conservative Party in Parliament. It is likely that in these 3 days before the election to the UK Parliament the frequency of various sociological polls of the country's population will increase, which will cause an increase in the volatility in the pound trades. The elections, which will be held in the UK on June 8, attract the attention of investors. In the case of a significant advantage of conservatives in parliament, British Prime Minister Theresa May will probably be able to agree with the EU on more favorable conditions for Brexit. If this happens, then the pound may significantly strengthen in the foreign exchange market. This Thursday also will be a meeting of the European Central Bank on monetary policy, and next week will be a meeting of the Fed. It is widely expected that the Fed will raise the rate by 0.25% to 1.25%. Nevertheless, the dollar remains under pressure in the foreign exchange market. Probably, all the same, that the risks associated with the implementation of the new economic policy of President Donald Trump, as well as his statements about the desirability of a cheaper dollar, outweigh the sellers of the dollar. Thus, if conservatives manage to get a convincing majority in the June 8 elections, then the GBP / USD pair can significantly strengthen. Otherwise, the pound and GBP / USD pair are expected to weaken in the foreign exchange market. In any case, this week, especially on the eve of June 8, the pound is expected to have increased volatility with sharp movements in both directions. Support and resistance levels The GBP / USD pair is currently trading near the balance line and the level of 1.2885, through which the 200-period moving average passes on the 1-hour chart. The GBP / USD pair keeps positive dynamics, trading in the uplink on the daily chart, above the key support levels of 1.2840 (EMA200 on the 4-hour chart), 1.2800 (EMA200 and the bottom line of the rising channel on the daily chart). Indicators OsMA and Stochastics on the 1-hour, 4-hour, daily charts went to the side of buyers. In case of breakdown of the local resistance level 1.2925, the pair GBP / USD growth will resume, and the GBP / USD pair will go to the resistance levels 1.3050 (May highs), 1.3210 (Fibonacci level 23.6% correction to the GBP / USD decline in the wave, which began in July 2014 near the level of 1.7200). In the case of breakdown of the support level 1.2800 and further reduction in support, the level will be 1.2700 (EMA144 on the daily chart). Further GBP / USD dynamics will in many respects be determined by the dynamics of the dollar and the comments of the Fed, which will be sounded on June 14, after the decision on the interest rate in the US is made. Support levels: 1.2885, 1.2840, 1.2800, 1.2760, 1.2700, 1.2680, 1.2590, 1.2485, 1.2340, 1.2110 Resistance levels: 1.2925, 1.3000, 1.3050, 1.3100, 1.3210 Trading Scenarios Sell Stop 1.2855. Stop-Loss 1.2910. Take-Profit 1.2840, 1.2800, 1.2760, 1.2700, 1.2680, 1.2590, 1.2485, 1.2340, 1.2110 Buy Stop 1.2910. Stop-Loss 1.2855. Take-Profit 1.2925, 1.3000, 1.3050, 1.3100, 1.3210   *) Actual and detailed analytics can be found on the Tifia website at tifia.com/analytics
|
|
#17
06-06-2017, 09:52
|
||||
|
||||
|
XAU/USD: investors prefer safe havens
06/06/2017 Current dynamics The dollar continues to be under pressure following Friday's disappointing US labor market data for May. As you know, despite the fact that the unemployment rate in the US fell by 0.1% to a level of 4.3%, the NFP was significantly below the forecast. The number of jobs outside of US agriculture in May increased by 138,000 compared with April (the forecast was +184,000). Against the backdrop of a number of political and economic events that have recently occurred and are expected this week, investors prefer to withdraw their savings into safe haven assets - government bonds, yen, precious metals. Strengthening tensions in the Middle East around Qatar, a number of recent terrorist attacks in Britain, lower expectations of budget stimulation of the US economy, the expectation of the speech of former FBI director James Komi before the US Congress on Thursday, as well as parliamentary elections in the UK and the ECB meeting also scheduled for Thursday - here are the main geopolitical risks that increase the demand for gold and other safe assets. Gold enjoys strong demand even though the probability of an increase in the interest rate in the US next week is estimated by investors higher than 90%. As you know, higher interest rates make dollar assets more attractive to investors, and lead to the sale of gold. This precious metal does not bring interest income and can not compete with assets that generate such income, for example, government bonds. At the same time, the cost of acquiring gold and its storage is growing. And, nevertheless, the increased geopolitical risks promote active purchases of gold. So, at the beginning of today's European session, gold is trading near the level of 1288.00 dollars per troy ounce, which is $ 20 or 1.5% higher than the opening price of the current month. At the same time, the index of the dollar WSJ, which reflects the value of the US dollar against the basket of 16 other currencies, fell to a value of 88.16, approaching the levels where it was before the victory of Donald Trump in the November 8 elections. It is likely that before June 8, when the elections to the British Parliament and the ECB meeting on monetary policy are held, the pair XAU / USD will maintain a positive trend with a propensity for further growth. Support and resistance levels Having rebounded from the support level of 1220.00 (the lower border of the rising channel on the daily chart and the Fibonacci level of 38.2% correction to the wave of decline since July 2016), since the middle of last month the pair XAU / USD continues to grow actively within the upward channel on the daily chart. The nearest target and resistance level of 1292.00 (Year and April highs) can be passed to the nearest trading session. A more distant goal is the resistance level of 1305.00, just above which the upper limit of the ascending channel passes on the daily chart. The highs of the previous wave of growth of the pair XAU / USD are near the level of 1370.00. Indicators OsMA and Stochastics on the 4-hour, daily, weekly charts went to the side of buyers. The reverse scenario is related to the return of the pair XAU / USD to support level 1277.00 (Fibonacci level 61.8%) and further decrease to support levels 1257.00 (EMA200 on 4-hour chart), 1248.00 (Fibonacci level 50%). Breakdown of the key support level of 1240.00 (EMA200 on the daily chart) will increase the risks of a return to the downtrend. Support levels: 1277.00, 1261.00, 1257.00, 1248.00, 1240.00, 1220.00, 1200.00, 1185.00 Resistance levels: 1292.00, 1305.00 Trading Scenarios Sell Stop 1278.00. Stop-Loss 1293.00. Take-Profit 1270.00, 1257.00, 1248.00, 1240.00 Buy Stop 1293.00. Stop-Loss 1278.00. Take-Profit 1305.00, 1400.00   *) Actual and detailed analytics can be found on the Tifia website at tifia.com/analytics
|
|
#18
07-06-2017, 11:00
|
||||
|
||||
|
AUD/USD: GDP data supported the Australian dollar
07/06/2017 Current dynamics While all the attention of investors is concentrated these days on Europe, the Australian dollar has received powerful support today from positive macro statistics and is actively growing in the foreign exchange market. The Australian dollar strengthens in the foreign exchange market, and the AUD / USD pair has been growing for the fourth consecutive session. According to the data released today, Australia's GDP in the first quarter grew by 0.3% (the forecast was + 0.2%) against + 1.1% in the previous quarter and by 1.7% in annual terms (forecast was +1.5 %). The data turned out to be better than the forecast, which inspired market participants, who resumed purchases of the Australian currency, despite the fact that this is the slowest annual GDP growth rate since 2009. The growth of the Australian economy continues for 26 years after the recession that ended in the early 1990s. Over the years, the country's economy has become one of the most sustainable in the world. Nevertheless, slow growth rates of wages and incomes of the population of Australia, increased unemployment and low, according to the RBA, the growth rate of the country's GDP can not but alarm the monetary authorities and the Australian government. As you know, yesterday, the RB of Australia left the key interest rate unchanged at 1.50%. As it was said in the accompanying statement, "the strengthening of the Australian dollar will complicate the adjustment of the economy", and "the preservation of rates unchanged corresponds to the goals in relation to GDP, inflation". As noted in the RBA, the conditions for doing business in the country have improved, the capacity utilization has increased, however, there are other risks for the country's economy that restrain the RBA from tightening monetary policy. At the same time, the slowdown in China's economy, Australia's largest trade and economic partner, its high debt levels represent an external medium-term risk factor for economic growth in Australia. On Thursday (01:30 GMT), the Australian Bureau of Statistics will publish data on the foreign trade balance of Australia for April. A decrease in the balance surplus is expected to reach 1.91 billion Australian dollars. First of all, it is necessary to pay attention to the export data, which is the most important component of the country's budget. Reduction of the balance and export level surplus may negatively affect the quotations of the Australian dollar. Also on Thursday and Friday during the Asian trading session in China, published a number of important macroeconomic indicators (for May). If the data indicate deterioration in China's foreign trade balance and a slowdown in inflation, the Australian dollar may also react with a decline. Support and resistance levels The AUD / USD pair broke the key resistance level 0.7510 (EMA200, EMA144 on the daily chart) at a strong positive momentum at the beginning of the month from the support level of 0.7375 (the bottom line of the uplink on the 4-hour chart and on the weekly chart) and develops an upward trend. The pair AUD / USD is trading in the uplink on the weekly chart, the upper limit of which is above the resistance level of 0.7840 (the Fibonacci level of 38.2% correction to the wave of decline of the pair since July 2014). Indicators OsMA and Stochastics on the 4-hour, daily and weekly charts went to the side of buyers. The pair's growth will continue with the targets of 0.7610, 0.7680, 0.7760 (EMA144 on the weekly chart), 0.7840 (the Fibonacci level of 38.2% correction to the wave of the pair's decline since July 2014), provided the US dollar remains weak. A more distant medium-term goal in this case is the level of 0.8000 (EMA200 on the weekly chart). If the positive dynamics of the AUD / USD pair remains, this goal can be achieved by September-October of the current year. The reverse scenario implies a return to the descending channel on the daily chart and the resumption of the decline in the wave that began in mid-March. The breakdown of the short-term support level at 0.7460 (EMA200 on 1-hour, 4-hour charts and 23.6% Fibonacci level) will confirm this scenario. The nearest medium-term goal in case of further decline in the pair will be the level of 0.7330 (November and May lows). The next target in case of breakdown of this support level is the level of 0.7155 (May, December minima of 2016). The minimum of wave in the last global decline of the pair since July 2014 is close to the level of 0.6830. Support levels: 0.7510, 0.7460, 0.7420, 0.7375, 0.7330, 0.7300, 0.7200, 0.7155 Resistance levels: 0.7570, 0.7610, 0.7680, 0.7760 Trading Scenarios Sell Stop 0.7490. Stop-Loss 0.7530. Take-Profit 0.7460, 0.7420, 0.7375, 0.7330, 0.7300, 0.7200, 0.7155 Buy Stop 0.7570. Stop-Loss 0.7530. Take-Profit 0.7600, 0.7680, 0.7760 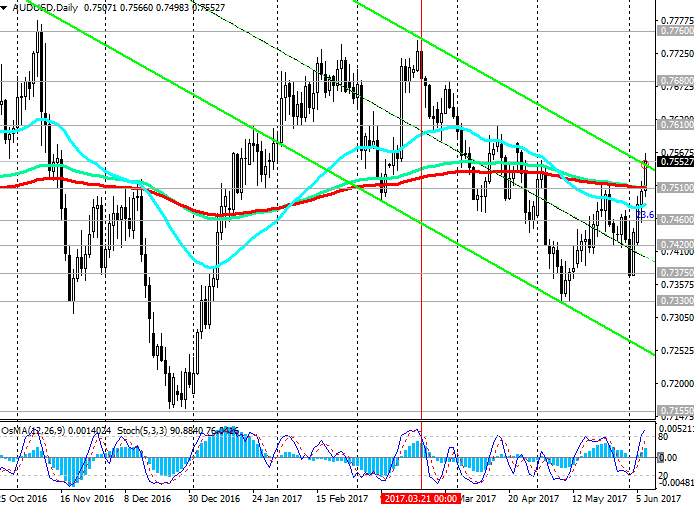 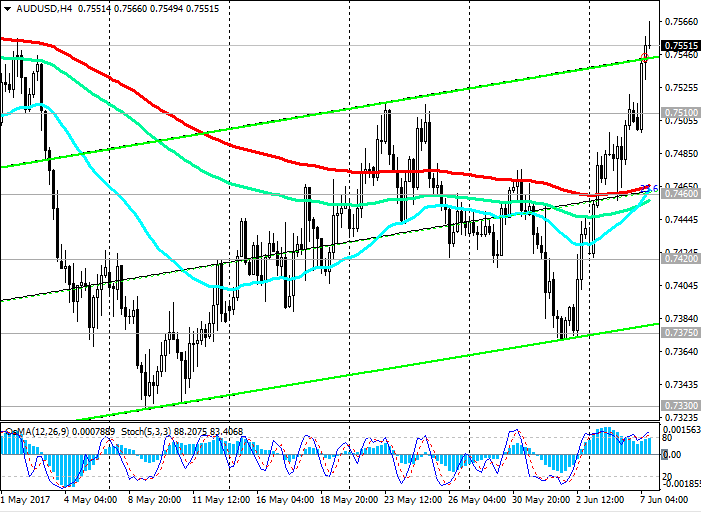 *) Actual and detailed analytics can be found on the Tifia website at tifia.com/analytics
|
|
#19
08-06-2017, 10:48
|
||||
|
||||
|
DJIA: US stock indexes are rising
08/06/2017 Current dynamics Despite all the volatility of foreign exchange markets and the uncertainty in the world political arena observed in recent weeks, the US stock market remains stable, as evidenced by the continued growth of major US stock indexes. While the index of the dollar WSJ, which reflects the value of the US dollar against 16 other currencies, declined in recent months to a level near the level of 88.00 (on Tuesday the index closed at a minimum since November 4), and the yield of 10-year US government bonds fell to the level of 2.1 % -2.2%, US stock indexes are breaking new records. So, the S & P500 index rose by 1.2% in May. DJIA and S & P500 rose for the second month in a row. But the biggest increase is demonstrated by the technological index Nasdaq, which in May grew by 2.5%, and the Nasdaq index has been growing for the seventh month in a row. The Dow Jones Industrial Average, which includes shares of the largest US banks, also demonstrates a stable upward trend, which began in February last year. Even after the publication of an ambiguous report on the US labor market, published last Friday, the main US stock indexes rose again. The unemployment rate reached a minimum in May for 16 years, down to 4.3% from 4.4% in April. In general, the report on the US labor market is favorable enough for the Fed to raise interest rates next week. The probability of this is estimated by investors at about 90%. "Given the good state of the economy", as President of the Federal Reserve Bank of Philadelphia Patrick Harker said last week, we can expect further growth in US stock indices, even though the Fed will raise the interest rate. Uncertainty about the implementation of the new economic policy of US President Donald Trump seems to be less worrisome for investors who are betting on the growth of the US stock market. Today and tomorrow, a volatility surge is expected in the foreign exchange market due to the fact that the ECB decides on the interest rate, there will be elections in the UK, and in the US, a former FBI head James Komi will speak in a Senate committee, testifying to the possible impact of Russia on the election campaign in the US, which can further complicate the position of President Donald Trump . The most cautious traders today took a wait-and-see attitude. With respect to the US stock indices, we can say that strong corporate reports for the first quarter, evidence of a stable recovery in the US economy, and a policy of gradual increase in interest rates in the US create the basis for further growth of the US stock market. Support and resistance levels At the beginning of the month the DJIA index exceeded the recent annual highs near 21170.0 and closed last week at the new absolute maximum of 21200.0. Indicators OsMA and Stochastics on the 4-hour, daily, weekly charts continue to remain on the side of buyers. The DJIA index continues to grow in the ascending channels on the 4-hour, daily, weekly charts. In case of breakdown of the level 21200.0, the growth of the index may continue. In the alternative scenario, a short-term correction to the lower border of the uplink and EMA200 on the 1-hour chart (level 21115.0) is possible. Deeper correction movement is possible to the lower border of the ascending channel on the daily chart (level 20600.0). If the downward trend is to increase, then the decline in the index may extend to support levels of 20360.0 (April lows), 19990.0 (EMA200 on the daily chart and December highs), 19850.0 (Fibonacci level of 23.6% correction to the wave growth from the level of 15660.0 after recovery in February this year to the collapse of the markets since the beginning of the year. The maximum of this wave and the Fibonacci level of 0% are near the mark of 21170.0). The positive dynamics of the US stock market and DJIA index remains. Only in case of breakdown of the support level 19850.0 can we speak about the breakdown of the bullish trend. Support levels: 21170.0, 21020.0, 21000.0, 20965.0, 20825.0, 20600.0, 20500.0, 20360.0, 19990.0, 19850.0 Resistance levels: 21200.0, 22000.0 Trading Scenarios Buy in the market. Stop-Loss 21090.0. Take-Profit 21220.0, 22000.0 Sell Stop 21090.0. Stop-Loss 21220.0. Take-Profit 21020.0, 21000.0, 20965.0, 20825.0, 20600.0   *) Actual and detailed analytics can be found on the Tifia website at tifia.com/analytics
|
|
#20
09-06-2017, 10:46
|
||||
|
||||
|
XAG/USD: The dollar is strengthening
09/06/2017 Current dynamics The third trading session the dollar strengthens in the foreign exchange market against the assets-shelters - yen, franc, precious metals. The dollar received an additional positive impulse today after the first results of the elections to the UK Parliament became known, and after the ECB yesterday's meeting. As you know, the ECB kept the benchmark interest rate at 0%, the deposit rate - at the level of -0.4%, the rate on marginal loans - at the level of 0.25%. The QE program, in which the ECB monthly buys European assets worth 60 billion euros, has also remained unchanged. The pound today collapsed in the foreign exchange market immediately after the first results of the exit poll of the elections became known yesterday at 21:00 (GMT), according to which the Conservatives and its leader, the current Prime Minister of Britain, Theresa May, failed to achieve an absolute majority in the country's parliament. The ruling Conservative party, although it remains the largest in the parliament, received 314 of 650 seats. Most votes are provided by 326 seats. Any factors that increase uncertainty around Brexit will be negative for the pound and the British stock market. The US dollar, meanwhile, is building up its positions in the foreign exchange market. The index of the dollar WSJ, which reflects the value of the US dollar against the basket of 16 other currencies, rose yesterday by 0.1%, to 88.21. Now, after the ECB meeting, investors' attention shifts to a meeting of the US Federal Reserve System, which will be held on June 13-14. Most market participants expect an interest rate increase of 0.25%. August gold futures fell 1.2% yesterday, to 1278.20 dollars per troy ounce. Other precious metals, in particular silver, are also falling in price. The pair XAG / USD is down today for the third consecutive session, trading during today's European session near the mark of 17.35 dollars per troy ounce. The probability of an increase in the interest rate in the US next week is estimated by investors higher than 90%. As you know, higher interest rates make dollar assets more attractive to investors, and lead to the sale of precious metals that do not bring interest income. At the same time, the costs of their acquisition and storage are growing. And, nevertheless, the continuing geopolitical risks, as well as political uncertainty in the UK, the US, France, where elections to the local parliament will also take place this weekend, support the demand for precious metals. Of the news for today, it is worth paying attention to the publication at 12:30 (GMT) of data from the labor market of Canada, which may increase volatility in the foreign exchange market. Support and resistance levels For the past 4 weeks, the pair XAG / USD has skyrocketed in the upward short-term channel on the 4-hour chart, the upper limit of which is close to the level of 17.86. At the moment, after a three-day corrective decline, the pair XAG / USD is trading near support levels of 17.25 (EMA200 and the bottom line of the uplink on the 4-hour chart), 17.35 (EMA200, EMA144 on the daily chart). Indicators OsMA and Stochastics on the 4-hour, daily charts went to the side of sellers. The reduction scenario is associated with a breakthrough in the support level at 17.25 and a further decline in the downward channel on the daily chart with targets of 16.85 (the Fibonacci level of 23.6% of corrective growth to the fall of the pair since August 2016 and the level of 20.59), 16.05, 15.72 (low of 2016 ). The immediate goal in the case of continued growth of the pair XAG / USD are the levels of 17.58 (Fibonacci level 38.2%), 17.86 (EMA144 on the weekly chart). Here, the upper line of the descending channel passes on the daily and weekly charts. More distant medium-term targets are the levels 18.17 (Fibonacci 50%), 18.48 (EMA200 on the weekly chart and April highs), 18.75 (Fibonacci level 61.8%). In the dynamics of the pair XAG / USD, one should pay attention to the current correlation with the pairs USD / JPY (-85%), XAU / USD (71%). Given the rather high cross-correlation, and how these pairs are relative to key support levels (EMA200, EMA144 on the daily chart), the conclusion suggests: either the pair XAG / USD will grow slightly (within 1.0% - 1.5%), Or remain at the current level of 17.35 (key support level (EMA200, EMA144 on the daily chart), but provided that the dollar in pairs USD / JPY, XAU / USD increases by the same amount (1.0% - 1.5%). In the current situation of geopolitical uncertainty and on the eve of the Fed meeting next week, both options are possible. Support levels: 17.35, 17.25, 17.00, 16.85, 16.20, 15.72 Resistance levels: 17.58, 17.86, 18.17, 18.48, 18.75 Trading Scenarios Sell Stop 17.23. Stop-Loss 17.46. Take-Profit 17.00, 16.85, 16.20, 15.72 Buy Stop 17.46. Stop-Loss 17.23. Take-Profit 17.58, 17.86, 18.17, 18.48, 18.75   *) Actual and detailed analytics can be found on the Tifia website at tifia.com/analytics
|
|
#21
13-06-2017, 10:55
|
||||
|
||||
|
NZD/USD: when will the pair begin to decline?
13/06/2017 Current dynamics This week a number of important events will take place: meetings of central banks of Switzerland, Great Britain, Japan. However, the focus of traders will be a two-day meeting of the Fed (June 13-14) and the Fed's decision on the interest rate, which will be published June 14 at 18:00 (GMT). Forecast: the rate will be increased by 0.25% to 1.25%. After the decision on the interest rate, a comment on the monetary policy (FOMC Statement) is published and the press conference of the Federal Reserve begins. In the period of publication, a surge in volatility is expected across the financial market, and market participants will study the statement of the Fed on the presence of signals for further plans for monetary policy. Higher interest rates tend to support the dollar, making US assets more attractive to investors, and putting pressure on commodity prices and commodity currencies. If the Fed signals about the possibility of one or two more rate increases this year, the US dollar will receive significant support. Also on Wednesday (at 22:45 GMT) a report on New Zealand's GDP for the first quarter is published. Forecast: + 0.7% (previous value + 0.4%). The publication of data will cause increased volatility in NZD. Against the background of rising prices for agricultural products in recent years (especially for dairy products, which is an important part of New Zealand's exports), it is likely that the report on New Zealand's GDP for the first quarter will come with positive indicators, and this will positively affect the positions of the New Zealand currency. If the GDP report turns out to be worse than expected, and the Fed signals about the possibility of further interest rate hikes, then the NZD / USD pair may drop sharply and finally begin a corrective downward movement to the pair's active growth from the middle of last month. Otherwise, the pair NZD / USD will continue its upward movement against the backdrop of positive macro data coming in from New Zealand recently. We also await data from New Zealand on the balance of payments for the first quarter (it is expected that the negative balance was 1 billion New Zealand dollars against the surplus of 1.18 billion NZ dollars in the 1st quarter of last year), which are published today at 10:45 (GMT) And data from China (retail sales, industrial production in May) on Wednesday morning, which will increase the volatility of trades on the New Zealand dollar. *)An advanced fundamental analysis is available on the Tifia website at tifia.com/analytics Support and Resistance levels As a result of active growth, which began in the middle of last month, the pair NZD / USD broke through a strong resistance level of 0.7190 (EMA144 on the weekly chart) and came close to the resistance level of 0.7235 (the Fibonacci level of 38.2% of the upward correction to the global fall wave from the level of 0.8800 , Which began in July 2014, the minimums of December 2016). A little higher, through to the resistance level of 0.7270 is the 200-period moving average on the weekly chart. Thus, the NZD / USD pair is in the zone of strong resistance levels. For further growth and breakdown of these levels, the pair NZD / USD needs strong positive fundamental drivers, for example, signals from the RBNZ about the possibility of an early interest rate increase in New Zealand. The next meeting of the RBNZ on this issue will be held on June 21, ie. Already next week. As you know, RBNZ last month kept interest rate at 1.75% and stated that interest rates will remain unchanged for quite a long time, at least until the third quarter of 2019. If, however, in the rhetoric of the bank will be marked a more rigid position, the New Zealand dollar will receive a strong support, and then the resistance level of 0.7270 can be passed. Otherwise, the New Zealand dollar and the pair NZD / USD are waiting for a decline. While the RBNZ seeks to keep the current monetary policy unchanged, the Fed says it plans to gradually tighten monetary policy in the US. The difference between the monetary policies of the RBNZ and the Fed will remain the main fundamental factor in favor of the US dollar in the next couple of years, despite the possible growth periods for the NZD / USD pair over several weeks. The return of the pair NZD / USD to the short-term support level 0.7165 (EMA200 on the 1-hour chart) may trigger a further decline in the NZD / USD pair and in the medium term with a target near the key support level of 0.7050 (EMA200, EMA144, EMA50 on the daily chart). By the way, indicators OsMA and Stochastics on the daily period begin to unfold on short positions. Support levels: 0.7190, 0.7165, 0.7100, 0.7050, 0.6945, 0.6900, 0.6885, 0.6860, 0.6818 Resistance levels: 0.7235, 0.7270, 0.7300, 0.7380 Trading Scenarios Sell Stop 0.7190. Stop-Loss 0.7240. Take-Profit 0.7165, 0.7100, 0.7050, 0.6945, 0.6900, 0.6885, 0.6820 Buy Stop 0.7240. Stop-Loss 0.7190. Take-Profit 0.7270, 0.7300, 0.7380   *) For up-to-date and detailed analytics and news on the forex market visit Tifia company website tifia.com
|
|
#22
14-06-2017, 10:54
|
||||
|
||||
|
GBP/USD: inflation "eats" the wages of Britons
14/06/2017 Overview and dynamics Despite the fact that the Fed is expected to raise the key interest rate by a quarter of a percentage point following its two-day meeting, which will end today, the dollar remains under pressure in the foreign exchange market. The index of the dollar WSJ, which tracks the value of the US dollar against a basket of 16 currencies, decreased by 0.2%, to 88.31. The probability of such a decision on the part of the Fed is estimated by investors at 100%. Nevertheless, market participants are waiting for a press conference (will begin at 18:30 GMT) and comments of the Fed to assess further plans for interest rates and reducing the balance. The rate increase today at 0.25% is already taken into account in prices. And if the Fed signals about the suspension of tightening monetary policy, the US dollar will further fall. Slowing inflation in the US could alert the Fed. So, today at 12:30 (GMT) a block of the most important macro data from the USA is published, including inflation indices (retail sales and consumer price index for May). Nearly zero growth in May is expected (+ 0.1% and + 0.0%, respectively), which again indicates a slowdown or a very weak inflation rate in the US. If the Fed signals about the possibility of raising the rate one or two more times this year, the dollar will rise sharply in the foreign exchange market. The likelihood of such a scenario is also possible. As the Fed officials said more recently, the central bank can go on raising rates, despite a weak inflation rate, in order to avoid overheating the economy and the growth of soap bubbles in the US stock market. As for the pound, yesterday, along with the Canadian dollar, it was among the leaders of growth against the US dollar. The pound rose on strong inflation data from the European session yesterday (the consumer price index in the UK rose to 2.9% in May in annual terms (the forecast was + 2.7%)), the highest level in nearly four years. Today, the pair GBP / USD demonstrates the reverse dynamics and declines at the beginning of the European session. According to the data published on Wednesday, the level of wages adjusted for inflation fell for the second consecutive month compared to the same period last year. Real wages declined by 0.6% compared to the same period last year. The incomes of the country's population are declining because of inflation. This could negatively affect the growth of the British economy, which is highly dependent on domestic consumption. Consumer spending is an important component of UK GDP growth. On Thursday, the Bank of England (11:00 GMT) decides on the interest rate. It is likely that the interest rate will remain at the same level of 0.25%. Also at this time are published: a report on the monetary policy with the results of voting on the rate and other issues, as well as with comments on the state of the economy; the protocol of the Bank of England's Monetary Policy Committee (MPC) with the distribution of votes for and against the increase / decrease in the interest rate. The Bank of England will be very cautious about the issue of raising the interest rate, despite the high level of inflation in the country. The intrigue about the further actions of the Bank of England remains. In the period of publication of the decision of the bank and during its subsequent press conference, the volatility of the pound trade is expected, which is already characterized by its high intraday volatility. *)An advanced fundamental analysis is available on the Tifia website at tifia.com/analytics Technical analysis Despite support from strong inflation data, the pair GBP / USD failed to break through resistance level 1.2800 (EMA200 on 1-hour and daily charts), and after the publication of data on the labor market in the UK in the European session again declining. The pound continues to remain under pressure amid uncertainty around Brexit. At the moment, the pair GBP / USD is trading at support level 1.2715 (EMA144 on the daily chart). In case of a breakdown of the support level of 1.2640 (June lows and the lower limit of the uplink on the daily chart), the GBP / USD pair will accelerate. Indicators OsMA and Stochastics on the 1-hour, 4-hour, daily, weekly charts went to the side of sellers. Negative dynamics prevails. The pair GBP / USD decline will continue with the nearest targets near the levels 1.2550, 1.2340, between which the lower limit of the ascending channel passes on the weekly chart. The alternative scenario implies the return of the GBP / USD pair above the level of 1.2825 (EMA200 on the 4-hour chart) with the prospect of further growth within the upward channel on the daily chart with targets of 1.3050 (annual highs), 1.3210 (Fibonacci level of 23.6% GBP / USD in the wave, which began in July 2014 near the level of 1.7200 and the upper limit of the rising channel on the daily chart). Support levels: 1.2715, 1.2700, 1.2640, 1.2550, 1.2485, 1.2340, 1.2110 Resistance levels: 1.2800, 1.2825, 1.2850, 1.2900, 1.2940, 1.3000, 1.3050, 1.3100, 1.3210 Trading Scenarios Sell Stop 1.2690. Stop-Loss 1.2770. Take-Profit 1.2600, 1.2520, 1.2485, 1.2340, 1.2110 Buy Stop 1.2770. Stop-Loss 1.2690. Take-Profit 1.2800, 1.2850, 1.2900, 1.2940, 1.3000, 1.3050, 1.3100, 1.3210   *) For up-to-date and detailed analytics and news on the forex market visit Tifia company website tifia.com
|
|
#23
15-06-2017, 11:15
|
||||
|
||||
|
AUD/USD: after the Fed meeting
15/06/2017 Current dynamics As a result of a two-day meeting, the Fed raised yesterday the interest rate by 0.25% to 1.25%. The decision was expected, and the dollar reacted with sufficient restraint to it. The dollar began to strengthen later, when at 18:30 (GMT) the FRS press conference began, from which it became known that the Fed is planning another increase towards the end of the year, as well as cutting its budget, which is about 4.5 trillion US dollars. The portfolio of FRS assets rose to the current level from 800 billion dollars before the crisis, which was due to a number of bond purchase programs aimed at reducing long-term interest rates. According to some economists' estimates, the reduction of assets by $ 675 billion by 2019 will be equivalent to raising the key short-term interest rate of the Federal Reserve by a quarter of a percentage point. The process of reducing the balance of the Fed will also lead to an increase in the yield of 10-year US Treasury bonds, which will be accompanied by the strengthening of the dollar. Thus, the Fed once again confirmed its intention to tighten monetary policy in the US. As is known, at the beginning of the month, the RB of Australia left the key interest rate unchanged at 1.50%. As it was said in the accompanying statement, "the strengthening of the Australian dollar will complicate the adjustment of the economy", and "the preservation of rates unchanged corresponds to the goals in relation to GDP, inflation". As noted in the RBA, the conditions for doing business in the country have improved; however, there are other risks for the country's economy, which restrain the RBA from tightening monetary policy. Slow growth rates of wages and incomes of the population of Australia, increased unemployment and low, according to the RBA, the growth rate of the country's GDP will restrain the RBA from tightening monetary policy. The volatility of commodity prices, in particular iron ore, one of Australia's major export commodities, and their propensity to decline against the expected strengthening of the US dollar, also represents one of the significant risks to the Australian economy, which still retains the raw material features in many respects. The Australian dollar has grown today after the release of data showing a sharp increase in employment and a drop in the unemployment rate. Thus, the unemployment rate in May fell to 5.5% from 5.7% in April. The number of employees increased by 42,000 (with a growth by forecast of 10,000). The Australian labor market data was optimistic and supported the Australian dollar. Nevertheless, the divergence of the directions of the monetary policy of the Fed and other world central banks supports the US dollar. This situation can also be attributed to the pair AUD / USD. If the Fed plans to raise the interest rate, the RBA intends to adhere to the current rate at least until the second half of 2018. We are waiting for today news from the US, which will increase volatility in pairs with the US dollar, including in the pair AUD / USD. A number of important macro data will be published between 12:30 and 14:00 (GMT), among which the weekly report of the US Department of Labor, containing data on the number of initial applications for unemployment benefits. The forecast is expected to decrease to 242,000 versus 245,000 for the previous period, which should positively affect the US dollar. Also data on industrial production in the US for May and the use of production capacity will be published. However, today and in the near future investors will still assess the results of the two-day meeting of the Fed and the increase in the interest rate in the US. *)An advanced fundamental analysis is available on the Tifia website at tifia.com/analytics Support and resistance levels Unlike other major currency pairs, the pair AUD / USD rose today during the Asian and European sessions, which was supported, among other things, by positive data from the Australian labor market published this morning. Nevertheless, it is worth paying attention to the indications of the indicators OsMA and Stochastics, which on the 1-hour, 4-hour, daily charts are deployed to short positions. On the general background of today's US dollar growth, the AUD / USD pair is likely to follow other dollar-denominated currency pairs. If in the course of the US trading session there are positive macro data on the US, it will probably become the trigger for the fall of the AUD / USD pair. "First Swallow" will be a breakdown of the short-term support level 0.7580 (EMA50 on the 1-hour chart). The fall in the AUD / USD pair in this case may continue to the support level of 0.7540 (EMA200 on the 1-hour chart). The breakdown of the support level of 0.7514 (EMA200 on the daily chart) will confirm the scenario for the fall of the pair AUD / USD. The closest target in case of further decline of the pair will be the levels of 0.7495 (EMA200 on the 4-hour chart), 0.7460 (Fibonacci level of 23.6%). The following targets in case of breakdown of this support level - 0.7330 (November, May lows), 0.7155 (May, December minima of 2016). The minimum wave of the last global decline of the pair since July 2014 is close to the level of 0.6830. If the pair AUD / USD maintains its positive dynamics, its growth will continue with the targets of 0.7635, 0.7680, 0.7760 (EMA144 on the weekly chart), 0.7840 (the Fibonacci level of 38.2% correction to the wave of the pair's decline since July 2014). Support levels: 0.7580, 0.7540, 0.7514, 0.7495, 0.7460, 0.7445, 0.7420, 0.7375, 0.7330, 0.7300 Resistance levels: 0.7635, 0.7680, 0.7700, 0.7760 Trading Scenarios Sell Stop 0.7570. Stop-Loss 0.7640. Take-Profit 0.7540, 0.7514, 0.7495, 0.7460, 0.7445, 0.7420, 0.7375, 0.7330, 0.7300 Buy Stop 0.7640. Stop-Loss 0.7570. Take-Profit 0.7680, 0.7700, 0.7760   *) For up-to-date and detailed analytics and news on the forex market visit Tifia company website tifia.com
|
|
#24
16-06-2017, 10:35
|
||||
|
||||
|
XAG/USD: The dollar will build up positions
16/06/2017 Current dynamics After on Wednesday the Fed announced an increase in the key interest rate, the dollar is steadily increasing its positions in the foreign exchange market. The index of the dollar WSJ rose above the level of 88.60. The central bank also made it clear that it could once again raise rates in 2017, which provided additional support to the dollar. Yesterday, ambiguous macro data on the United States came out. Although the weekly report on the number of claims for unemployment benefits showed a value of 237,000 against the forecast of 242,000, the labor market in the US looks quite stable. As you know, on Wednesday the Fed raised the interest rate by 25 basis points, to the range of 1-1.25% and signaled the possibility of another rate hike near the end of the year. The US Central Bank also planned to reduce its balance by $ 4.5 trillion later this year. Higher interest rates make dollar assets more attractive for investors, and lead to the sale of precious metals that do not bring interest income. At the same time, the costs of their acquisition and storage are growing. The Fed raised the rate, despite the recent slowdown in consumer inflation in the US. The Fed also reiterated that it plans to cut its budget, which is about 4.5 trillion US dollars. According to some economists' estimates, the reduction of assets by $ 675 billion by 2019 will be equivalent to raising the key short-term interest rate of the Federal Reserve by a quarter of a percentage point. The process of reducing the balance of the Fed will also lead to an increase in the yield of 10-year US Treasury bonds, which will be accompanied by a strengthening of the dollar and, again, a decline in the price of gold and silver. Precious metals are getting cheaper, even despite the continuing geopolitical tensions. Apparently, the prospect of another increase near the end of the year outweighs the chalice in favor of sellers and exerts additional pressure on the assets of the shelter, including silver. *)An advanced fundamental analysis is available on the Tifia website at tifia.com/analytics Support and resistance levels The price of silver has been steadily declining for the past two weeks. The XAG / USD pair broke through the important support levels of 17.35 (EMA200, EMA144 on the daily chart), 17.14 (EMA200, EMA144 on the 4-hour chart), 16.85 (Fibonacci level of 23.6% corrective growth to the pair's decline since August 2016 and the level of 20.59), 16.05, 15.72 (low of 2016) and continues to decline in the descending channels on the 4-hour, daily, weekly charts. The lower boundary of the channels passes below the level of 15.72 (the minimums of 2016). This mark and will become a medium-term goal in case of further strengthening of the dollar in the foreign exchange market and a decline in the pair XAG / USD. Indicators OsMA and Stochastics on the 1-hour, 4-hour charts went to the buyers side, signaling a possible short-term upward correction with targets near the levels of 16.85, 17.00. The immediate goal in the case of continued growth of the pair XAG / USD are the levels of 17.35, 17.58 (Fibonacci level of 38.2%). Here, the upper line of the descending channel passes on the daily and weekly charts. More distant medium-term goals in the case of further growth of the pair XAG / USD are the levels of 17.86 (EMA144 on the weekly chart), 18.17 (Fibonacci 50%), 18.48 (EMA200 on the weekly chart and April highs), 18.75 (Fibonacci level 61.8%). Negative dynamics still prevails. Support levels: 16.65, 16.20, 16.05, 15.72 Resistance levels: 16.85, 17.00, 17.14, 17.35, 17.58, 17.70, 17.86, 18.17, 18.48, 18.75 Trading Scenarios Sell Stop 16.65. Stop-Loss 16.85. Take-Profit 16.20, 16.05, 15.72 Buy Stop 16.85. Stop-Loss 16.65. Take-Profit 17.00, 17.14, 17.35, 17.58, 17.70, 17.86, 18.17, 18.48, 18.75   *) For up-to-date and detailed analytics and news on the forex market visit Tifia company website tifia.com
|
|
#25
19-06-2017, 09:33
|
||||
|
||||
|
Brent: the number of drilling in the US rose again
19/06/2017 Current dynamics The new trading week, the price of oil begins with a decline. Brent crude futures for ICE Futures fell to $ 47.23 a barrel during today's Asian session. Published on Friday, data from the American oil service company Baker Hughes showed that the number of oil drilling rigs in the US increased again last week, this time by six units to 747 units, which was the 22nd consecutive week of the increase. Earlier, quotes of oil fell for four consecutive weeks. Despite the recent extension of the OPEC-Russia deal to reduce oil production for another 9 months, the excess supply in the oil market remains, and the world's oil reserves remain high. Oil prices since the beginning of this year have fallen by 17%, losing the positions won after the deal in late 2016. The increase in oil production in the United States and other major oil-producing countries largely offset OPEC's efforts to limit oil production. After the entry into force of the OPEC agreement other countries as a whole reduced production by about 1.8 million barrels a day. During the same time, the US increased production by 750,000 barrels per day to 9.3 million barrels a day, the maximum since the summer of 2015. In fact, by the efforts of the US alone, more than a third of the reduced production was offset. And this apart from prey in other countries, such as Brazil, Libya, Canada. Libya recently reported plans to increase oil production by 160,000 barrels per day. Previously, production in Libya at these facilities was suspended for almost two years. According to experts, by the end of July, daily oil production in Libya could grow to 1 million barrels. There are all prerequisites to the fact that the volume of oil supply in the US will also increase more and more, further reducing the effect of the agreement within OPEC. Increasing the efficiency of oil production in the United States can reduce the cost of production to less than $ 40 per barrel against $ 63 in 2014. Now investors expect further price reductions and are hedged against the potential drop in oil prices in the coming months below $ 41 per barrel. *)An advanced fundamental analysis is available on the Tifia website at tifia.com/analytics Support and resistance levels On a weekly chart, the price of Brent crude oil broke the lower border of the rising channel near the current level of 47.10 and develops a downward trend. Indicators OsMA and Stochastics on the 4-hour, daily, weekly charts went to the side of sellers. On the monthly chart the indicators also unfold to short positions. At the beginning of the month the price broke through the important support levels of 51.35 (EMA200 on the daily chart), 50.70 (the Fibonacci level 61.8% correction to the decline from the level of 65.30 from June 2015 to the absolute minimums of 2016 near the 27.00 mark) and is currently declining to The support level is 46.20 (the Fibonacci level is 50.0%). In case of consolidation below level 46.20, the upward trend of the price of Brent oil may be canceled. The scenario for strengthening the price is connected with the breakdown of the local resistance level of 48.35 (EMA200 on the 1-hour chart) and further growth within the rising channel on the weekly chart, the upper limit of which passes near the level of 62.00. Nevertheless, negative sentiments continue to dominate the oil market, and against this background, oil prices remain under pressure with a tendency to further decline. Support levels: 47.10, 46.20, 45.50 Resistance levels: 48.35, 50.00, 50.70, 51.35, 52.50, 53.00 Trading Scenarios Sell Stop 47.10. Stop-Loss 47.80. Take-Profit 46.20, 45.50, 43.50 Buy Stop 47.80. Stop-Loss 47.10. Take-Profit 48.35, 50.00, 50.70, 51.35, 52.50, 53.00   *) For up-to-date and detailed analytics and news on the forex market visit Tifia company website tifia.com
|
|
#26
20-06-2017, 09:59
|
||||
|
||||
|
XAG/USD: precious metals are getting cheaper amid plans of the Fed
20/06/2017 Current dynamics After last Wednesday the Fed announced an increase in the key interest rate, precious metals continued to go down in the foreign exchange market. The index of the dollar WSJ rose above the level of 88.60, to the level of 88.75 on Monday. The American Central Bank made it clear that it could once again raise rates in 2017, and also planned to reduce its balance by $ 4.5 trillion later this year. According to the CME Group, futures on interest rates by the Fed show that the probability of another increase in Fed rates this year is about 47% (against 41% last week). Rising rates usually support the dollar, making it more attractive to investors. Higher interest rates also lead to the sale of precious metals, which do not bring interest income. At the same time, the costs of their acquisition and storage are growing. President of the Fed-New York William Dudley said on Monday that he was "very confident" of "long-term" economic growth in the US, which is the third longest in the history of the United States. American stock markets are growing steadily. The weakening of the hype surrounding US President Trump, the stabilization of the political situation in the Eurozone after the presidential and parliamentary elections in France, also contribute to reducing political risks and prices for precious metals. Nevertheless, further strengthening of the dollar clearly lacks an additional positive momentum. Some weaker than expected macro data from the US, some people question the Fed's determination to further tighten the monetary policy in the US. Perhaps, the statements of a number of representatives of the Federal Reserve scheduled for this week will once again give confidence to investors who are betting on the growth of the dollar. For example, on Tuesday, scheduled speeches by the president of the Fed-Boston Eric Rosengren, executive director of the Federal Reserve Bank of Dallas Robert Kaplan and Deputy Chairman of the Federal Reserve Stanley Fischer. On Friday, Fed Governor Jerome Powell and FRS President St. Louis James Bullard will deliver a speech. *)An advanced fundamental analysis is available on the Tifia website at tifia.com/analytics Support and resistance levels Meanwhile, the price of silver has been steadily declining for the past two weeks. Today, with the opening of the trading day, the price of silver is growing, however, the negative trend continues. The pair XAG / USD broke through the important support levels of 17.33 (EMA200, EMA144 on the daily chart), 17.10 (EMA200 on the 4-hour chart), 16.88 (Fibonacci level of 23.6% of corrective growth to the pair decline since August 2016 and level of 20.60) and Continues to decline in the descending channels on the 4-hour, daily, weekly charts with immediate targets near the levels of 16.15, 15.73 (low in 2016) The lower boundary of the channels passes below the level of 15.73 (the minimums of 2016). This mark and will be the goal in case of further strengthening of the dollar in the foreign exchange market and the decline of the pair XAG / USD for the next 3-4 weeks. Indicators OsMA and Stochastics on the 1-hour, 4-hour charts went to the buyers side, signaling a possible short-term upward correction with targets near the level of 16.88. More distant goals in the case of the resumption of the growth of the pair XAG / USD - the levels of 17.33 (May highs), 17.59 (Fibonacci level 38.2%). Here, the top line of the descending channel passes on the 4-hour, daily and weekly charts. More distant medium-term goals in the case of further growth of the XAG / USD pair - the levels of 18.18 (Fibonacci 50% and EMA200 on the weekly chart and April highs), 18.76 (Fibonacci level 61.8%). So far, negative dynamics prevails. Support levels: 16.30, 16.15, 15.73 Resistance levels: 16.88, 17.10, 17.33, 17.59, 18.18, 18.76 Trading scenarios Sell Stop 16.45. Stop-Loss 16.70. Take-Profit 16.25, 16.15, 15.73 Buy Stop 16.70. Stop-Loss 16.45. Take-Profit 17.00, 17.10, 17.33, 17.59, 18.17, 18.48, 18.76   *) For up-to-date and detailed analytics and news on the forex market visit Tifia company website tifia.com
|
|
#27
21-06-2017, 09:52
|
||||
|
||||
|
GBP/USD: it's too early to think about raising rates
21/06/2017 Current dynamics As you know, last week the Bank of England kept its interest rate at 0.25%; however, it surprised the market participants. Three of the eight members of the Monetary Policy Committee voted to tighten monetary policy, citing signs of accelerating inflation in the UK. This information caused a sharp reaction of the markets. The GBP / USD pair strengthened in the moment by 100 points, however, subsequently the pound declined; The Bank of England did not take any measures in either direction. Nevertheless, the pound continues to remain under pressure in the foreign exchange market amid political uncertainty. Conservatives failed to achieve an absolute majority in the British parliament, and talks between British Prime Minister Therese May on the formation of a coalition with the Northern Ireland Democratic Unionist party have reached a deadlock. After the June 8 elections, the pair GBP / USD fell by about 350 points. And the pressure on the pair seems to be mounting. Yesterday, Bank of England Governor Mark Carney said that it is still too early to think about raising rates in the UK, which further lowered the expectations of British currency buyers for its growth. As shown by the data published last week, real wages in May decreased by 0.6% compared to the same period last year. The incomes of the country's population are declining because of inflation. Consumer spending is one of the important components of GDP growth in the UK, and their decline adversely affects the growth of the British economy. Today (at 10:30 GMT) the Queen of Great Britain is expected to speak, at 11:00 - Andrew Haldane, Executive Director for Monetary and Credit Analysis and Statistics of the Bank of England, as well as a member of the Monetary Policy Committee, and on Friday (18:00 GMT) - member of the Committee for Monetary Policy of the Bank of England Christine Forbes. It is likely that key representatives of the Bank of England will also express their opinion in the spirit of their boss Mark Carney about the prematureness of raising rates in the UK, which will further weaken the position of the pound. *)An advanced fundamental analysis is available on the Tifia website at tifia.com/analytics Support and resistance levels After the parliamentary elections in Great Britain on June 8, the GBP / USD pair broke through the important support levels of 1.2800 (EMA200 on day and 4-hour charts), 1.2715 (EMA144 and the bottom line of the rising channel on the daily chart) and develops a downward trend. Indicators OsMA and Stochastics on the 4-hour, daily, weekly charts went to the side of sellers. The pound continues to remain under pressure amid uncertainty around Brexit. In case of breakdown of the support level 1.2430 (the lower limit of the uplink on the weekly chart), the GBP / USD pair will go to the support levels of 1.2370, 1.2110, 1.2000 (the minimums of the global wave of the GBP / USD decline, which began in July 2014 near the level of 1.7200). Negative dynamics in the pair GBP / USD prevails. The alternative scenario implies the return of the GBP / USD pair above the level of 1.2800 with the prospect of further growth within the upward channel on the daily chart with targets of 1.3050 (annual highs), 1.3210 (23.6% Fibonacci retracement correction from 1.7200 level), 1.3300 (upper Border of the rising channel on the daily chart). Support levels: 1.2550, 1.2485, 1.2370, 1.2340, 1.2110 Resistance levels: 1.2640, 1.2715, 1.2800, 1.2950, 1.3000, 1.3050, 1.3100, 1.3210 Trading Scenarios Sell Stop 1.2580. Stop-Loss 1.2650. Take-Profit 1.2550, 1.2485, 1.2340, 1.2110 Buy Stop 1.2650. Stop-Loss 1.2580. Take-Profit 1.2715, 1.2800, 1.2850, 1.2900, 1.2950, 1.3000, 1.3050, 1.3100, 1.3210, 1.3300   *) For up-to-date and detailed analytics and news on the forex market visit Tifia company website tifia.com
|
|
#28
22-06-2017, 10:51
|
||||
|
||||
|
Brent: the reduction of stocks in the US did not change the mood of investors
22/06/2017 Current dynamics According to a weekly report released yesterday by the US Department of Energy, US oil inventories fell by 2.451 million barrels last week (the forecast was expected to reduce inventories by 2.1 million barrels). Immediately after the publication of the Ministry of Energy data, oil prices went up, however, for a short time. Growth was unstable, and in the next three hours the price for Brent crude oil fell by $ 1.7 to $ 44.7 per barrel. WTI futures on NYMEX traded yesterday with a decline of about 2.4%. Contracts for Brent crude fell by 2.63% to 44.81 dollars per barrel. This behavior of the price can only be explained by one thing: investors do not believe that OPEC's efforts will help restore the balance in the oil market and strengthen prices. Moreover, the countries of the cartel began to sell oil from their own storage facilities, while still cutting production. The increase in production in Nigeria and Libya, part of OPEC, but exempt from the reduction obligations, weakens the hopes for the restoration of oil prices. The US has been very successful in this situation, which continues to increase oil production, filling the vacant niche in the oil market. Oil production in the US last week increased again, by 20,000 barrels per day, more than 9.3 million barrels per day, the highest since summer 2015. The number of oil drilling rigs in the US increased again last week, this time by six units to 747 units, which was the 22nd consecutive week of the increase. Excess supply in the oil market remains, and the world's oil reserves remain high. Oil prices since the beginning of this year have fallen by about 28%, completely losing the positions won after the conclusion of the OPEC deal in late 2016. Today, there is a slight recovery in the price of oil after a non-stop three-day decline. Nevertheless, the oil market is dominated by a strong negative momentum. The oil market seems to be shifting again into a bearish phase. *)An advanced fundamental analysis is available on the Tifia website at tifia.com/analytics Support and resistance levels On a weekly chart, the Brent oil price broke the lower border of the rising channel near the level of 47.50 and develops a downward trend. On the daily chart, the price came very close to the lower boundary of the descending channel, passing near the mark of 44.65. Today, the OsMA and Stochastic indicators on the 1-hour and 4-hour charts have turned to long positions. However, this indicates for the time being a short-term upward correction. On daily and weekly charts, indicators remain on the side of sellers. Negative dynamics is growing at an accelerated pace. The price broke through the important support levels of 51.35 (EMA200 on the daily chart), 50.70 (the Fibonacci retracement level of 61.8% of the correction to the decline from the level of 65.30 from June 2015 to the absolute minimums of 2016 near the 27.00 mark), 46.20 (Fibonacci level 50.0%). There are two remaining milestones left - support levels of 43.50 (November lows), 41.70 (Fibonacci level of 38.2%), the breakdown of which will finally return prices for Brent crude oil in a downtrend. In case of consolidation below level 46.20, the upward trend of the price of Brent oil may be canceled. Return to consideration of long positions is possible only if the price returns above the short-term local resistance level of 47.25 (EMA200 on the 1-hour chart) and the level of 47.50 (the lower limit of the ascending channel on the weekly chart). The oil market is dominated by negative sentiment, and against this background, oil prices remain under pressure with a tendency to further decline. Support levels: 44.65, 43.50, 41.70 Resistance levels: 45.50, 46.20, 47.25, 47.50, 48.35, 50.00, 50.70, 51.35 Trading Scenarios Sell Stop 44.90. Stop-Loss Section 46.10. Take-Profit 44.65, 43.50, 41.70 Buy Stop 46.10. Stop-Loss 44.90. Take-Profit 47.25, 47.50, 48.35, 50.00, 50.70, 51.35   *) For up-to-date and detailed analytics and news on the forex market visit Tifia company website tifia.com
|
|
#29
23-06-2017, 10:30
|
||||
|
||||
|
DJIA: investors are pausing
23/06/2017 Current dynamics After the active growth and the achievement earlier this week of new one-month highs, the main US stock indexes suspended growth. The DJIA index is down for the fourth consecutive day, however, since the opening of today's trading day is trading in a narrow range near the mark of 21400.00. It seems that investors took a pause before the publication of fresh macro data on the US economy. At 13:45 and 14:00 (GMT) will be published indexes of business activity in the manufacturing sector and services sector (PMI business activity from Markit Economics) in the US for June, as well as a report on the sale of new homes in the US in May . The PMI index is an important indicator of the business environment and the general state of the US economy. The indicator, exceeding the mark of 50, in general is a positive factor for US stock indices. The expected growth in indicators will support the dollar and stock indexes. At 18:15 (GMT), the speech of FOMC member Jerome Powell will begin. From it, investors will want to hear information about the prospects for inflation and interest rates in the US. If Powell, like the other leaders of the Fed this week, speaks in favor of a softer scenario of raising rates in the US, this will support American indices. American stock indexes rose on the basis of the current month, which ends next week. Macro statistics coming out across the US are generally quite positive to have a positive impact on US stock markets. Their positive dynamics are still being preserved. *)An advanced fundamental analysis is available on the Tifia website at tifia.com/analytics Support and resistance levels On Tuesday, DJIA exceeded its recent annual highs and reached a new absolute maximum near the mark of 21538.0. Nevertheless, subsequently the DJIA index decreased and today at the beginning of the European session is traded at the short-term support level of 21380.0 (EMA200 on the 1-hour chart, EMA50 on the 4-hour chart). Here, the lower limit of the ascending channel passes on the 4-hour chart. The current level is quite strong, and about the arrival of today positive macro data from the US DJIA index can rebound from this level of 21380.0 and resume growth. At the same time, the indicators OsMA and Stochastics on the 1-hour, 4-hour, daily charts turned to short positions, signaling a possible continuation of the downward correction. There may be a correction decrease to the level of 21117.0 (EMA200 on the 4-hour chart). Deeper correction movement is possible to the lower border of the ascending channel on the daily chart (level 20900.0). If the downward trend is to increase, the decline in the index may continue to support levels of 20500.0 (the May lows and EMA144 on the daily chart), 20360.0, 20158.0 (EMA200 on the daily chart, December highs and Fibonacci level of 23.6% correction to wave growth from the level 15660.0 after the recovery in February this year to a collapse in the markets since the beginning of the year. The maximum of this wave and the Fibonacci level of 0% is near the mark of 21538.0). The positive dynamics of the US stock market and DJIA index remains. Only in case of breakdown of the support level 20158.0 can we speak about the breakdown of the bullish trend. Support levels: 21380.0, 21170.0, 20900.0, 20500.0, 20360.0, 20158.0, 19300.0 Resistance levels: 21538.0, 22000.0 Trading Scenarios Buy Stop 21460.0. Stop-Loss 21310.0. Take-Profit 21538.0, 22000.0 Sell Stop 21310.0. Stop-Loss 21460.0. Take-Profit 21170.0, 20900.0, 20500.0, 20360.0, 20158.0   *) For up-to-date and detailed analytics and news on the forex market visit Tifia company website tifia.com
|
|
#30
27-06-2017, 09:55
|
||||
|
||||
|
XAU/USD: the dollar drops before the performance Janet Jellen
27/06/2017 Current dynamics With the opening of today's trading day, and especially at the beginning of the European session, the dollar is falling in the foreign exchange market. Published yesterday, data from the US Department of Commerce showed a reduction in orders for durable goods in May by 1.1% compared to the previous month, which was the strongest decline in six months. Demand for durable goods in the US in May fell for the second consecutive month. Other macro data from the US also come out with weaker indicators. So, published on Friday, indicators of activity in the manufacturing and services sectors in the US declined in June. The preliminary index of supply managers (PMI) for the US manufacturing sector in June fell to 52.1 against 52.7 in May, reaching a 9-month low. The preliminary index of supply managers (PMI) for the US service sector fell to a 3-month low, reaching 53 versus 53.6 in May. The decline in macroeconomic indicators and the low level of inflation in the US can not but worry the Fed leaders. Previously, the Federal Reserve raised the key interest rate to a range of 1% -1.25%, saying it expects another rate hike this year. However, market participants do not believe that the Fed can really proceed with further tightening of monetary policy amid weak data on inflation in the US. "The US Federal Open Market Committee can refrain from actions and analyze the development of the macroeconomic situation in the coming quarters", said Fed President St. Louis James Bullard on Friday. Today, market participants will wait for the speech of the head of the Fed, Janet Yellen, which will start at 5:00 pm (GMT). If Janet Yellen again signals about the Fed's inclination to tighten monetary policy, confirming its view that slowing inflation is a temporary phenomenon, then the dollar will quickly regain its positions in the foreign exchange market. According to the CME Group, futures for interest rates by the Fed indicate that the probability of another increase in the Fed's rates this year is about 50%. Rising rates usually support the dollar, making it more attractive to investors. At the same time, prices for precious metals, denominated in US currency, are declining. *)An advanced fundamental analysis is available on the Tifia website at tifia.com/analytics Support and resistance levels Meanwhile, the price of gold is growing with the opening of today's trading day. The pair XAU / USD pushed back from the support level of 1245.00 (EMA144, EMA200 on the daily chart), however, its growth stopped at the short-term resistance level of 1253.00 (EMA200 on the 1-hour chart). The pair XAU / USD is in the descending channel on the 4-hour chart. More seriously to the recovery of the upward movement of the pair XAU / USD can be attributed only after its consolidation above the resistance level 1257.00 (EMA200, EMA144 and the top line of the descending channel on the 4-hour chart). If the trend of strengthening the dollar will gain momentum, then the price of gold will continue to decline gradually. The return of the pair XAU / USD into the zone below the key support level of 1245.00 will strengthen its negative dynamics. The breakdown of the support level of 1220.00 (the Fibonacci level of 38.2% correction to the wave of decline since July 2016) will increase the risks of a return to the downtrend. Support levels: 1248.00, 1245.00, 1236.00, 1220.00, 1200.00, 1185.00 Resistance levels: 1253.00, 1257.00, 1260.00, 1277.00, 1295.00, 1305.00 Trading Scenarios Sell Stop 1249.00. Stop-Loss 1254.00. Take-Profit 1245.00, 1236.00, 1220.00, 1200.00, 1185.00 Buy Stop 1254.00. Stop-Loss 1249.00. Take-Profit 1257.00, 1260.00, 1277.00, 1295.00, 1305.00   *) For up-to-date and detailed analytics and news on the forex market visit Tifia company website tifia.com
|
|
#31
28-06-2017, 09:50
|
||||
|
||||
|
EuroStoxx50: European stock indexes are down
28/06/2017 Current dynamics Statements made by ECB President Mario Draghi on Tuesday at a conference in Portugal provoked a sharp rise in the euro and a fall in European stock indices. Mario Draghi said that "all the signs now point to the strengthening and expansion of the basis for the recovery of the Eurozone economy." Draghi spoke very cautiously about the ECB's monetary policy, saying that "it is necessary to reasonably approach the adjustment of the parameters of our policy in response to the improvement of the economic situation in order to ensure the combination of our incentives with the restoration of the economy against the background of continuing uncertainties." At the same time, Draghi repeated that "it is necessary to persevere in carrying out our monetary and credit policy. Any changes in its direction should occur gradually and only if the justification for improving the dynamics seems to be quite reliable, "and" interest rates should be low so that the growth rate can recover ". Recall that the ECB's key rate (on deposits for commercial banks) has remained negative since June 2014. And, nevertheless, Draghi's speech was perceived by market participants as a hint at the likelihood of curtailing the incentive program in the Eurozone in the near future. Now, many market participants expect that the ECB will begin to close the quantitative easing program in January 2018, and after the completion of the curtailment of the QE program, the ECB will gradually raise deposit rates and refinancing rates. The euro showed the strongest growth for the year yesterday, while the prices of Eurozone bonds and most European stocks fell. At the same time, the yield of government bonds of countries such as Germany, France and Italy has risen sharply. EuroSTOXX50 continues to decline today, losing about 1.4% during two incomplete days and trading at the beginning of the European trading session near the 3510.0 mark. If the ECB really starts to curtail the QE program in the Eurozone, the euro will continue to strengthen, and the European stock indexes decline. Today, the attention of market participants will be focused on the speeches of the heads of central banks of Great Britain, Japan, Canada and the Eurozone, which will begin at 13:30 (GMT). In this period of time, a surge in volatility is expected in the foreign exchange market, including world stock markets. *)An advanced fundamental analysis is available on the Tifia website at tifia.com/analytics Support and resistance levels The EuroStoxx50 index broke yesterday the support level of 3542.0 (EMA50 on the daily chart, EMA200 on the 4-hour chart) and remains under pressure, decreasing in the descending channel on the daily chart. In case of breakdown of the support level of 3495.0 (June lows and April highs observed on the eve of the presidential elections in France), the EuroStoxx50 index will continue to decline. The reduction targets will be the support levels 3420.0 (EMA144 and the lower border of the descending channel on the daily chart), 3380.0 (EMA200 on the daily chart and the Fibonacci level of 61.8% correction to the decline wave since April 2015 and from the level of 3840.0). Only in case of return to the zone above the level of 3542.0 can we speak about restoring the positive dynamics of the EuroStoxx50 index. In case of breakdown of the resistance level of 3610.0 (June highs), the growth of the EuroStoxx50 index may resume within the uplink on a weekly chart, the upper limit of which is just near the Fibonacci level of 100% (the beginning of the decline wave since April 2015 and the level of 3840.0). Support levels: 3495.0, 3420.0, 3380.0 Resistance levels: 3542.0, 3590.0, 3610.0, 3680.0, 3700.0 Trading Scenarios Sell Stop 3490.0. Stop-Loss 3525.0. Take-Profit 3420.0, 3400.0, 3380.0 Buy Stop 3525.0. Stop-Loss 3490.0. Take-Profit 3542.0, 3590.0, 3610.0, 3680.0, 3700.0   *) For up-to-date and detailed analytics and news on the forex market visit Tifia company website tifia.com
|
|
#32
29-06-2017, 10:25
|
||||
|
||||
|
S&P500: investors remain optimistic
29/06/2017 Overview and dynamics American stock indexes retain a positive trend against the backdrop of sales of government bonds. The yield of 10-year US government bonds, according to Tradeweb, rose on Wednesday to 2.223% from 2.198% on Tuesday. Investors remain confident that US economic growth is strong enough. At the same time, there were also speculations that weak inflation in the US would force the Fed to refrain from raising interest rates. The index of Nasdaq Composite on Wednesday showed the most significant growth since November and increased by 87.79 points (by 1.4%) to 6234.41 points. Growth in the price of shares of technology and financial companies contribute to the growth of US stock indices. Shares in the technology sector in the S & P500 this year increased by almost 19%, and on Wednesday again showed the leading dynamics, rising by 1.3%. The financial sector in the S & P500 grew by 1.6% yesterday. The index itself S & P500 gained 0.9%, rising above the mark of 2440.0. Newly rising oil prices also contribute to the growth of oil and gas stocks in the S & P500 index. Despite the release of data that recorded an increase in US oil inventories in the last week, Brent crude futures rose 0.9% to $ 47.95 per barrel. If Donald Trump can keep his promise and reduce corporate taxes, this will further promote the growth of US indices. Thus, there is every reason to assume that the positive dynamics of US stock indices will continue, probably even before the end of the year, when the Fed again can raise the interest rate. *)An advanced fundamental analysis is available on the Tifia website at tifia.com/analytics Technical analysis The index continues to grow in the ascending channels on the daily, weekly charts. At the beginning of today's European session, the index trades above the short-term support level of 2435.0 (EMA50 on the 4-hour chart, EMA200 on the 1-hour chart). In June, the index updated the absolute maximum near the mark of 2453.0. Nevertheless, the OsMA and Stochastic indicators on the 1-hour and 4-hour charts turned to short positions. A downward correction is likely with the immediate goals of 2435.0, 2421.0 (EMA200 on the 4-hour chart). Only the breakdown of the support level at 2395.0 (the lower limit of the uplink on the daily chart and the highs of February and April) can cause a deeper correction to the level of 2355.0 (May lows). The breakdown of the support level of 2305.0 (EMA200 on the daily chart and the Fibonacci level of 23.6% of the correction for growth since February 2016) will cancel the bullish trend of the index. Nevertheless, the positive dynamics of the S & P500 index remains. After the breakdown of the resistance level of 2453.0 (June highs), the growth of the index will resume. Support levels: 2435.0, 2421.0, 2405.0, 2395.0, 2355.0, 2305.0 Resistance levels: 2453.0 Trading Scenarios Sell Stop 2405.0. Stop-Loss 2417.0. Objectives 2388.0, 2355.0, 2326.0, 2305.0, 2280.0 Buy Stop 2417.0. Stop-Loss 2405.0. Objectives 2450.0, 2500.00   *) For up-to-date and detailed analytics and news on the forex market visit Tifia company website tifia.com
|
|
#33
30-06-2017, 10:34
|
||||
|
||||
|
Brent: prices are recovering
30/06/2017 Current dynamics Oil prices continue to recover. The rise of the last days has become the longest since April. The price of Brent crude is growing for the seventh consecutive session. Prices received additional support from data on the reduction of oil production in the US last week by 100,000 barrels per day. By the beginning of today's European session, August futures for WTI crude oil on the NYMEX were trading at $ 45.21 per barrel, with an increase of $ 0.28, while Brent crude futures gained 0.63% to $ 47.72 per barrel. Prices for these types of oil this week rose by more than 5%. The spot price for Brent crude is approaching $ 48.00 per barrel at the beginning of the European session. Also, the growth of oil prices contributes to the weakening of the dollar in the foreign exchange market. The probability that in December the Fed can raise the rate by another 0.25% goes into the background. Investors' attention this week was focused on the statements of the leaders of several of the world's largest central banks (Europe, Great Britain, Canada) about the possibility of an early tightening of monetary policy in these countries, which led to the growth of currencies of these countries against the US dollar. Nevertheless, the fundamental factors for oil prices remain rather negative. Excessive supply in the market can grow on the background of increased oil production in Libya and Nigeria. The number of oil drilling rigs in the US increased again last week, this time by 11 units to 758 units, which was the 23rd consecutive week of the increase. Excess supply in the oil market remains, and the world's oil reserves remain high. Investors are still not sure about the stabilization of oil prices. If the US again grows oil production, then pessimism can again return to the oil market. Despite the current price increase, a negative impulse prevails in the oil market. Today (17:00 GMT) publishes a weekly report of the Baker Hughes oilfield services company on the number of active drilling platforms in the US, which is an important indicator of the activity of the oil sector of the US economy and significantly affects the quotes of oil prices. At the moment, the number of active drilling platforms in the US is 758. *)An advanced fundamental analysis is available on the Tifia website at tifia.com/analytics Support and resistance levels Last week, the price of Brent oil broke the lower border of the rising channel weekly chart near the level of 47.70 and develops a downward trend within the falling channel on the daily chart. The lower boundary of this channel passes near the level of 43.50 (November minima). The price is below the key resistance level of 50.70 (EMA200, EMA144 on the daily chart, the Fibonacci level of 61.8% correction to the decline from the level of 65.30 from June 2015 to the absolute minimums of 2016 near the 27.00 mark), 46.20 (Fibonacci level 50.0%) . Corrective growth may continue to the resistance level of 48.65 (EMA200 on the 4-hour chart), from which the price may again return to a downtrend. On the monthly and weekly charts, the OsMA and Stochastic indicators remain on the sellers side. In the event of breakdown of support levels of 43.50 (November lows), 41.70 (Fibonacci level of 38.2%), the price of Brent crude will finally return to a downtrend. Return to consideration of long positions is possible only if the price returns to the zone above the short-term local resistance level of 48.65 (EMA200 on the 4-hour chart). The oil market is dominated by negative sentiment, and against this background, oil prices remain under pressure with a tendency to further decline. Support levels: 47.70, 46.20, 45.50, 44.55, 43.50, 41.70 Levels of resistance: 48.65, 50.00, 50.70 Trading Scenarios Sell Stop 47.30. Stop-Loss 48.30. Take-Profit 47.00, 46.20, 45.50, 44.55, 43.50, 41.70 Buy Stop 46.10. Stop-Loss 44.90. Take-Profit 47.25, 47.50, 48.35, 50.00, 50.70, 51.35   *) For up-to-date and detailed analytics and news on the forex market visit Tifia company website tifia.com
|
|
#34
03-07-2017, 11:44
|
||||
|
||||
|
AUD/USD: RBA decision on the rate
03/07/2017 Current dynamics Tomorrow at 04:30 (GMT), the RB of Australia publishes an interest rate decision. It is widely expected that the rate will remain at the same level of 1.5%. The growing Australian dollar is not profitable for the recovery of the Australian economy, whose GDP growth rates in the first quarter have already slowed. Last week was marked by the fact that representatives of the Bank of England, Bank of Canada and the ECB signaled a tendency to tighten monetary and credit policy. However, the RBA is unlikely to follow in the footsteps of the Bank of England, the Bank of Canada and the ECB. And yet, even a slight hint of the RBA Governor Philip Lowe on the positive state of the Australian labor market and the Australian economy could trigger the growth of the Australian dollar. In this case, amid weakening expectations of an increase in the rate from the Fed, the pair AUD / USD could rush to the level of 0.8000. Conversely, the soft tone of the RBA's accompanying statement will help to weaken the AUD and lower the AUD / USD. *)An advanced fundamental analysis is available on the Tifia website at tifia.com/analytics Support and resistance levels The AUD / USD pair remains positive dynamics, trading in the upward channels on the 4-hour, daily, weekly charts. The OsMA and Stochastic indicators on the daily, weekly charts are on the buyers side. However, it's worth noting that on the 1-hour, 4-hour chart, the OsMA and Stochastics indicators went to the sellers' line, signaling the beginning of a downward correction. The correction targets are support levels of 0.7625 (EMA200 on the 1-hour chart), 0.7560 (EMA200 on the 4-hour chart). In case of breakdown of the level of 0.7560, further decrease to the key support level of 0.7525 (EMA200, EMA144 on the daily chart) is possible. The targets in case of further decline of the pair will be the levels of 0.7460 (the Fibonacci level of 23.6% of the correction to the wave of decline of the pair from July 2014, the minimum of the wave is near 0.6830), 0.7420, 0.7375, 0.7330 (November and May lows). The breakdown of the support level of 0.7330 will call into question the uptrend of the pair AUD / USD. If the pair AUD / USD maintains its positive dynamics, after its return to the zone above the level of 0.7690 (the upper line of the rising channel on the daily chart), its growth will continue with the targets 0.7710, 0.7760 (EMA144 on the weekly chart), 0.7840 (Fibonacci level 38.2%), 0.8000 (EMA200 and the upper line of the ascending channel on the weekly chart). Support levels: 0.7625, 0.7560, 0.7525, 0.7460, 0.7445, 0.7420, 0.7375, 0.7330 Resistance levels: 0.7690, 0.7710, 0.7760 Trading Scenarios Sell on the market. Stop-Loss 0.7680. Take-Profit: 0.7625, 0.7560, 0.7525, 0.7460, 0.7445, 0.7420 Buy Stop 0.7680. Stop-Loss 0.7570. Take-Profit 0.7690, 0.7710, 0.7760, 0.8000   *) For up-to-date and detailed analytics and news on the forex market visit Tifia company website tifia.com
|
|
#35
04-07-2017, 11:12
|
||||
|
||||
|
GBP/USD: The dollar is rising again
04/07/2017 Overview and dynamics According to data provided by Markit today, the index of supply managers (PMI) for the UK construction sector fell in June (54.8 against 56.0 in May and 55 according to the forecast). Nevertheless, the pound reacted rather sluggishly to this data. In June, there is a weakening of the growth momentum in the UK construction sector, according to Markit, however, the PMI index remains above the level of 50, indicating an increase in activity. The slowdown in activity is generally observed in the UK economy (due to the "renewal of the rejection of risk", as stated in the report of Markit) amid concerns about economic and political uncertainties in the country. This is the lowest level of optimism about the prospects for the UK economy since December 2016. This Markit report goes against the statement of Bank of England Governor Mark Carney, made during his speech at the forum of the European Central Bank in Portugal at the end of June. Mark Carney said that "a partial waiver of incentive measures is likely to be necessary, since the Bank of England will no longer have to compromise, and the decision-making process will enter the normal course". Now market participants will wait for the meeting of the Bank of England in August, and it is not excluded, according to Mark Carney's statement, that the rate will be increased by 0.25%. Expectations of this development support the buyers of the pound. This week, the markets will study the data on industrial production and foreign trade of Great Britain (for May), which will be released on Friday, to understand how the growth in production in the country meets the expectations of economists. Today in the US, a day off (Independence Day), low trading volumes and activity of traders will continue until tomorrow, when Asia opens. Nevertheless, the dollar is now increasing its positive dynamics after yesterday's growth amid strong production data. The Institute for Supply Management (ISM) said on Monday that the Purchasing Managers Index (PMI) for the US manufacturing sector rose to 57.8, the highest level since August 2014. Now, market participants will closely monitor the publication on Wednesday (18:00 GMT) of the minutes from the last FOMC meeting of the Fed and the US labor market data for June, which are published on Friday 12:30 (GMT). It is expected that the Fed will confirm the continuation of tightening of monetary policy. The probability of another rate increase in 2017 is estimated by investors at 62%, according to the CME Group. *)An advanced fundamental analysis is available on the Tifia website at tifia.com/analytics Support and resistance levels Nevertheless, the pair GBP / USD remains positive, trading above the short-term 1.2885 (EMA200 on 1-hour), 1.2830 (EMA200 and the bottom line of the uplink on the 4-hour chart) and medium-term 1.2815 (EMA200 on the daily chart) support levels. The GBP / USD pair since early 2017 continues to rise in the uplink on the weekly chart. If the positive pound dynamics continues, then the GBP / USD pair will continue to rise with the targets of 1.3050 (May highs), 1.3100, 1.3210 (Fibonacci level of 23.6% correction to the GBP / USD decline in the wave, which began in July 2014 near the level of 1.7200 and The upper limit of the ascending channel on the daily chart). Through the level of 1.3210 also passes the upper limit of the rising channel on the weekly chart. Positive dynamics in the pair GBP / USD so far remains. Nevertheless, the OsMA and Stochastic indicators on the 4-hour, daily charts turned to short positions. An alternative scenario is to reduce the pair GBP / USD to support level 1.2815. In the case of breakdown of the support levels 1.2735 (EMA144 on the daily chart), 1.2640 (June lows and the lower limit of the uplink on the daily chart), the GBP / USD pair will accelerate towards targets near the 1.2550 level (the lower limit of the uplink on the weekly chart), 1.2365, 1.2110. Support levels: 1.2885, 1.2830, 1.2815, 1.2735, 1.2700, 1.2640, 1.2550, 1.2485, 1.2365, 1.2110 Resistance levels: 1.3050, 1.3100, 1.3210, 1.3300 Trading Scenarios Sell Stop 1.2910. Stop-Loss 1.2970. Take-Profit 1.2885, 1.2820, 1.2735, 1.2700, 1.2640, 1.2550, 1.2485 Buy Stop 1.2970. Stop-Loss 1.2910. Take-Profit 1.3050, 1.3100, 1.3210, 1.3300   *) For up-to-date and detailed analytics and news on the forex market visit Tifia company website tifia.com
|
|
#36
05-07-2017, 11:34
|
||||
|
||||
|
EUR/USD: on the eve of important events
05/07/2017 Current dynamics This week, investors will closely monitor the publication of a number of important macroeconomic data. In addition to waiting for news on the course of the two-day G-20 summit that will begin in Hamburg on Friday, market participants will also focus on the minutes of the meeting of the central banks of the United States and the Eurozone to determine the prospects for monetary policy. The minutes of the meetings will be published on Wednesday at 18:00 (GMT) (US Federal Reserve) and Thursday (11:30 GMT) (ECB). Today, there are new evidence of strengthening the economy of the Eurozone. So, in May, retail sales grew by 0.4% in the Eurozone (the forecast was + 0.3% and + 0.1% in April). The composite index of supply managers (PMI) in the services sector of the Eurozone increased to 55.4 in June (against the forecast of 54.7), the same index for the manufacturing sector increased to 56.3 in June (the forecast was 55.7). Values above 50 indicate an increase in activity. Similar indices rose in June also in countries with leading economies of the Eurozone (Germany, France, Italy). This was reported today by the Statistics Agency of the Eurozone in conjunction with Markit Economics. Nevertheless, the acceleration of economic growth has not yet led to a steady acceleration of inflation in the Eurozone, the target level of which is just below 2.0%. The growth of wages also remains weak. As ECB representative Peter Prat said yesterday during his speech in Rome, "our (ECB) task has not been fulfilled yet. We need to maintain patience and perseverance. We need to be patient, because it takes more time for inflation to be surely reflected in the data. " The euro almost did not react to the publication of positive data. The euro is falling against the dollar, as are other major currencies. And the strengthening of the dollar is observed for the third consecutive session, and in the pair EUR / USD - the fourth trading session. The dollar continues to recover in the foreign exchange market on the eve of today's publication of the protocol since the last meeting of the Fed and on Friday - data from the US labor market for June. *)An advanced fundamental analysis is available on the Tifia website at tifia.com/analytics Support and resistance levels The fourth day of the EUR / USD pair is declining. Indicators OsMA and Stochastics on the 1-hour, 4-hour, daily charts were deployed to short positions. The pair EUR / USD broke through the short-term support level 1.1330 (EMA200 on the 1-hour chart). The target of further decline will be support levels 1.1285 (Fibonacci level of 23.8% of corrective growth from the lows reached in February 2015 in the last wave of global decline of the pair from 1.3900 level), 1.1250 (EMA144 and the bottom line of the ascending channel on the 4-hour chart). The positive dynamics of the EUR / USD pair is generally maintained, while the pair is above the support level of 1.1210 (EMA200 on the 4-hour chart). In case of breakdown of support level 1.1210, the pair EUR / USD decline will accelerate with the target at support level 1.1120 (bottom line of the uplink on the daily chart and June lows). The breakdown of the key support level 1.0950 (EMA200 on the daily chart) will cancel the upward trend of the EUR / USD pair. Support levels: 1.1285, 1.1250, 1.1210, 1.1120, 1.0950 Levels of resistance: 1.1330, 1.1350, 1.1440, 1.1500, 1.1600, 1.1785 Trading Scenarios Sell in the market. Stop-Loss 1.1360. Take-Profit 1.1300, 1.1280, 1.1215, 1.1170, 1.1140 Buy Stop 1.1360. Stop-Loss 1.1310. Take-Profit 1.1400, 1.1440, 1.1500, 1.1600, 1.1785   *) For up-to-date and detailed analytics and news on the forex market visit Tifia company website tifia.com
|
|
#37
06-07-2017, 11:03
|
||||
|
||||
|
S&P500: in a busy trading day
06/07/2017 Overview and dynamics After the unstable and insignificant growth last month, US stock indices seem to change their direction of movement and unfold "to the south." Published yesterday, the minutes of the June meeting of the Federal Reserve confirmed the market expectations and intentions of the Fed on monetary policy in the US. The Fed, despite its weak inflation, plans to make another rate hike this year, as well as to start cutting its budget, which is estimated at about 4.5 trillion dollars by various estimates. Today at 11:30 (GMT) the minutes of the June meeting of the European Central Bank are published, which may cause increased interest of investors in connection with the latest comments of ECB representatives. The focus of the markets today will be the question of the ECB's intentions regarding the beginning of the reduction of the incentive program in the coming months. In recent days, investors have been focusing their attention on the comments of the leaders of the world's largest central banks. It seems that, amid the strengthening of the world economy, stimulating programs in countries with the largest economies may soon be curtailed. And this is a negative signal for world stock markets. Today is a busy trading day. In addition to publishing information about the ECB monetary policy meeting, the US trade statistics published in the US trading session are statistics on private sector employment from ADP for June, the trade balance for May, the weekly report on primary applications for unemployment benefits and business activity indices for June . Weak indicators of macroeconomic indicators will cause a decline in the dollar and US stock indices. Also at 14:00 (GMT), a member of the US Federal Open Market Committee, Jerome Powell, is expected to speak. It is likely that he will also support the Fed's actions towards a gradual tightening of monetary policy in the United States. *)An advanced fundamental analysis is available on the Tifia website at tifia.com/analytics Support and resistance levels With the opening of today's trading day and, especially, during the European trading session, the S&P500 index is actively declining. The price fell below the 2422.0 mark, corresponding to the closing price of the previous month. If the negative trend increases, then July will be the first month in which the S & P500 index will close in negative territory after an 8-month active growth. The index has already broken through an important short-term support level of 2421.0 (EMA200 on the 4-hour chart) and is aiming for the support level of 2413.0 (EMA50 and the bottom line of the uplink on the daily chart). If the negative trend is to increase, then the following goals of the S & P500 index decline will be support levels 2405.0, 2390.0, 2355.0, between which the lower line of the uplink on the weekly chart passes, 2320.0 (EMA200 on the daily chart), 2305.0 (Fibonacci level 23.6% correction to Growth since February 2016). The breakdown of support levels 2320.0, 2305.0 will cancel the bullish trend of the index. Indicators OsMA and Stochastics on the 4-hour, daily, weekly charts have already turned to short positions. While the price is above the level of 2413.0, we can speak of a downward correction of the index. Its positive dynamics is higher than this level. In case of resumption of growth and after the breakdown of resistance level 2452.0 (June and year highs), the growth of the index will resume. Support levels: 2413.0, 2405.0, 2390.0, 2355.0, 2320.0, 2305.0 Resistance levels: 2438.0, 2453.0 Trading Scenarios Sell in the market. Stop-Loss 2432.0. Objectives 2413.0, 2405.0, 2390.0, 2355.0, 2320.0, 2305.0 Buy Stop 2432.0. Stop-Loss 2417.0. Objectives 2438.0, 2450.0, 2500.00   *) For up-to-date and detailed analytics and news on the forex market visit Tifia company website tifia.com
|
|
#38
07-07-2017, 11:28
|
||||
|
||||
|
GBP/USD: The dollar is growing before the publication of NFP
07/07/2017 Overview and dynamics After the National Bureau of Statistics of Great Britain presented disappointing data on the foreign trade balance of Great Britain, and also on the level of industrial production for May, the pound declined in the foreign exchange market. Against the euro, the pound fell to the lowest level in nine days, and against the dollar - by 0.4% (by about 60 points), falling to the level of 1.2900. In view of the decline in manufacturing in the manufacturing industry, the decline in UK industrial production was 0.1% compared to the previous month (the forecast was + 0.3%). Published data indicate that in the second quarter of the country's economic growth remains weak. The deficit of foreign trade in Britain at the same time in May increased by almost a billion pounds to 11.9 billion pounds (from 10.6 billion pounds in April and against a forecast of 10.8 billion pounds). The sharp increase in inflation in the UK against the background of Brexit puts pressure on consumer spending, which over the past few years has been the engine of the UK economy's growth. Now, in order to level out the slowdown in the economy, it is necessary that production and trade grow at a faster rate. In fact, the reverse process occurs. In the 1st quarter of 2017, the UK economy grew 0.2% compared to the previous quarter against 0.7% in the fourth quarter of 2016, in the second quarter, the growth in the economy could slow even further and, according to some estimates, move to Negative territory. During his speech at the forum of the European Central Bank in Portugal in late June, the head of the Bank of England, Mark Carney, said that "partial refusal of stimulus measures is likely to be necessary, since the Bank of England will no longer have to compromise, and the decision-making process will enter in the usual course". Now, after the release of weak macro data on the hawk positions in the Bank of England suffered a tangible blow. Apparently, disappointing economic data can give the monetary authorities of the UK an opportunity to seriously not think about raising the interest rate, but to stimulate the economy. In any case, the Brexit process will have a negative impact on the economy of the country for a long time. And with any corrective growth in the British currency, there are many investors who will want to sell it, especially after the release of another negative portion of the British macro statistics. Today, investors' attention is focused on the G20 summit, which began in Hamburg, at a meeting of the Russian and US presidents, which is scheduled to begin at 17:00 local time, as well as publication at 12:30 (GMT) of data from the labor market in the United States. Strong performance is expected. The growth of employment in the non-agricultural sector of the US economy in June was, according to economists, 179,000 new jobs, which is 41,000 higher than the previous index, unemployment in June remained at the same level of 4.3%, and the average hourly earnings rose by 0.3% %. If the forecast is confirmed, the dollar will grow in the foreign exchange market. In any case, when making trading decisions, it is necessary to take into account that when these indicators are published, a surge in volatility is expected in the trades throughout the financial market, including GBP / USD. *)An advanced fundamental analysis is available on the Tifia website at tifia.com/analytics Support and resistance levels After the publication of macro data for the UK, the GBP / USD pair broke through the short-term support level of 1.2910 (EMA200 at 1-hour) and continues to decline to support level 1.2850 (EMA200 on the 4-hour chart). Indicators OsMA and Stochastics on the 1-hour, 4-hour, daily charts turned to short positions, signaling the continuation of the downward correction. The next important goal of the pair GBP / USD decline is the level of 1.2810 (EMA200 on the daily chart). In the case of the breakdown of the support level 1.2745 (EMA144 on the daily chart), the GBP / USD decline will accelerate to targets near the levels of 1.2590 (June lows), 1.2550 (the lower limit of the uplink on the weekly chart), 1.2365, 1.2110. If the positive pound dynamics continues, then the GBP / USD pair will resume growth with the targets of 1.3050 (May highs), 1.3100, 1.3210 (Fibonacci level 23.6% correction to the pair GBP / USD decline in the wave, which began in July 2014 near the level of 1.7200 And the upper limit of the ascending channel on the weekly chart). Support levels: 1.2850, 1.2810, 1.2745, 1.2700, 1.2640, 1.2590, 1.2550, 1.2365, 1.2110 Resistance levels: 1.2980, 1.3050, 1.3100, 1.3210, 1.3300 Trading Scenarios Sell Stop 1.2880. Stop-Loss 1.2930. Take-Profit 1.2820, 1.2735, 1.2700, 1.2640, 1.2550, 1.2485 Buy Stop 1.2930. Stop-Loss 1.2880. Take-Profit 1.2980, 1.3050, 1.3100, 1.3210, 1.3300   *) For up-to-date and detailed analytics and news on the forex market visit Tifia company website tifia.com
|
|
#39
10-07-2017, 11:03
|
||||
|
||||
|
Brent: pressure on oil prices persists
10/07/2017 Current dynamics After some decline during the Asian session, the dollar today resumed its growth. Ambiguous data on the US labor market for June, published on Friday, caused a surge in volatility in the foreign exchange market. And yet, despite the fact that unemployment rose in June from 4.3% to 4.4%, and the average hourly earnings in the US for June was 0.2% (the forecast was 0.3%), in general, the data On the labor market in the US can be called strong. The NFP indicator in June was 225,000 (against the forecast of 179,000). The dollar strengthens in the foreign exchange market, and oil prices decline. Additional pressure on oil prices had an increase in oil production in the US last week. According to the Energy Information Administration of the country, oil production in the US last week increased to 9.33 million barrels per day from 9.25 million barrels a day a week earlier. Oil production at the same time exceeded the level of the previous year by almost 11% and returned to its 10-month maximum. Published on Friday, data from the oil service company Baker Hughes, also indicated an increase in drilling activity in the industry. So, the number of oil drilling rigs in the US increased last week by seven units to 763 units, which is more than 2.1 times higher than a year ago. Against the backdrop of a sharp increase in oil production in the US, which alleviates OPEC's efforts to stabilize the balance in the oil market, OPEC is considering setting restrictions on oil production in Nigeria and Libya. But, at the same time, Saudi Arabia plans to spend $ 300 billion on oil and gas projects in the next 10 years, the head of Aramco said today. Last week, by the way, Saudi Arabia reported that it reduces official oil prices for Asia. Despite the agreements to limit oil production, the struggle for its share in the oil market does not stop. Especially, after the US begins to fill successfully the vacant niches in the oil market with a growing supply of US shale oil. World oil production is still high, oil reserves remain at historical highs, but the demand for oil is not growing. Most likely, oil prices will continue to decline in the short term. The next weekly official data on oil reserves in the US will be released on Wednesday (14:30 GMT). If the data indicates an increase in inventories, then this will have additional pressure on oil prices. *)An advanced fundamental analysis is available on the Tifia website at tifia.com/analytics Support and resistance levels The price for Brent crude oil was down 2.8% on Friday, coming close to $ 46.30 per barrel. At the beginning of today's European session, the price for Brent crude is again traded near this mark, remaining under pressure. Last week, the price could not develop an upward movement above resistance level 49.60 (EMA50 and the upper limit of the descending channel on the daily chart). Over the last 3 trading sessions, the price has lost more than 7%, and having broken short-term support levels of 48.50 (EMA200 on the 4-hour chart), 47.80 (EMA200 on the 1-hour chart), continues to decline in the downlink on the daily chart with immediate targets at levels Support 46.20 (Fibonacci level 50% correction to the decline from the level of 65.30 from June 2015 to the absolute minimums of 2016 near the mark of 27.00), 44.50 (lows of the year). The more distant target is the level 41.70 (the Fibonacci level of 38.2% and the lower boundary of the descending channel). Strengthening the foreign exchange market dollar also contributes to lower commodity prices and oil prices. Only if the price is restored above the level of 48.50 can you consider the long positions again. The trend again changed to negative, and negative moods continue to dominate the oil market. Support levels: 46.20, 45.50, 44.50, 41.70 Resistance levels: 47.80, 48.50, 48.80, 49.60, 50.70, 51.00 Trading Scenarios Sell Stop 46.25. Stop-Loss 46.88. Take-Profit 46.00, 45.50, 44.50, 43.50, 41.70 Buy Stop 46.88. Stop-Loss 46.25. Take-Profit 47.25, 47.80, 48.50, 49.60, 50.00, 50.70, 51.00   *) For up-to-date and detailed analytics and news on the forex market visit Tifia company website tifia.com
|
|
#40
11-07-2017, 11:11
|
||||
|
||||
|
AUD/USD: in July - in negative territory
11/07/2017 Current dynamics Despite the growth of the third trading session in a row, the pair AUD / USD has been trading on negative territory since the beginning of the month. As you know, last week the Reserve Bank of Australia left the interest rate unchanged at 1.50%, which has been at this level since August of last year. RBA Governor Philip Lowe held to neutral rhetoric, saying that the growth rate of wages remains low and "probably will be so for some time". At the same time, the US dollar keeps the positions won earlier in the foreign exchange market. A number of positive macroeconomic data received from the US last week indicates a stable recovery of the economy and the labor market in the United States. The number of new jobs in the non-agricultural sector in June grew by 222,000 in the US (the forecast was +174,000 new jobs). The estimates for May and April are also revised upwards. The index of supply managers (PMI) for the US service sector in June, according to the Institute of Supply Management (ISM), was 57.4 compared to 56.9 in May. The service sector accounts for the largest part of US GDP, and the fact that in June the growth of business activity accelerated in this area, indicates a positive momentum for growth in the US economy. This week, market participants will closely follow the statement (on Wednesday 10:00 (GMT) and on Thursday 14:00 (GMT)) of the chairman of the Federal Reserve, Janet Yellen. If, in her report to Congress, she confirms the Fed's intention to adhere to the planned tightening of monetary policy, the strengthening of the US dollar will continue. Today, another representative of the Fed, Fed President San Francisco Williams, said that the pace of growth in wages and inflation in the US coincide with his predictions, and another increase in rates still fits into a "reasonable baseline scenario". While the RBA says that "the strengthening of the Australian dollar will complicate the adjustment of the economy," and "the continuation of rates unchanged corresponds to the goals of GDP, inflation" in Australia, the Fed systematically tightens monetary policy in the US. The difference between the monetary policy of the Fed and the RBA will be an important fundamental factor that stimulates the sale of the AUD / USD pair. *)An advanced fundamental analysis is available on the Tifia website at tifia.com/analytics Support and resistance levels In general, the positive dynamics of the AUD / USD pair persists while it is trading above the key support level of 0.7530 (EMA200, EMA144 on the daily chart). At the moment, the pair AUD / USD is trading on the short-term balance line 0.7608 (EMA200 on the 1-hour chart) and is trying to develop positive dynamics within the short-term upward channels on 1-hour and 4-hour charts. Only in case of breakdown of short-term support levels of 0.7585 (EMA144 and the bottom line of the uplink on the 4-hour chart), 0.7570 (EMA200 on the 4-hour chart) can we speak of the predominance of the downside dynamics of the AUD / USD pair. The fastening above the local resistance level 0.7635 will create prerequisites for the further growth of the AUD / USD pair. In case of the development of the downward dynamics and breakdown of the key support level 0.7530 (EMA200, EMA144 on the daily chart), the bearish trend will again prevail in the dynamics of the AUD / USD pair. In this case, the targets will be the levels of 0.7460 (the Fibonacci level is 23.6% of the correction to the wave of decline in the pair since July 2014, the minimum wave is near 0.6830), 0.7420, 0.7375, 0.7330 (November and May lows). Support levels: 0.7608, 0.7585, 0.7570, 0.7530, 0.7500, 0.7460, 0.7420, 0.7375, 0.7330 Resistance levels: 0.7635, 0.7710, 0.7780, 0.7840 Trading Scenarios Sell Stop 0.7590. Stop-Loss 0.7630. Take-Profit 0.7570, 0.7525, 0.7460, 0.7445, 0.7420, 0.7375, 0.7330 Buy Stop 0.7630. Stop-Loss 0.7590. Take-Profit 0.7640, 0.7710, 0.7780, 0.7840   *) For up-to-date and detailed analytics and news on the forex market visit Tifia company website tifia.com
|
|
|
|
 Similar Threads
|
||||
| Thread | Thread Starter | Forum | Replies | Last Post |
| Tifia Daily Market Analytics | TifiaFX | Forex Analysis | 0 | 22-03-2017 14:17 |
| Tifia Daily Market Analytics | TifiaFX | Forex Analysis | 0 | 16-03-2017 14:48 |
| Tifia Daily Market Analytics | TifiaFX | Forex Analysis | 0 | 14-03-2017 09:52 |
| Daily Market Analysis by FxGrow | FxGrow10 | Forex Analysis | 0 | 06-05-2015 01:03 |
| Daily Market update by UWC | effexx | Trading Journals | 156 | 01-03-2012 10:40 |


