Forex Forums | ForexLasers.com |
|
|||||||
 |
|
|
LinkBack | Thread Tools | Search this Thread |
|
#1241
 30-03-2021, 07:44
|
|||
|
|||
|
XAU/USD: active downtrend
Current trend Gold prices show active downtrend during today's Asian session, developing a "bearish" momentum formed yesterday. On Monday, quotations of the asset fell by more than 1%, responding to the further strengthening of USD, as well as amid expectations of a further recovery in the global economy. The development of the downtrend for the instrument was also facilitated by technical factors of profit fixation at the end of the month. At the same time, investors are cautious against the backdrop of an extremely alarming epidemiological situation in Europe. The largest economies in the region (Germany and France) are close to another tightening of restrictive measures, as the incidence rate is growing rapidly. All this is taking place against the background of low rates of vaccination of the population, as many European countries have suspended the use of the drug from AstraZeneca due to reports that it can cause thrombosis. Support and resistance On the D1 chart Bollinger Bands are reversing downwards. The price range is expanding; however, it fails to catch the surge of the "bearish" sentiment at the moment. MACD reversed into a descending plane, having formed new sell signal (located below the signal line). Stochastic keeps a confident downward direction but is already approaching its lows, which indicates the risks of oversold instrument in the ultra-short term. Existing short positions should be kept until technical indicators are clarified. Resistance levels: 1720.00, 1741.02, 1753.57, 1769.59. Support levels: 1703.07, 1687.15, 1675.00, 1660.15. 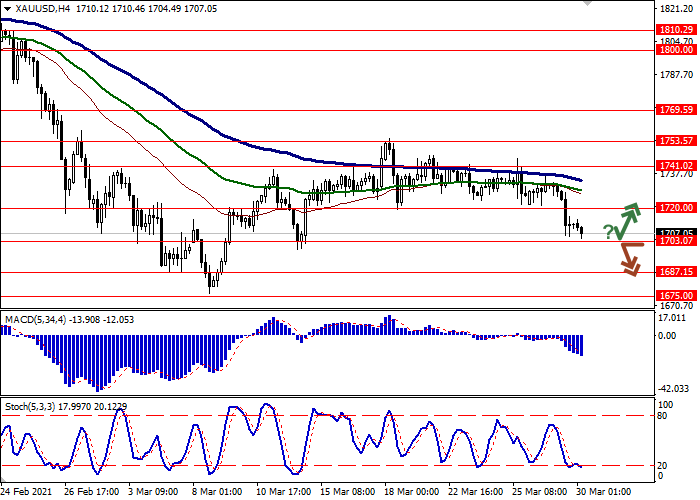 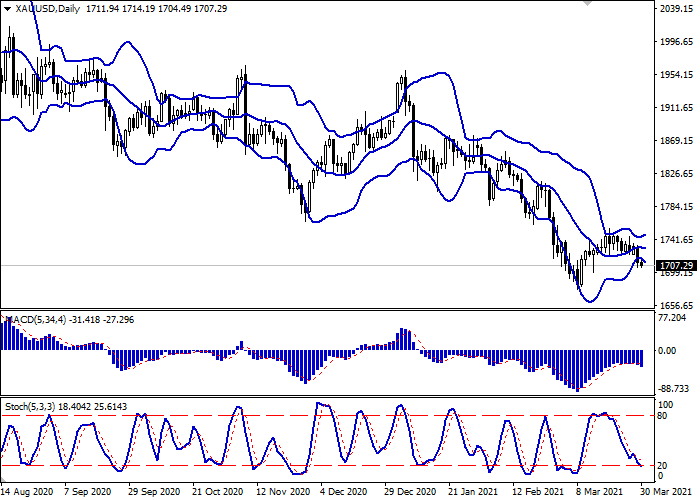

|
|
#1242
31-03-2021, 07:59
|
|||
|
|||
|
GBP/USD: downward trend
Current trend GBP is declining against USD in trading this morning session, developing a "bearish" momentum formed at the beginning of this week. Investors are actively buying USD amid growing yields on US bonds and are responding positively to the pace of vaccination, which allows them to hope that most of the quarantine restrictions will be lifted soon. However, given the current crisis in the incidence rate in Europe, not all analysts are so optimistic. There is an opinion that a too fast economic recovery and the abandonment of most of the restrictive measures could lead the USA to a third wave of coronavirus, which judging by European indicators will not be weaker than the first two. The same can be said about the UK, where the rate of vaccination of the population is one of the highest to date. Today, investors are focused on the updated statistics on the UK GDP for Q4 2020, as well as the March data on Nationwide Housing Prices. Support and resistance Bollinger Bands in D1 chart demonstrate a stable decrease. The price range is almost unchanged, but it remains rather spacious for the current level of activity in the market. MACD is declining keeping a weak sell signal (located below the signal line). Stochastic is reversing downwards again after a brief increase last week. The current showings of the indicator do not contradict the further development of the downtrend in the ultra-short term. Resistance levels: 1.3760, 1.3800, 1.3857, 1.3924. Support levels: 1.3700, 1.3650, 1.3600. 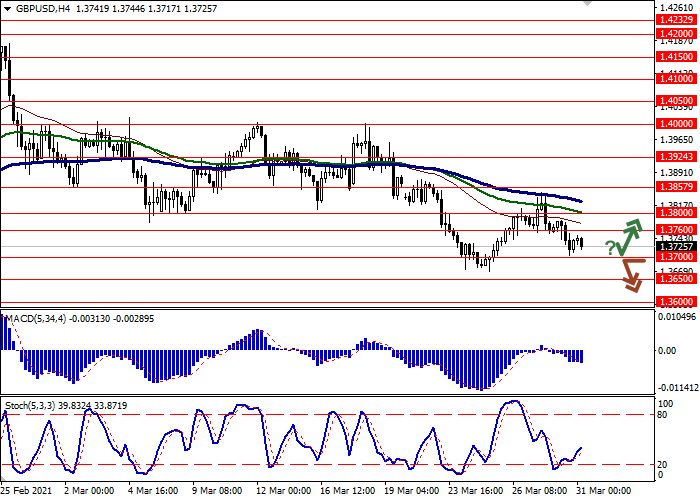 
|
|
#1243
01-04-2021, 07:37
|
|||
|
|||
|
USD/CHF: updating record highs
Current trend USD has shown moderate gains against CHF during today's Asian trading session, updating record highs since mid-July 2020. Market activity is gradually declining, given the upcoming Easter holidays, but investors are awaiting the publication of the US labor market report for March, which will take place on Friday. Market forecasts suggest a marked increase in the number of new jobs created by the US economy outside the agricultural sector. The unemployment rate may also decline and reach 6%. Today the focus of investors will be on the statistics on business activity in the US and Switzerland in March, which will help assess the prospects for economic recovery. Support and resistance Bollinger Bands in D1 chart show stable growth. The price range expands, freeing a path to new record highs for the "bulls". MACD indicator is growing preserving a weak buy signal (located above the signal line). Stochastic is still in close proximity to its highs, signaling strongly overbought USD in the ultra-short term. To open new positions, it is necessary to wait for the trade signals to become clear. Resistance levels: 0.9466, 0.9500, 0.9540. Support levels: 0.9417, 0.9350, 0.9300, 0.9250. 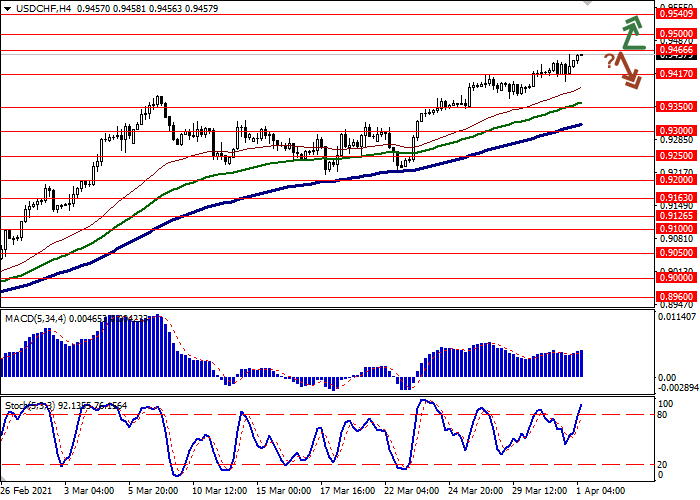 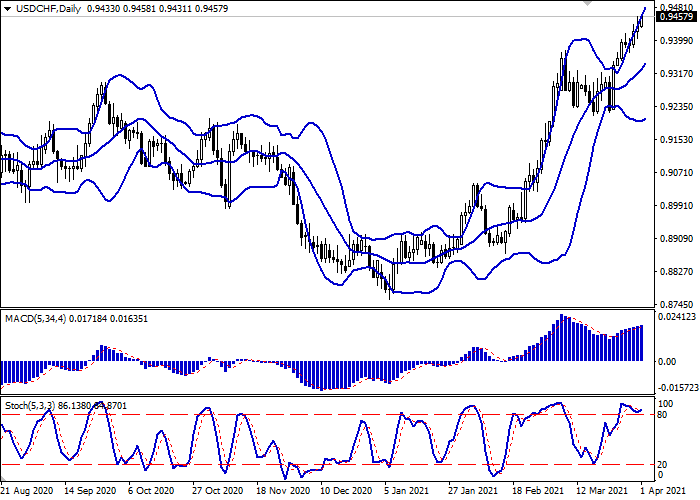
|
|
#1244
02-04-2021, 07:54
|
|||
|
|||
|
GBP/USD: updating weekly highs
Current trend GBP is marginally strengthening against USD in today's morning session, ending the week at new local highs since March 23. Market activity remains rather low due to the Easter holidays. Investors' interest is fueled only by the forthcoming publication of data on the US labor market for March. After an impressive report on private sector employment from ADP, investor optimism increased markedly, although the overall picture was smoothed by statistics on jobless claims. The number of initial jobless claims for the week ending March 26 increased from 658K to 719K, which turned out to be worse than the market forecasts of growth to 680K. The number of continuing jobless claims for the week ending March 19 decreased from 3.84M to 3.794M, while forecasts assumed a decrease in the indicator to 3.775M. GBP positions on Thursday were supported by positive macroeconomic statistics on business activity in the UK manufacturing sector. Markit Manufacturing PMI rose from 57.9 to 58.9 points in March, which turned out to be better than the neutral forecasts of analysts. Support and resistance In the D1 chart, Bollinger Bands are reversing horizontally. The price range is narrowing from above, reflecting the emergence of ambiguous dynamics in the short term. MACD indicator is growing preserving a rather stable buy signal (located above the signal line). Stochastic keeps its upward direction but is rapidly approaching its highs, which reflects the risks of overbought GBP in the ultra-short term. Resistance levels: 1.3857, 1.3924, 1.4000, 1.4050. Support levels: 1.3800, 1.3760, 1.3700, 1.3650. 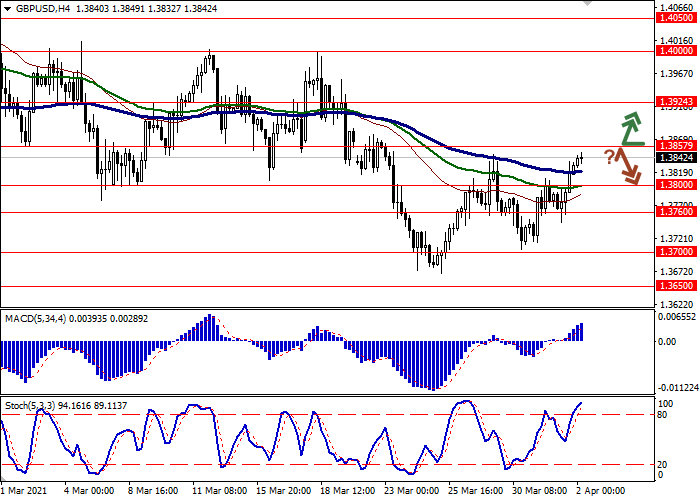 
|
|
#1245
05-04-2021, 08:18
|
|||
|
|||
|
USD/JPY: rising incidence of COVID-19 in Japan hurts the yen
Current trend The USD/JPY pair actively strengthens, trading at the level of 110.65. The weakening of the yen is due to the epidemiological situation. According to the Japanese Ministry of Health, the number of people infected with new strains of coronavirus is growing rapidly, and carriers of the British and African strains are already present in 34 out of 47 prefectures. Also, the first cases of detection of the Brazilian strain are reported. The government has not yet taken any steps regarding the new quarantine, as the country is undergoing pre-Olympic events that, if introduced, would be in jeopardy. The US currency is holding at Friday's close levels, with little reaction to the news that the production of the AstraZeneca vaccine at the Baltimore plant has stopped. It was stopped by a personal decree of US President Joe Biden after 15M doses of the vaccine were spoiled at the plant due to a technological error in the manufacturing process. Earlier, the chief infectious disease specialist Anthony Fauci has already stated that the United States did not need a vaccine from this manufacturer, and soon its use might stop at all. Support and resistance The instrument moves within an uptrend and may rise again after a short-term correction. Technical indicators maintain a global buy signal. Alligator indicators EMA fluctuations range is quite wide, and the histogram of the AO oscillator moves in the positive zone. Resistance levels: 110.90. Support levels: 110.30, 109.30. 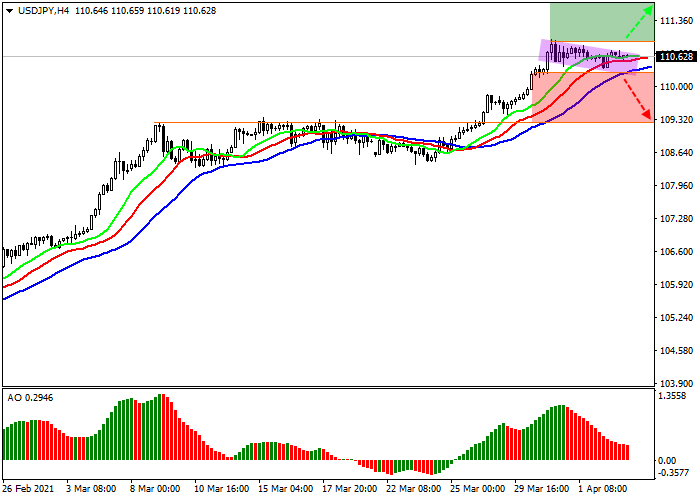
|
|
#1246
06-04-2021, 08:04
|
|||
|
|||
|
WTI Crude Oil: active decline amid OPEC+ decision
Current trend The price of North American light oil, WTI Crude Oil, is moving within a corrective trend, trading at 59.30. The instrument began to actively decline in response to Thursdays news, when the OPEC+ members decided not to cut production further but, on the contrary, to increase its volumes. The plan, which was being prepared for January, was decided to be implemented now, and thus, energy production in May-June will increase by 350K barrels per knock, and in July by 441K barrels. Also, Saudi Arabia decided to abandon its project to reduce the oil production, returning to a gradual increase in production volumes, which will rise by 250K in May, by 350K in June, and by 400K barrels per day in July. The decline in the rate began only now, as on Friday world exchanges were closed due to the holidays, and full-fledged trading started only yesterday. Thus, the likelihood of further weakening remains quite high, despite the current drop in sales volumes. Support and resistance Locally, the price decreases within the local sideways channel, trading near the support line. Technical indicators are in the state of a sell signal. Alligator indicators EMA fluctuations range is directed downward, and the histogram of the AO oscillator is in the sell zone. Resistance levels: 61.60, 66.30. Support levels: 57.30, 52.50. 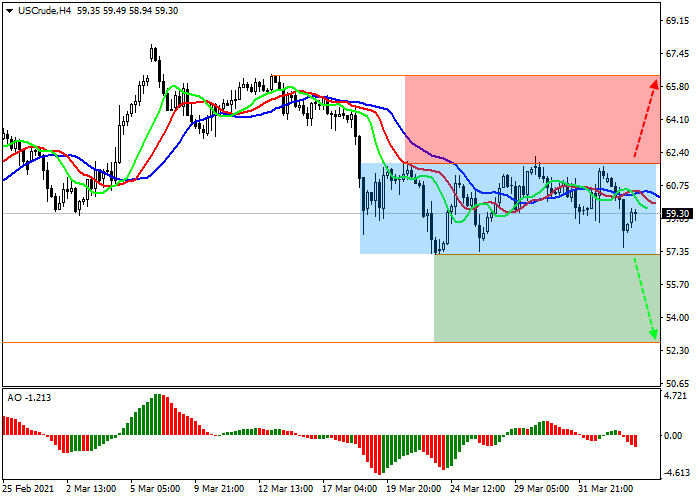
|
|
#1247
07-04-2021, 05:59
|
|||
|
|||
|
JP Morgan Chase Co.: wave analysis
The price may grow. On the daily chart, the fifth wave of the higher level (5) forms, within which the wave 3 of (5) develops. Now, the third wave of the lower level iii of 3 has formed, and a local correction is ending to develop as the fourth wave iv of 3. If the assumption is correct, after the end of the correction, the price will grow to the levels of 165.00170.00. In this scenario, critical stop loss level is 145.53. 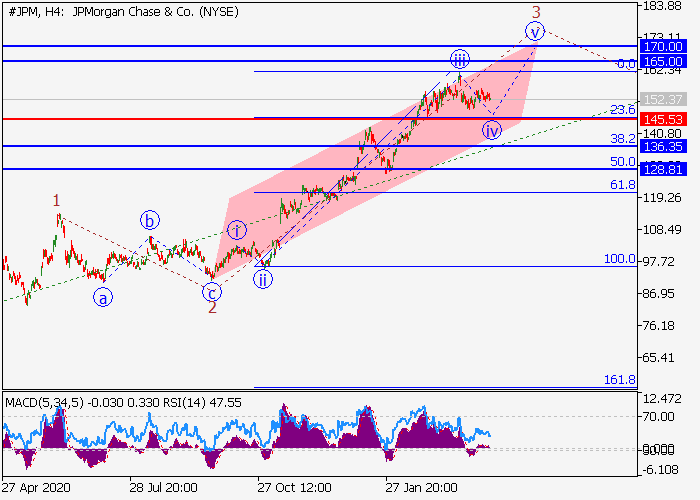 
|
|
#1248
08-04-2021, 07:20
|
|||
|
|||
|
American Express Co.: wave analysis
The price may grow. On the daily chart, the fifth wave of the higher level (5) develops, within which the wave 1 of (5) formed, and the correction 2 of (5) ended. Now, the third wave 3 of (5) is developing, within which the local correction iv of 3 has developed, and the formation of the wave v of 3 has started. If the assumption is correct, the price will grow to the levels of 160.00170.00. In this scenario, critical stop loss level is 134.73. 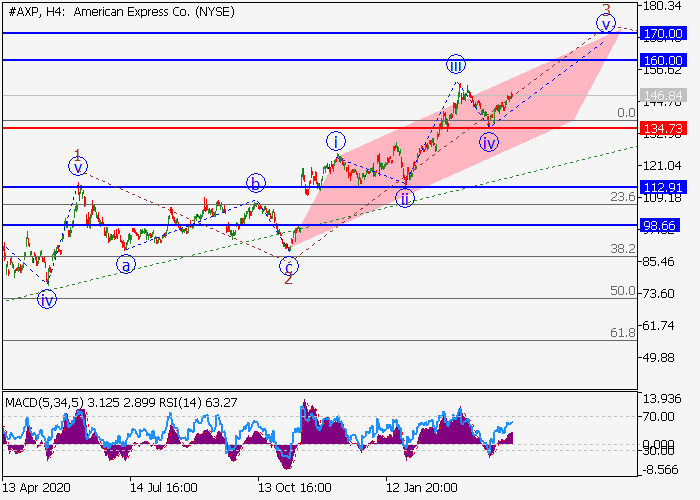 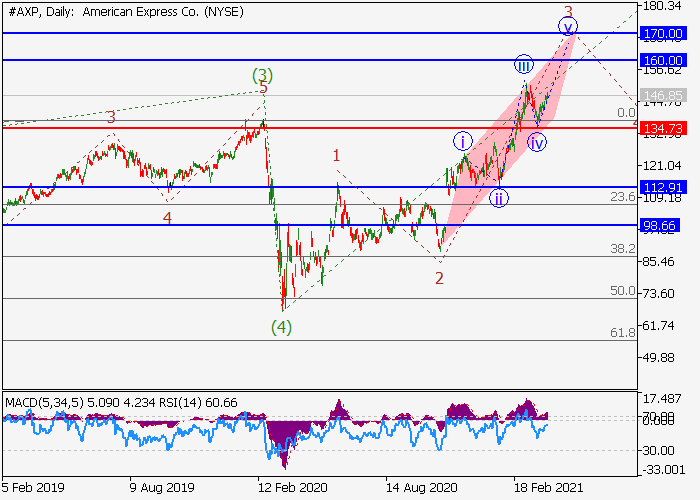
|
|
#1249
09-04-2021, 05:33
|
|||
|
|||
|
XAU/USD: wave analysis
The pair may grow. On the daily chart, the third wave of the higher level (3) formed, and a downward correction developed as the fourth wave (4). Now, the formation of the fifth wave (5) has started, within which the first wave of the lower level 1 of (5) is developing. If the assumption is correct, the pair will grow to the levels of 1877.851959.38. In this scenario, critical stop loss level is 1676.66. 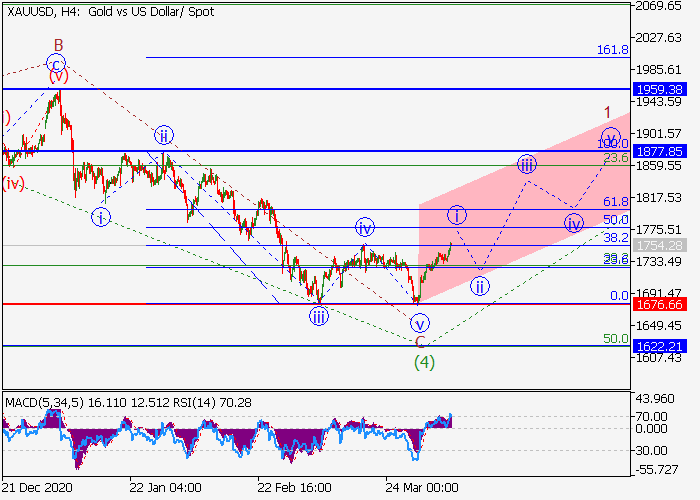 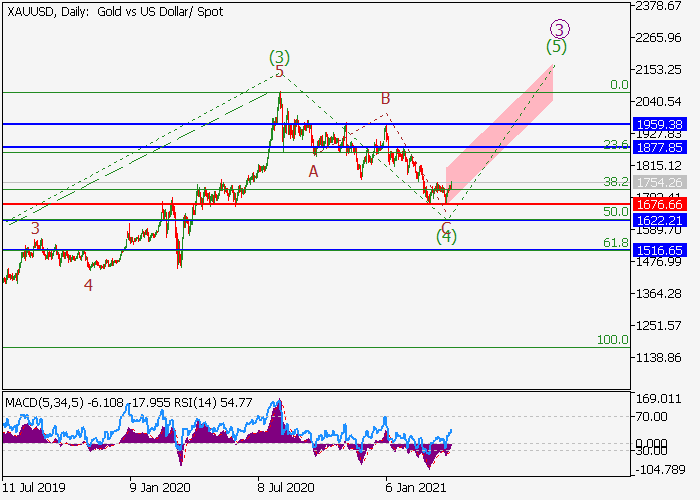
|
|
#1250
12-04-2021, 07:14
|
|||
|
|||
|
WTI Crude Oil: wave analysis
The price is in a correction, a fall is possible. On the daily chart, a downward correction of the higher level developed as the wave B, and the upward wave C forms, within which the first wave 1 of (1) of C develops. Now, the third wave of the lower level iii of 1 has formed, and a local correction is developing as the wave iv of 1, within which the wave (a) of iv has formed, and the wave (b) of iv is developing. If the assumption is correct, after the end of the correction, the price will fall to the levels of 54.6950.66. In this scenario, critical stop loss level is 63.68. 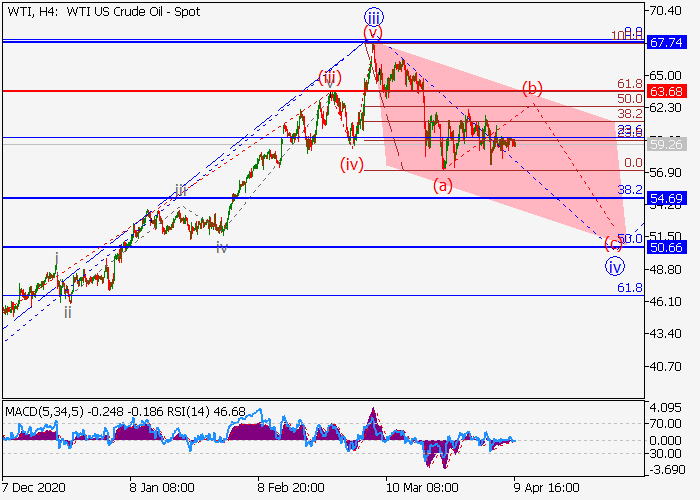 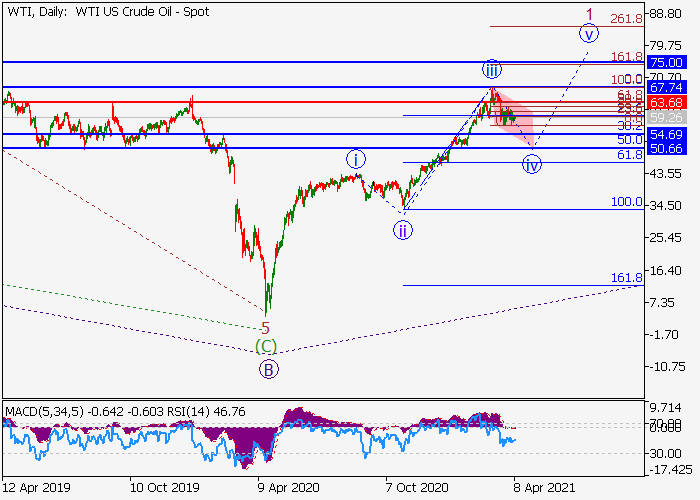
|
|
#1251
13-04-2021, 07:49
|
|||
|
|||
|
USD/CAD: "bullish" trend development
Current trend USD is showing moderate growth against CAD, developing a "bullish" signal, formed the day before, when the instrument retreated from its local lows. Moderate support for USD is provided by the continuing growth in the yield of US Treasury bonds, coupled with the general positive sentiment of investors regarding the prospects for the recovery of the American economy. Only statistics on inflation distorts the overall picture. In turn, CAD is still supported by a strong report on the Canadian labor market for March published last Friday and reflecting a sharp decline in the unemployment rate in the country from 8.2% to 7.5%, which turned out to be significantly better than market expectations of 8%. The employment change in Canada in March also rose sharply by 303.1K, outstripping the growth rate of the previous month at the level of 259.2K. Market forecasts assumed an increase of only 100K. Support and resistance In the D1 chart, Bollinger Bands are reversing horizontally. The price range does not change, outlining the approximate boundaries of the short-term flat. MACD indicator is growing, maintaining a weak buy signal (the histogram is above the signal line). Stochastic, after a short decline at the end of last week, is trying to reverse upwards, reflecting the growing buying activity in the ultra- short term. The development of uptrend is possible in the near future. Resistance levels: 1.2600, 1.2650, 1.2700. Support levels: 1.2554, 1.2500, 1.2439, 1.2400. Больше аналитики в блоге компании: https://ru.lite.forex/blog/analysts-opinions/ 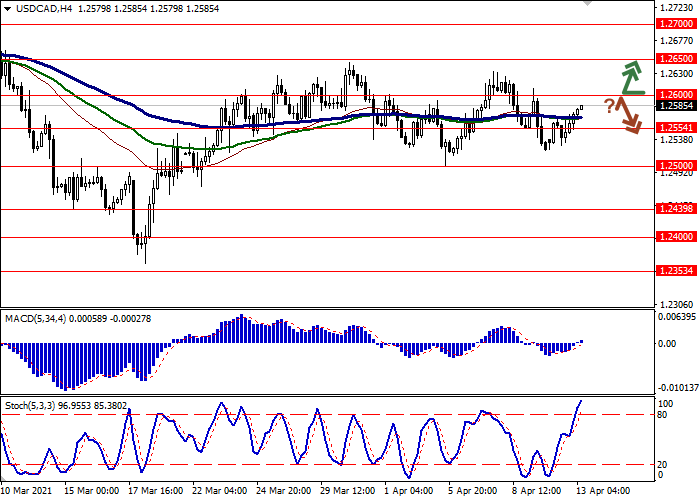 
|
|
#1252
14-04-2021, 07:02
|
|||
|
|||
|
NZD/USD: updating local highs
Current trend NZD is showing active gains against USD in todays Asian trading, building on the weak "bullish" momentum it had formed the day before. The pair adds about 0.50% and is about to test the level of 0.7100 for a breakout. In addition to the weak positions of USD, the decision of the Reserve Bank of New Zealand (RBNZ) on the interest rate provides moderate support to NZD. As expected, the regulator did not change the parameters of monetary policy, maintaining the key interest rate at 0.25%. In the follow-up statement, the RBNZ Monetary Policy Committee noted the continued uncertainty in the global economy amid still strong epidemiological risks and existing restrictions on tourism and supply. At the same time, the regulator is very optimistic and its current forecasts for the development of economic activity in the country are not inferior to the February estimates. Support and resistance On the D1 chart Bollinger Bands are reversing into the ascending plane. The price range is expanding but it fails to conform to the surge of "bullish" activity at the moment. MACD indicator is growing preserving a stable buy signal (located above the signal line). Stochastic is showing similar dynamics; however, the indicator line is rapidly approaching its highs, indicating the risks of overbought NZD in the ultra-short term. Existing long positions should be kept until technical indicators are clarified. Resistance levels: 0.7100, 0.7150, 0.7200, 0.7250. Support levels: 0.7050, 0.7000, 0.6954, 0.6913. 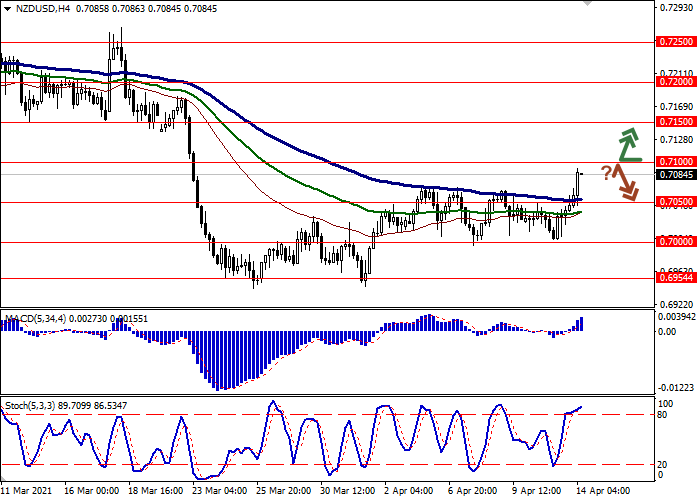 
|
|
#1253
15-04-2021, 08:40
|
|||
|
|||
|
EUR/USD: vaccination in the EU is again in jeopardy
Current trend EUR is strengthening against USD, trading at 1.1974, but the positive dynamics is mainly facilitated by weak USD. Vaccination problems continue in the EU. Following the AstraZeneca Plc., whose supply of the drug was disrupted, and some countries in the eurozone completely limited its use, it became known that the use of the Janssen vaccine from Johnson & Johnson Co. was also temporarily suspended because of the recently identified danger of thrombosis development. The European Medicines Agency is currently conducting analysis of the submitted samples, but there is no official conclusion yet, so a large batch of Janssen was sent to warehouses. USD continues to decline. The Chair of the US Fed, Jerome Powell, said yesterday that the regulator is considering the possibility of reducing the volume of purchases of government bonds, which is now USD 120B per month, and this will not be related to the course of monetary policy. In other words, the department will reduce purchases of bonds, but at the same time the key interest rate will remain unchanged. Investors were disappointed with this announcement, as the previous rise in USD was associated with hopes for a rate hike. Support and resistance On the global chart of the asset, the price continues trading within a wide descending channel. Technical indicators reversed and issued a buy signal. The fast Alligator indicator EMAs crossed the signal line from below, and the histogram of the AO oscillator moved to the purchase area. Resistance levels: 1.2035, 1.2325. Support levels: 1.1899, 1.1710. 
|
|
#1254
16-04-2021, 07:29
|
|||
|
|||
|
NZD/USD: NZD loses "bullish" momentum
Current trend NZD is showing ambiguous dynamics during today's Asian session, consolidating near its local highs since March 22. The instrument is under pressure from technical factors, as in the last three trading sessions NZD has shown strong growth. Some support for the pair on Friday was provided by upbeat macroeconomic data from New Zealand and China. Business NZ PMI in March soared from 53.4 to 63.6 points, which turned out to be much better than the negative forecasts of a decline to 51.3 points. China supported the positive sentiment in the market, showing GDP growth in Q1 2021 by an impressive 18.3% YoY after increasing by 6.5% YoY in the previous quarter. However, forecasts assumed an increase of 18.9% YoY. On a quarterly basis, the Chinese economy continues to slow down: in Q1 2021, GDP grew by only 0.6% QoQ, with the forecast of an increase of 1.5% QoQ. Support and resistance Bollinger Bands in D1 chart show stable growth. The price range is expanding but it fails to conform to the development of "bullish" sentiments at the moment. MACD indicator is growing keeping a strong buy signal (located above the signal line). Stochastic has reached its highs and currently indicates the risks of a corrective decline in the ultra-short term. Resistance levels: 0.7200, 0.7250, 0.7305. Support levels: 0.7150, 0.7100, 0.7050, 0.7000.  
|
|
#1255
19-04-2021, 07:31
|
|||
|
|||
|
USD/JPY: USD demonstrates downtrend
Current trend USD is declining against JPY this morning session, developing a fairly strong "bearish" trend in the short term and renewing local lows since March 24. USD expects the emergence of new drivers in the market, but for now it remains under the pressure of the declining yields of Treasury bonds. In turn, JPY is getting some support after the release of macroeconomic statistics from Japan on Monday. Japanese Exports went up by 16.1% YoY in March after the decline by 4.5% YoY in the previous month. Analysts had expected growth by 11.6% YoY only. Imports for the same period rose by 5.7% YoY, which turned out to be better than projected by 1.0%, but noticeably weaker than the dynamics of the previous month at the level of 11.8% YoY. Merchandise Trade Balance Total in March increased from JPY 215.9B to JPY 663.7B. Analysts predicted trade balance at JPY 490B. Support and resistance Bollinger Bands in D1 chart demonstrate active decrease. The price range narrows slightly from above, but still remains spacious enough for the current level of market activity. MACD is going down preserving a stable sell signal (located below the signal line). The indicator is about to test the zero level for a breakdown. Stochastic, having reached the zero level, reversed into a horizontal plane, signaling the risks of oversold USD in the ultra-short term. Resistance levels: 109.00, 109.37, 109.84, 110.23. Support levels: 108.54, 108.15, 107.78, 107.42. 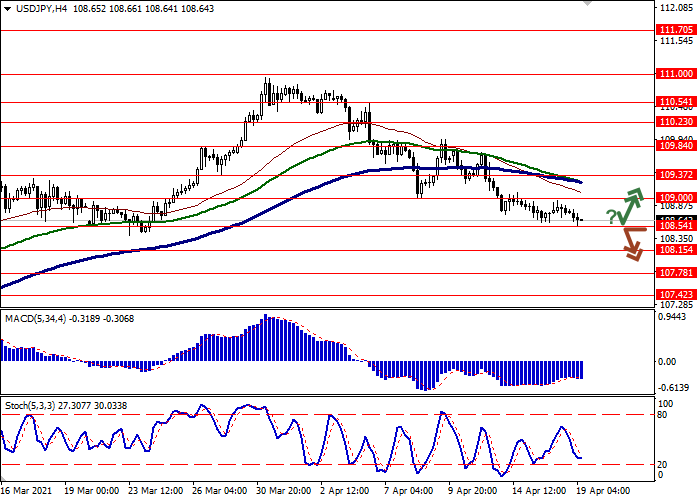 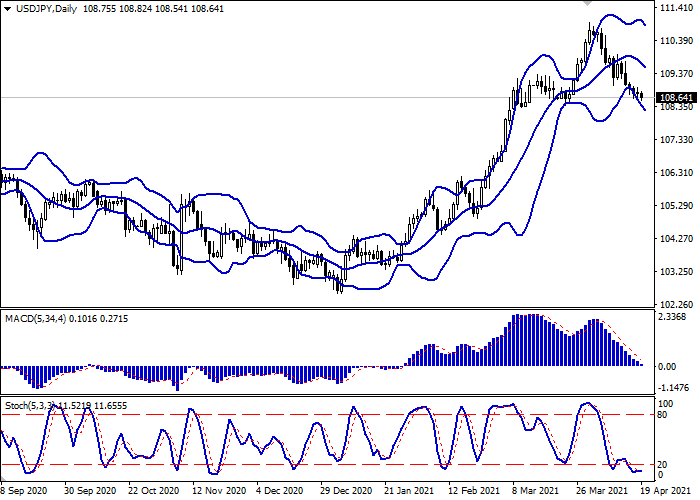
|
|
#1256
20-04-2021, 06:17
|
|||
|
|||
|
PayPal Holdings Inc.: wave analysis
The price may grow. On the daily chart, the third wave of the higher level (3) develops, within which the wave 3 of (3) formed. Now, a downward correction has developed as the wave 4 of (3), and the development of the wave 5 of (3) has started, within which the wave iii of 5 of the lower level is forming. If the assumption is correct, the price will grow to the levels of 330.00357.90. In this scenario, critical stop loss level is 226.40. 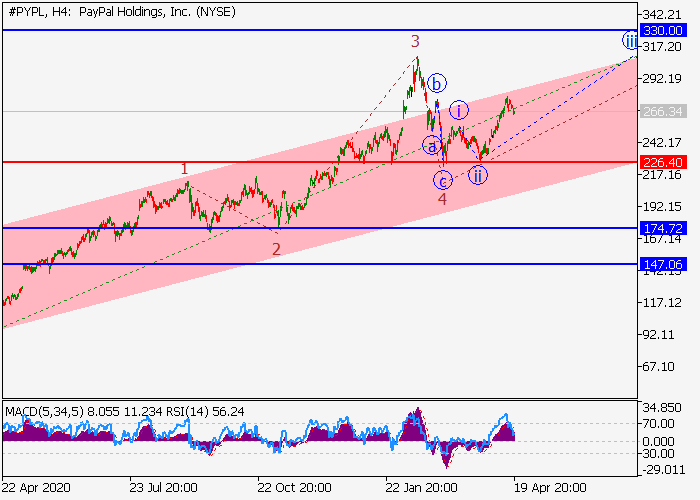 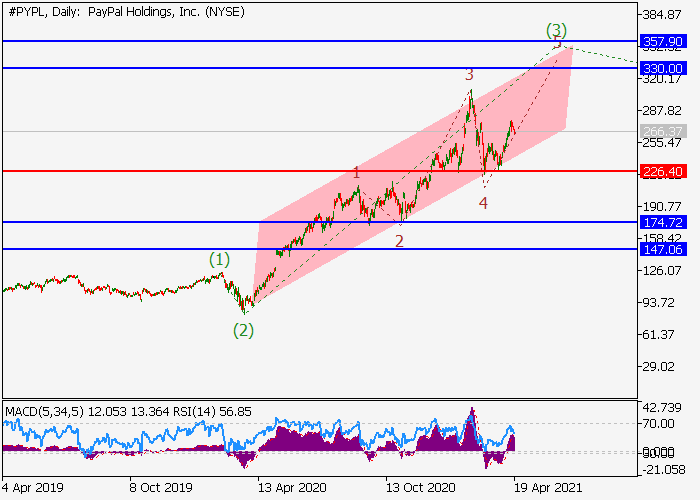
|
|
#1257
21-04-2021, 07:09
|
|||
|
|||
|
Brent Crude Oil: the instrument develops "bearish" momentum
Current trend Brent crude oil prices are showing a slight decline, developing the "bearish" momentum formed the day before and preparing to test 66.00 for a breakdown. The instrument's positions are under pressure from the alarming situation with the incidence of coronavirus in Asia, while interruptions in the supply of Libyan oil somewhat counterbalance the situation. The report of the American Petroleum Institute (API) on oil reserves released yesterday did not have a noticeable effect on the dynamics of the instrument. For the week ending April 16, published data showed a slight increase by 0.436M barrels after a decline of 3.608M barrels in the previous period. Today, investors are waiting for the statistics on crude oil stocks from the US EIA. Forecasts assume a further 2.86M barrels decline after a 5.889M barrels decline in the previous period. Support and resistance Bollinger Bands in D1 chart show weak growth. The price range is slightly expanded from above, remaining spacious enough for the current activity level in the market. MACD reversed downwards having formed a weak sell signal (located below the signal line). Stochastic is showing similar dynamics, retreating from its highs, indicating the overbought instrument in the ultra-short term. Current indicators do not contradict the further development of the "bearish" trend in the ultra-short term. Resistance levels: 67.00, 68.00, 69.00, 70.00. Support levels: 66.00, 65.00, 64.00, 63.00. 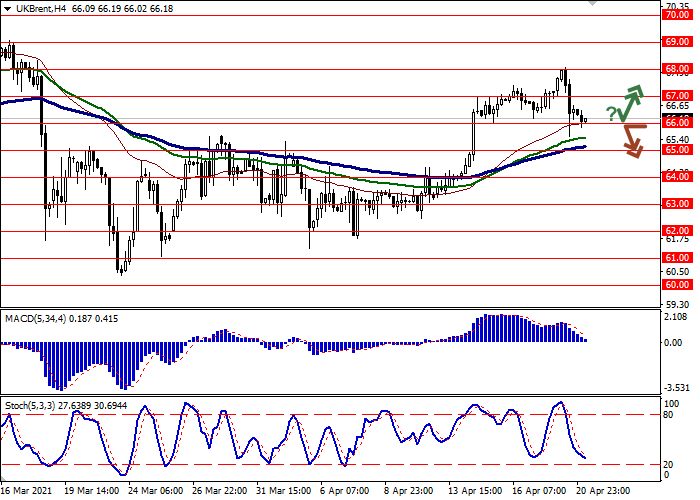 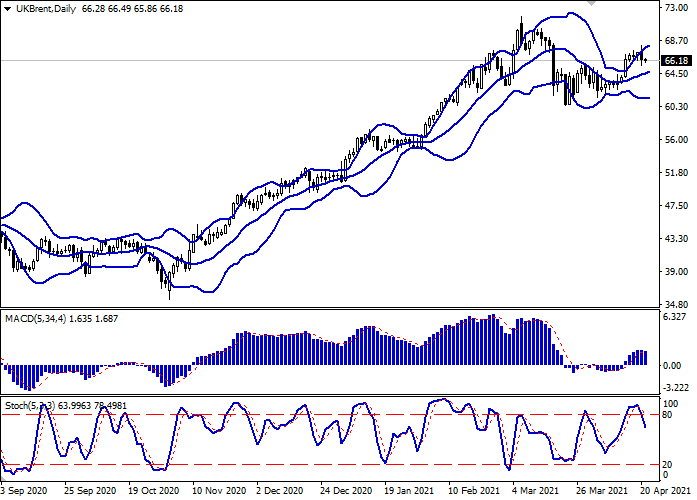
|
|
#1258
22-04-2021, 07:21
|
|||
|
|||
|
American Express Co.: wave analysis
The price may grow. On the daily chart, the fifth wave of the higher level (5) develops, within which the wave 3 of (5) forms. Now, the fifth wave of the lower level v of 3 is developing. If the assumption is correct, the price will grow to the levels of 160.00170.00. In this scenario, critical stop loss level is 134.73. 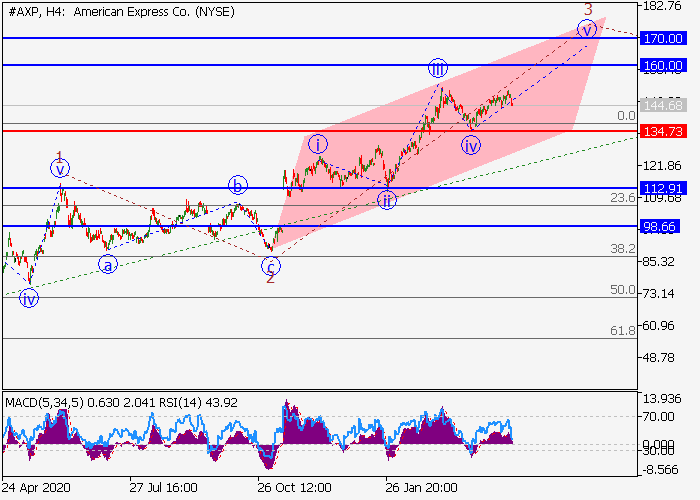 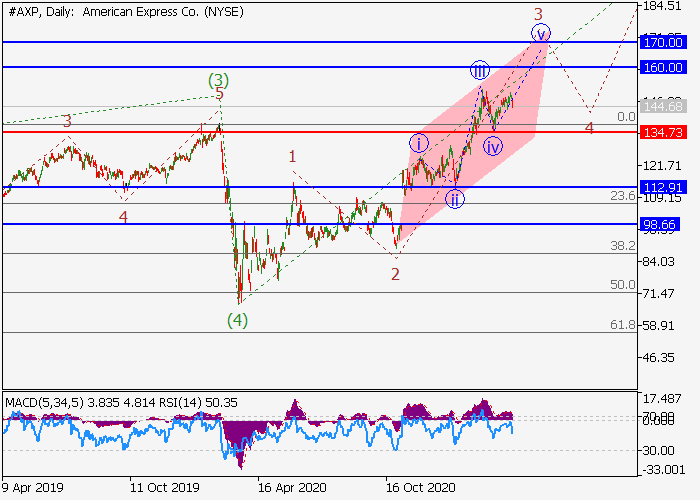
|
|
#1259
23-04-2021, 07:33
|
|||
|
|||
|
GBP/USD: the instrument shows uncertain growth
Current trend GBP demonstrates weak growth in trading this morning session, recovering from the active decline the day before, which was caused by the emergence of positive macroeconomic statistics from the US, as well as the continuing long-term profit-taking by investors. Markets were positively greeted by data on a decrease in the number of initial jobless claims for the week ending April 16 from 586K to 547K, which turned out to be much better than the negative forecast of growth to 617K. The number of continuing jobless claims fell from 3.708M to 3.674M, but the market was counting on a slightly larger decline to 3.667M. Today, GBP is in anticipation of the publication of statistics on the UK Markit PMIs in the manufacturing and services sector for April. Support and resistance Bollinger Bands in D1 chart demonstrate flat dynamics. The price range is almost unchanged, but it remains rather spacious for the current level of activity in the market. MACD reversed downwards having formed a weak sell signal (located below the signal line). Stochastic shows a somewhat more confident decline, signaling the prospects for a downtrend in the nearest future. Existing short positions should be kept until technical indicators are clarified. Resistance levels: 1.3900, 1.3960, 1.4000. Support levels: 1.3822, 1.3800, 1.3750, 1.3700. 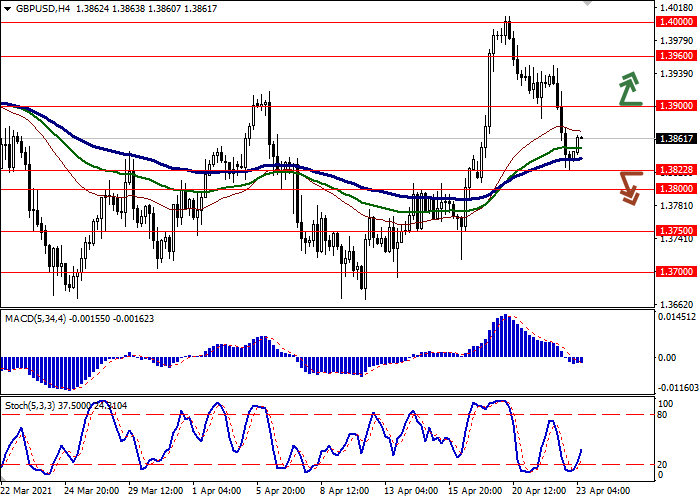 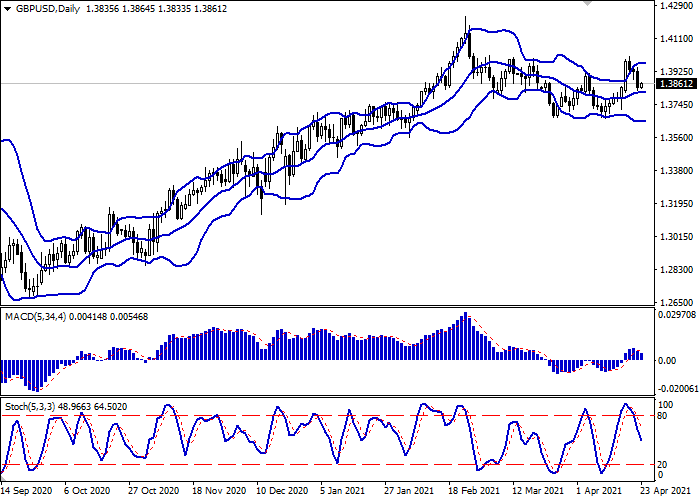
|
|
#1260
26-04-2021, 07:33
|
|||
|
|||
|
EUR/USD: updating February highs
Current trend EUR is showing moderate gains against USD during today's Asian session, continuing its Friday rally and renewing local highs since February 26. A noticeable support for EUR at the end of the last trading week was provided by the optimistic macroeconomic statistics from the eurozone. Markit Manufacturing PMI in April rose from 62.5 to 63.3 points with a forecast of a decline to 62 points. Composite PMI for the same period rose from 53.2 to 53.7 points, which also turned out to be better than expectations at 52.8 points. For the first time in a long time, Services PMI managed to consolidate above the psychological level of 50 points: in April, the indicator rose from 49.6 to 50.3 points, contrary to forecasts of a fall to 49.1 points. Today, investors are focused on the publication of data from the IFO on the level of business optimism in Germany in April. In addition, during the day, the markets expect speeches by representatives of the European Central Bank Fabio Panetta and Philip Lane. Support and resistance Bollinger Bands in D1 chart show stable growth. The price range expands slightly, freeing a path to new local highs for the "bulls". MACD indicator is growing preserving a stable buy signal (located above the signal line). Stochastic, after a short decline, reverses upwards, signaling strongly overbought EUR in the ultra-short term. Resistance levels: 1.2150, 1.2200, 1.2234, 1.2271. Support levels: 1.2078, 1.2000, 1.1950, 1.1900. 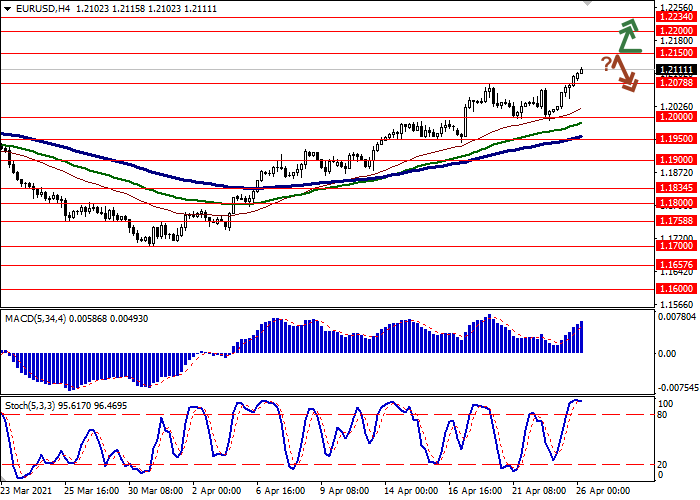 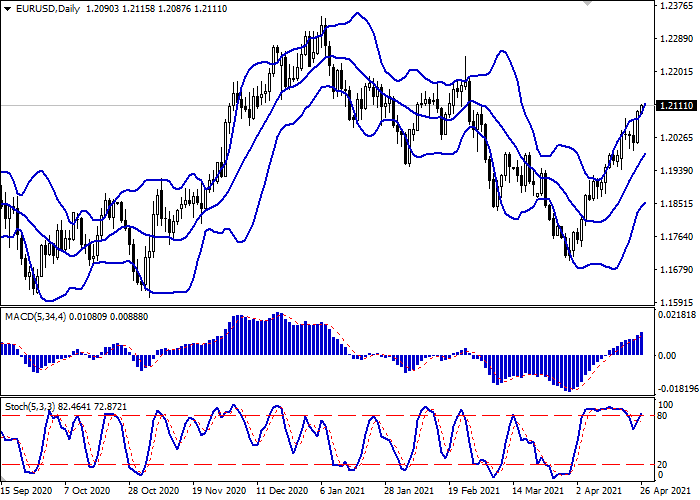
|
|
#1261
27-04-2021, 06:02
|
|||
|
|||
|
Nvidia Corp.: wave analysis
The price may grow. On the daily chart, the upward third wave of the higher level (3) develops, within which the wave 3 of (3) formed. Now, a local correction has developed as the fourth wave 4 of (3), and the formation of the wave 5 of (3) has started, within which the first wave of the lower level i of 5 is developing. If the assumption is correct, the price will grow to the levels of 700.00750.00. In this scenario, critical stop loss level is 547.76. 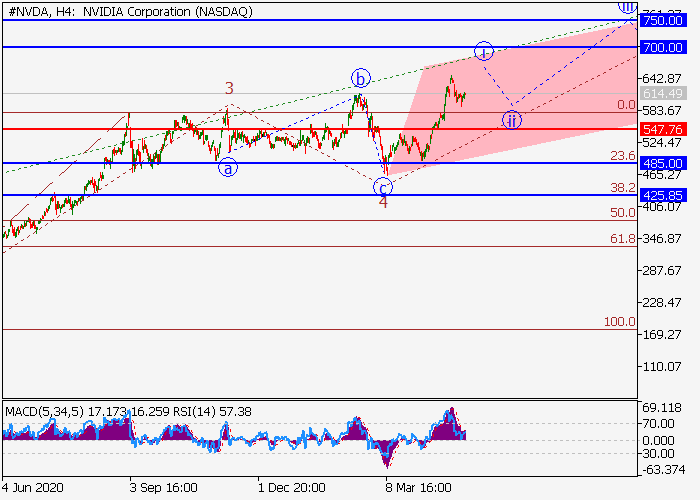 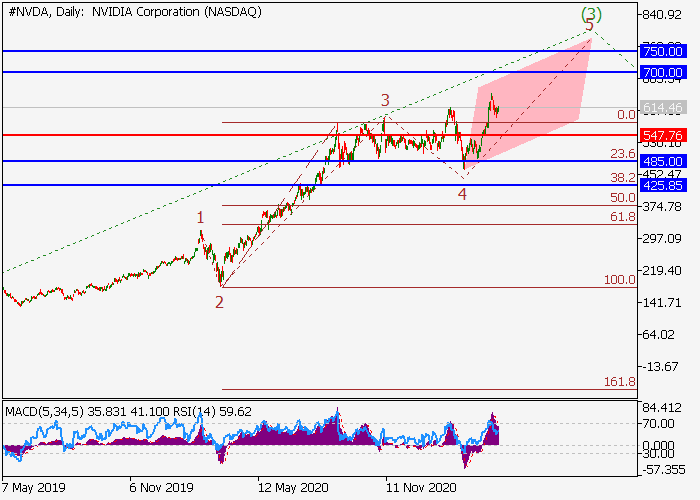
|
|
#1262
28-04-2021, 07:41
|
|||
|
|||
|
Mastercard Inc.: wave analysis
The price may grow. On the daily chart, the fifth wave of the higher level (5) develops, within which the wave 1 of (5) formed, and a local correction developed as the second wave 2 of (5). Now, the third wave 3 of (5) is forming, within which the wave of the lower level iii of 3 is developing. If the assumption is correct, the price will grow to the levels of 450.00500.00. In this scenario, critical stop loss level is 355.08. 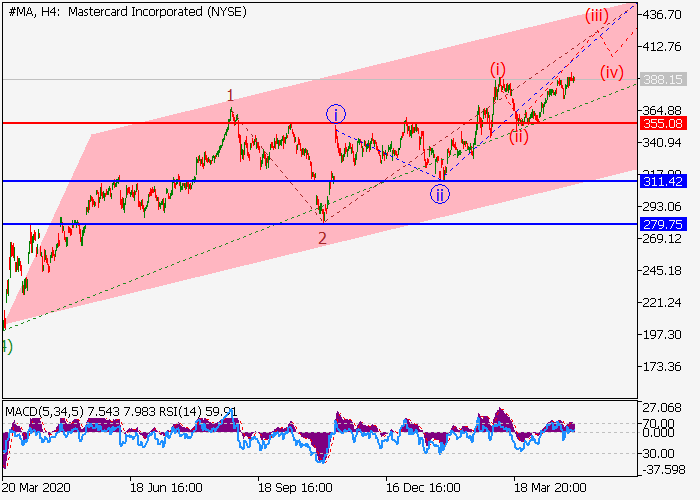 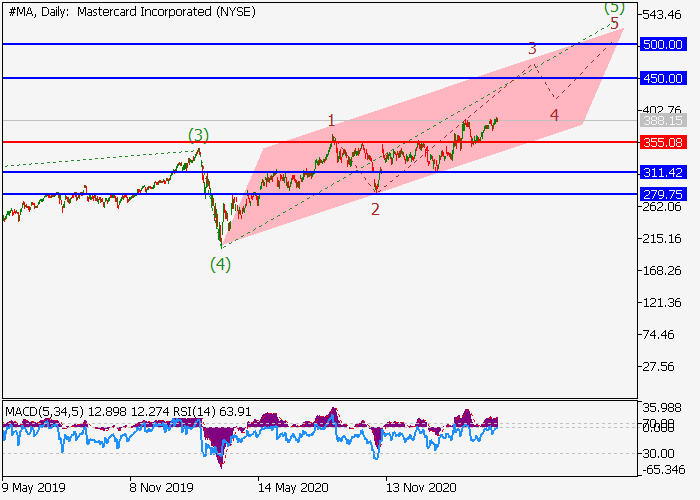
|
|
#1263
29-04-2021, 06:53
|
|||
|
|||
|
Alibaba Group Holdings Ltd.: wave analysis
The price may grow. On the daily chart, the upward fifth wave of the higher level (5) develops, within which a downward correction ended as the fourth wave 4 of (5). Now, the development of the fifth wave of the lower level 5 of (5) has started, within which the wave i of 5 has formed, a local correction has developed as the wave ii of 5, and the formation of the wave iii of 5 has started. If the assumption is correct, the price will grow to the levels of 299.84318.84. In this scenario, critical stop loss level is 220.97. 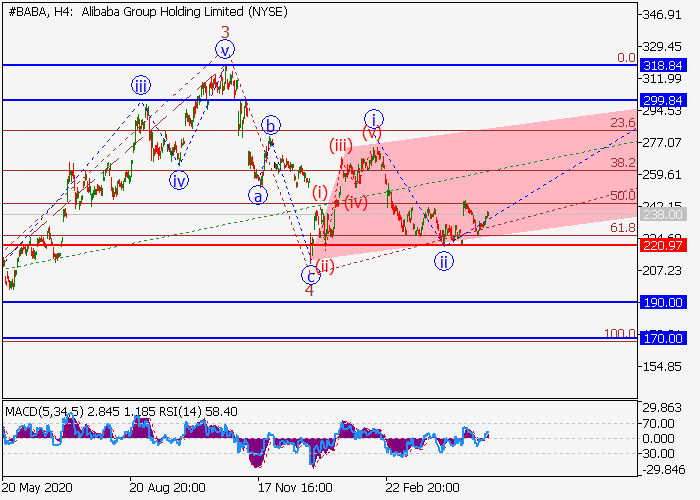 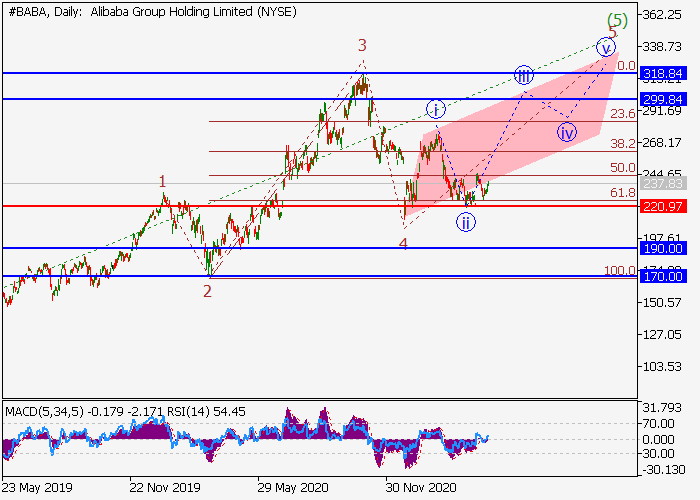
|
|
#1264
03-05-2021, 07:02
|
|||
|
|||
|
Microsoft Corp.: wave analysis
The price is in a correction and may grow. On the daily chart, the fifth wave of the higher level (5) of 3 develops, within which the wave 3 of (5) forms. Now, the third wave of the lower level iii of 3 has developed, and a local correction is forming as the fourth wave iv of 3. If the assumption is correct, the price will grow to the levels of 285.00300.00. In this scenario, critical stop loss level is 231.09. 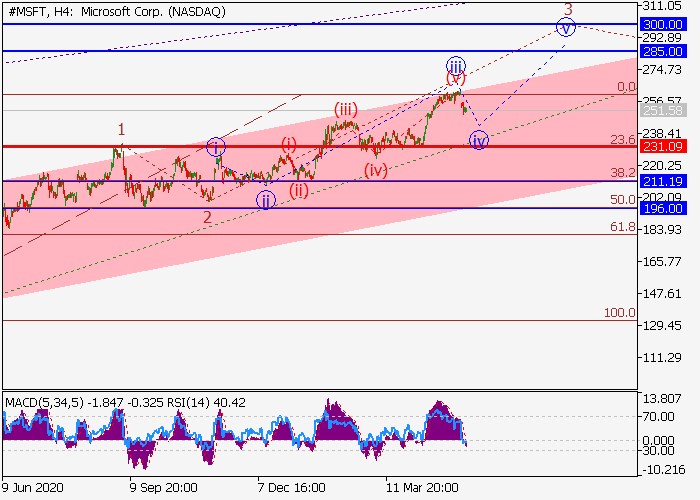 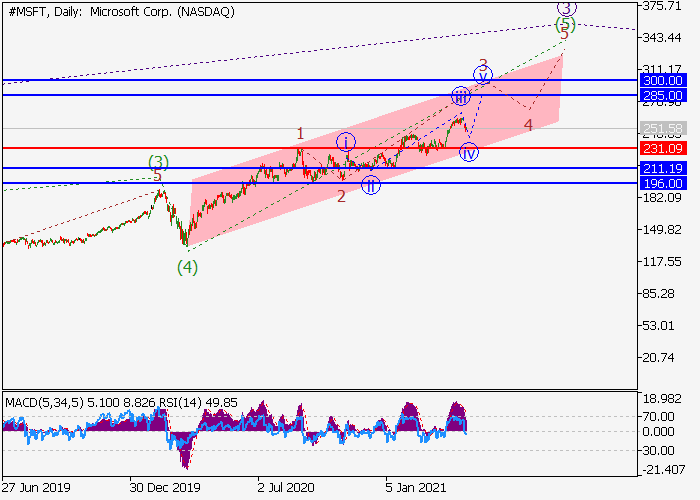
|
|
#1265
04-05-2021, 06:52
|
|||
|
|||
|
Bank of America Corp.: wave analysis
The price may grow. On the daily chart, the third wave of the higher level (3) forms, within which the wave 3 of (3) developed. Now, a local correction has formed as the fourth wave 4 of (3), and the development of the wave 5 of (3) has started. If the assumption is correct, the price will grow to the levels of 44.5047.00. In this scenario, critical stop loss level is 37.66. 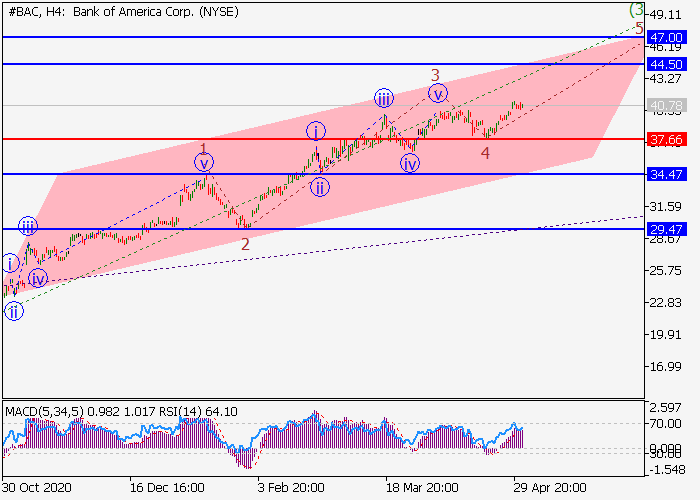 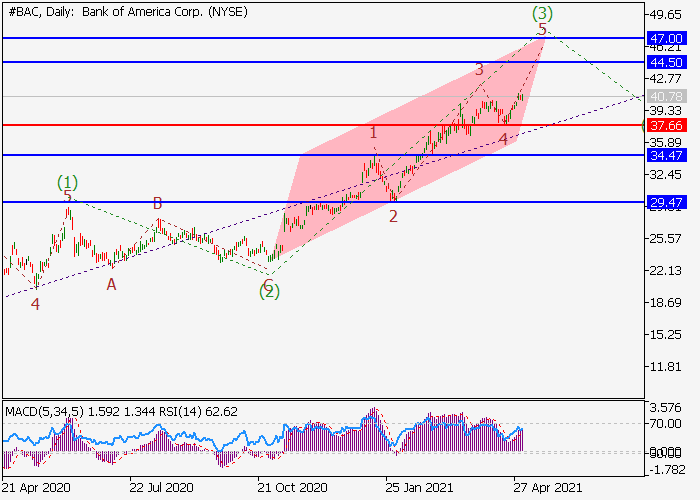
|
|
#1266
05-05-2021, 06:46
|
|||
|
|||
|
EUR/USD: EUR quotes remain under pressure
Current trend EUR shows a slight increase against USD during today's Asian session, correcting after yesterday's decline, which led to the renewal of local lows of April 22. USD retains its previous growth momentum, which was formed at the end of last week, receiving additional support after the speech of the US Treasury Secretary Janet Yellen, who did not rule out the possibility of an early rate hike in order to avoid overheating the American economy, which is demonstrating impressive growth rates. Investors are also optimistic about news of the gradual reopening of the US states against the backdrop of an active vaccination campaign and a general stabilization of the epidemiological situation. Market participants are focused on statistics on business activity in the services and manufacturing sectors of the eurozone from Markit. In addition, a speech by the European Central Bank representative Philip Lane is expected, who may hint on tightening monetary policy in the region. Support and resistance In the D1 chart, Bollinger Bands are reversing horizontally. The price range is narrowing, reflecting the emergence of ambiguous dynamics of trading in the short term. MACD is going down preserving a stable sell signal (located below the signal line). Stochastic, having approached its lows, is trying to reverse upwards, indicating the risks of oversold EUR in the ultra-short term. To open new positions, it is necessary to wait for the trade signals to become clear. Resistance levels: 1.2037, 1.2087, 1.2148, 1.2200. Support levels: 1.2000, 1.1945, 1.1900, 1.1850. 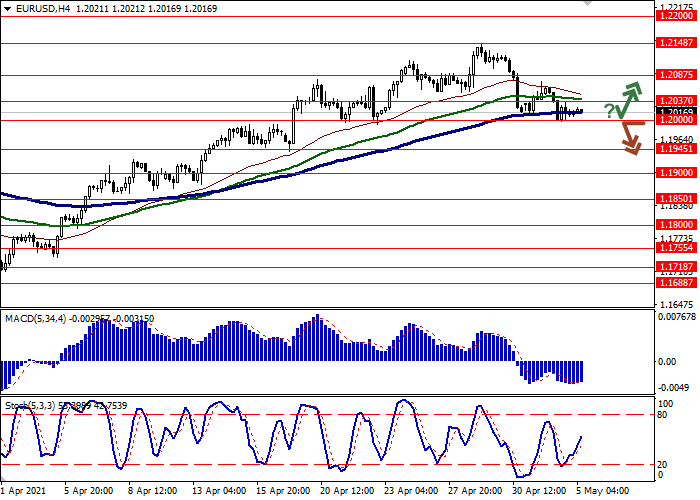 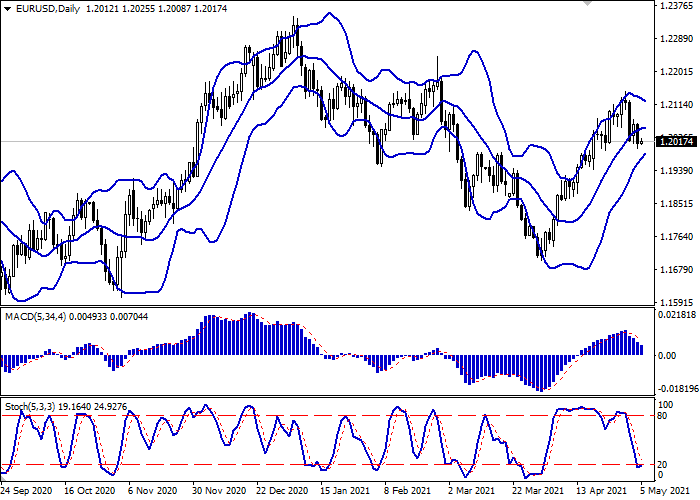
|
|
#1267
06-05-2021, 08:00
|
|||
|
|||
|
WTI Crude Oil: a sharp drop in crude stocks supported prices
Current trend The price of North American light oil, WTI Crude Oil, moves within a corrective uptrend, trading at the level of 65.73. The quotes received significant support after the American Petroleum Institute (API) and the Energy Information Administration (EIA) published their reports on reserves this week. According to API data, inventories in storage facilities decreased by 7.688M barrels, which is significantly higher than the expected decrease by 2.191M. A day later, the EIA reported a drop in inventories of American firms by 7.990M barrels, which is significantly higher than the expected 2.346M. for a week, could not but provoke the growth of the instrument. The upward dynamics may continue until the end of the week. Support and resistance On the local chart, the price continues its corrective growth, trading above the key level of $65. Technical indicators are in the state of a buy signal, completing a local correction: the fluctuation range of the Alligator EMA is ready for a new extension, and the AO oscillator histogram is in the buy zone, although it is still forming downwards bars. Resistance levels: 66.50, 68.70. Support levels: 65.00, 63.00. 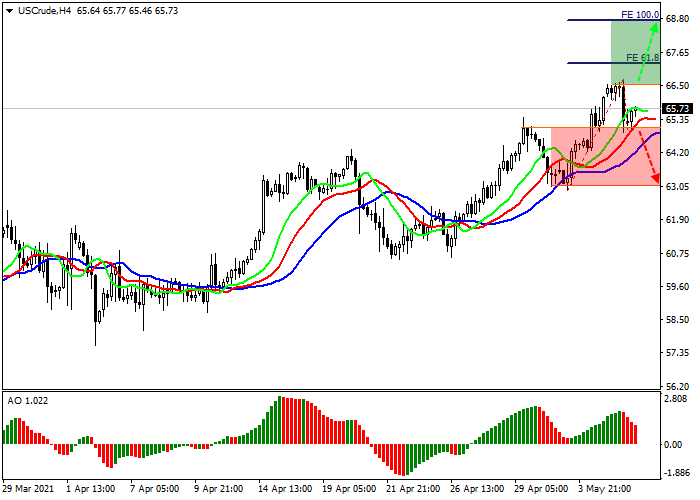
|
|
#1268
07-05-2021, 07:42
|
|||
|
|||
|
XAU/USD: wave analysis
The pair may grow. On the daily chart, the third wave of the higher level (3) formed, a downward correction developed as the fourth wave (4), and the formation of the fifth wave (5) started. Now, the first wave of the lower level 1 of (5) is developing, within which the correctional wave iv of 1 has formed, and the wave v of 1 is developing. If the assumption is correct, the pair will grow to the levels of 1841.901877.85. In this scenario, critical stop loss level is 1768.71. 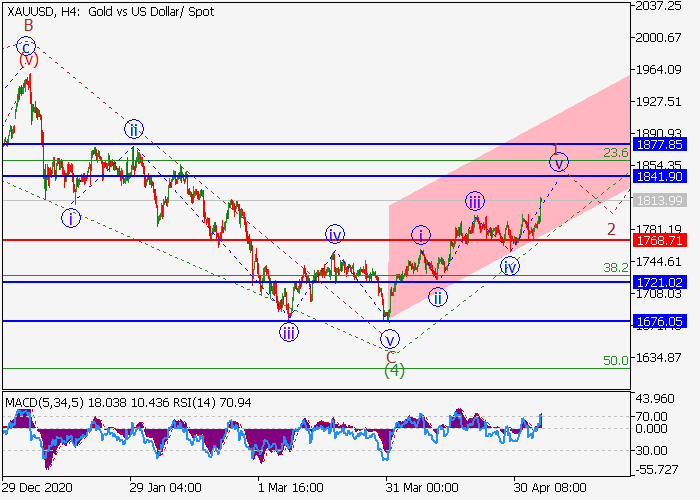 
|
|
#1269
10-05-2021, 07:25
|
|||
|
|||
|
USD/CAD: the likelihood of a trend change is still low
Current trend The USD/CAD pair is showing a downtrend, trading at 1.2115. CAD continues to look strong against the backdrop of the declining USD; however, Friday's labor market data from Canada made analysts question the strength of CAD. The Unemployment Rate in April rose from 7.5% to 8.1%, showing the most significant deterioration since March 2020. The Net Change in Employment decreased by 207.1K, which turned out to be much worse than the expected decline by 175.0K. Participation Rate fell to 64.9% from 65.2%. The USD/CAD pair did not change the trend only due to the fact that the situation on the US labor market turned out to be even worse. The Unemployment Rate in April rose from 6.0% to 6.1%. In turn, the employment rate fell in almost all sectors. The number of jobs in the manufacturing industry decreased by 18K, with a projected increase of 55K, and the number of Nonfarm Payrolls increased by 266K, with an expected increase of 978K. Thus, the target indicators for employment were again not reached, so raising interest rates by the US Fed is out of the question. Support and resistance On the daily chart, the price continues to form a global descending channel. Technical indicators are in a state of sale: the range of EMA fluctuations on the Alligator indicator continues to expand, and the histogram of the AO oscillator is trading in the sales zone. Resistance levels: 1.2260, 1.2610. Support levels: 1.2050, 1.1800. 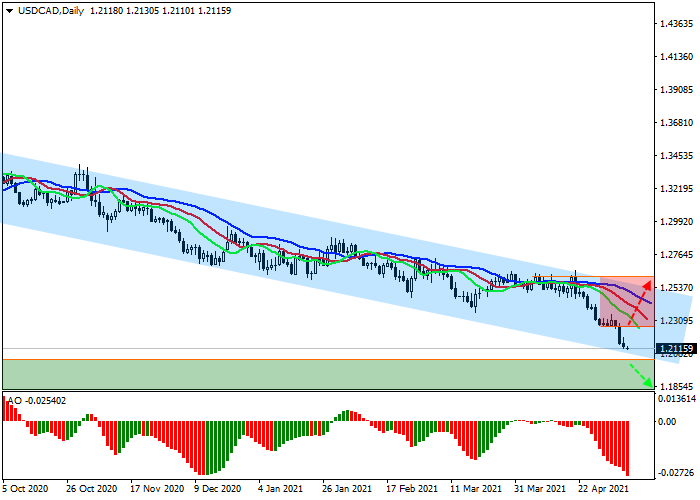
|
|
#1270
11-05-2021, 06:44
|
|||
|
|||
|
Brent Crude Oil: awaiting the publication of monthly OPEC report
Current trend The prices for benchmark Brent crude oil continue their correctional movement, trading around $68.30 per barrel. The quotes stopped their global growth and consolidated within a comfortable range. Investors are monitoring the situation in Asia, where a new outbreak of the coronavirus pandemic has been recorded. It is still unknown to what extent this situation may affect demand. OPEC is to publish its monthly report today and the situation may become clearer. Also, the US Department of Energy will present its short-term outlook on the energy market, and traders will be able to assess the impact of recent cyberattacks on the US fuel infrastructure. As for the situation in the global arbitrage position of the spread between Brent Crude Oil and WTI Crude Oil, then everything is quite calm, and the price difference has been kept in the range of $3.54 for a long time, which indicates the reluctance of large players to do something. Global investors are satisfied with the current quotes of the asset and the stable range of weekly volatility of 46%. Support and resistance Locally, the asset is growing smoothly within a fairly wide channel. Technical indicators are in a state of uncertainty: fast EMAs of the Alligator indicator intertwined with the signal line and the histogram of the AO oscillator trades close to the transition level. Resistance levels: 68.90, 70.30. Support levels: 67.70, 66.30. 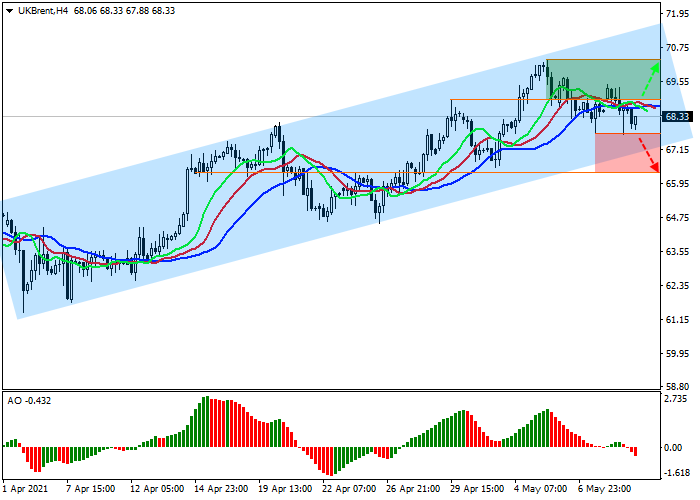
|
|
#1271
12-05-2021, 06:58
|
|||
|
|||
|
Mastercard Inc.: wave analysis
The price may grow. On the daily chart, the fifth wave of the higher level (5) develops, within which the wave 3 of (5) forms. Now, the first wave of the lower level i of 3 has developed, and a local correction is forming as the wave ii of 3. If the assumption is correct, after the end of the correction, the price will grow to the levels of 450.00500.00. In this scenario, critical stop loss level is 313.00. 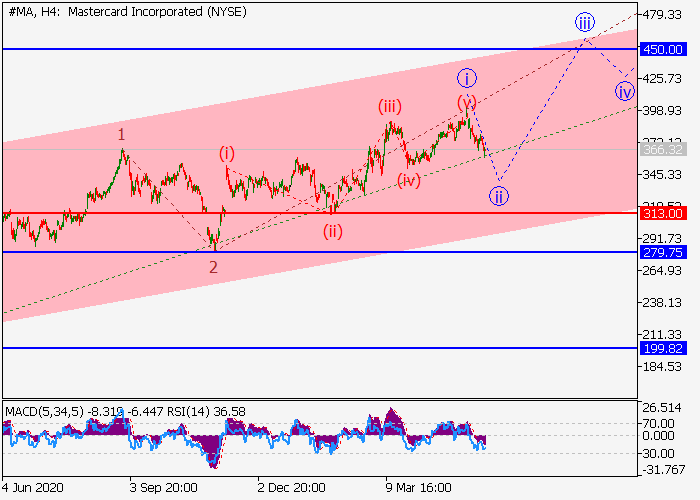 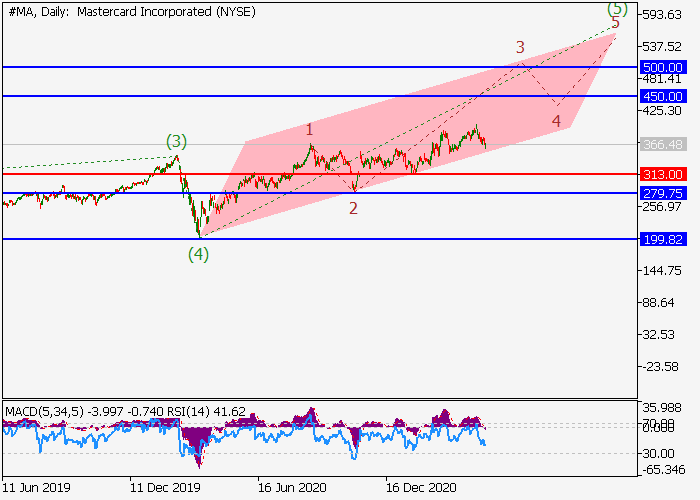
|
|
#1272
13-05-2021, 07:39
|
|||
|
|||
|
XAG/USD: high bond yields inhibit growth
Current trend Silver contract price is correcting downwards, trading at 27.00 and continuing to trade in a global uptrend. Investors watched the auction for the placement of 10-year US Treasuries at a rate of 1.684%. Such high yield has a negative effect on the price of silver and gold, but it could not exceed the psychological level of 1.700%, which gives hope for a slowdown in the growth of the debt market. The XAG/USD pair is supported by a significant increase in inflation in the US, the expectation of which was one of the main reasons for the strengthening of precious metals in April and May. These assets have always been ideal hedging instruments to protect capital from inflationary risks, so higher rates from the US Fed are needed for their growth. Annual inflation in the country accelerated to 2.6%, which means an increased likelihood of an early change in monetary policy by the American regulator. Support and resistance On the global chart of the asset, the price continues to grow within a narrow ascending channel. Technical indicators maintain the buy signal: the range of EMA fluctuations on the Alligator indicator continues to expand, and the histogram of the AO oscillator is high in the purchase zone. Resistance levels: 27.61, 29.00. Support levels: 26.47, 24.93. 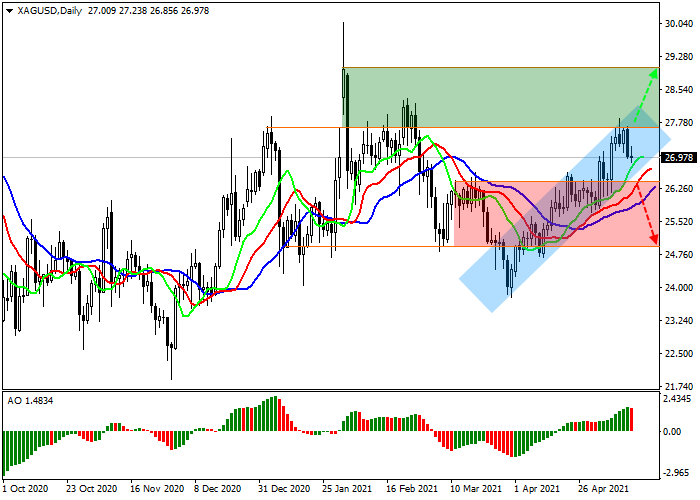
|
|
#1273
14-05-2021, 07:31
|
|||
|
|||
|
Altria Group Inc.: wave analysis
The price may grow. On the daily chart, the first wave of the higher level (1) develops, within which the wave 3 of (1) forms. Now, the third wave of the lower level iii of 3 has formed, and a local correction has ended as the fourth wave iv of 3. If the assumption is correct, the price will grow within the wave v of 3 to the levels of 55.0057.50. In this scenario, critical stop loss level is 44.71. 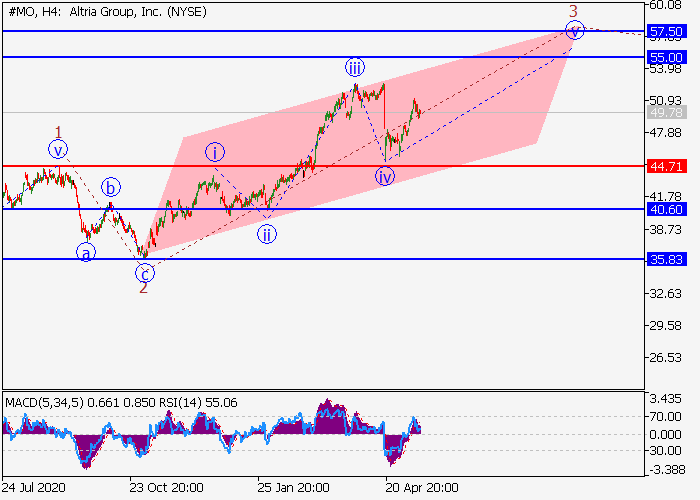 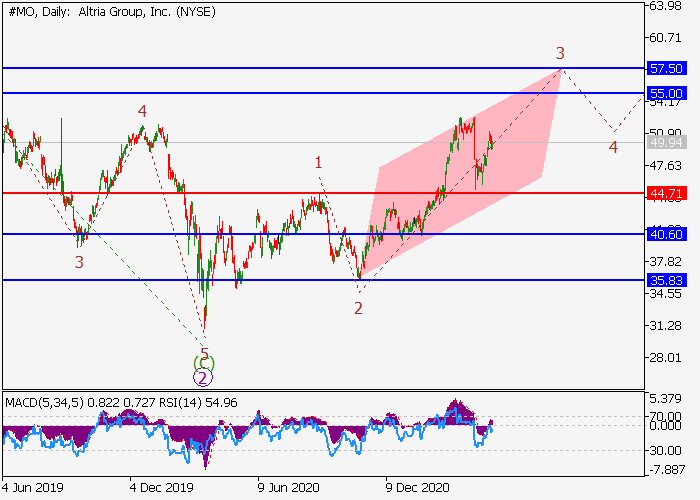
|
|
#1274
17-05-2021, 07:41
|
|||
|
|||
|
XAU/USD: growth in supply pushes quotes up
Current trend Gold quotes continue corrective growth, trading at $1,855 per ounce. After the lifting of quarantine restrictions, the global demand for metals went up sharply, provoking price growth. At the moment, industry leaders are beginning to actively recover from the consequences of the pandemic, increasing gold production, which will undoubtedly affect the price of the precious metal. Yesterday, the South African statistics service published data on mining for March this year. According to official data, the figure rose by 21.3%, the growth of platinum ore production was 68.6%, and of gold 10.5%. However, the volume of sales of the asset rose much higher, at 61.3%. Thus, the strengthening of world metal production and the current negative trend in the US dollar contribute to the positive dynamics of the instrument. Support and resistance On the global chart, the price reaches the resistance line of the global downtrend and its breakout will allow the rate to reach 2000.0 by the end of May. Technical indicators keep a global buy signal: the fluctuation range of the Alligator EMA is quite wide, and the histogram of the AO oscillator is trading in the positive zone. Resistance levels: 1871.0, 1955.0. Support levels: 1815.0, 1763.0. 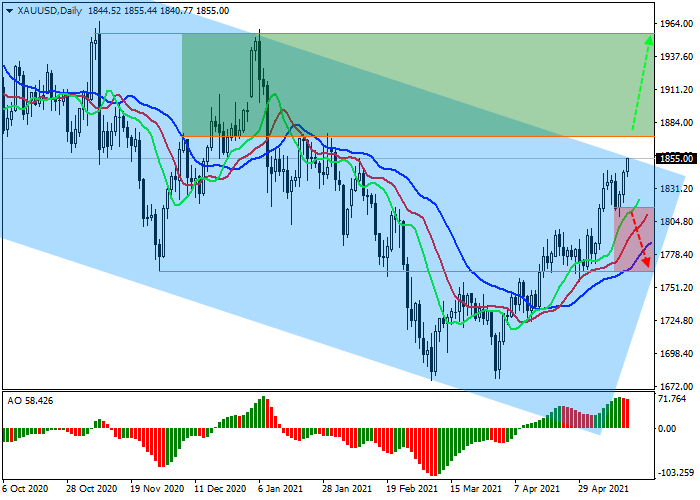
|
|
#1275
18-05-2021, 07:09
|
|||
|
|||
|
EUR/USD: investors await signals from the FOMC
Current trend The EUR/USD pair grows, trading around the level if 1.2169 in anticipation of the publication of data on the Q1 EU GDP. Although the pace of vaccination in the EU countries has accelerated significantly, the economy continues to recover extremely slowly. Analysts expect the indicator to remain unchanged at 1.8% YoY and 0.6% QoQ. Italian consumer prices were released yesterday, rising by 0.4% for April, slightly above 0.3% for March. The harmonized consumer price index for the same period slowed down to 0.9% from 1.8% for March. USD is trading at rather low volumes in anticipation of the publication of the minutes of the Federal Open Market Committee (FOMC), which will take place tomorrow. Despite the numerous statements by experts that the US Federal Reserve does not need to raise interest rates right now, it has happened more than once that the regulator acted unexpectedly. Investors prefer to wait for hints from the department and are in no hurry to open positions with the American currency. Support and resistance Locally, the price continues its corrective growth. Technical indicators keep a buy signal: the fluctuation range of the EMA on the Alligator indicator is wide enough, and the histogram of the AO oscillator moves in the buy zone, forming new upward bars. Resistance levels: 1.2182, 1.2260. Support levels: 1.2141, 1.2060. 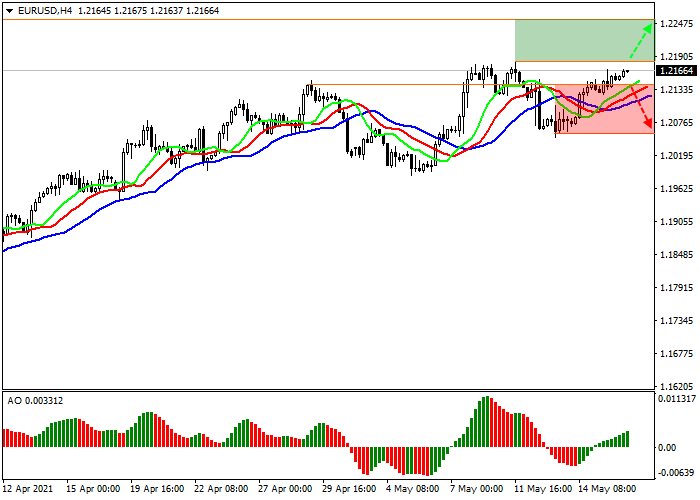
|
|
#1276
19-05-2021, 06:50
|
|||
|
|||
|
Brent Crude Oil: pending decisions on the Iranian nuclear deal
Current trend Brent crude prices continue their correctional movement, trading at 68.00 after another attempt to consolidate above the key level of 70.00. Analysts point to possible significant progress in negotiations between the United States and Iran on the renewal of the nuclear deal. If the parties are able to agree, and the US authorities will not extend the sanctions against Tehran, this will allow Iran to significantly increase the supply of cheap "black gold" to the world market. Yesterday, the American Petroleum Institute (API) released data on weekly stocks, which increased by 0.620M barrels, which is lower than the expected increase of 1.680M. Today, the Energy Information Administration (EIA) of the US Department of Energy will publish its report, which is predicted to show an increase in reserves of 1.623M barrels. However, if the actual data demonstrate a decrease in the indicator, the local trend in the asset may again change to an uptrend. Support and resistance On the local chart, the asset continues to trade close to the global high, forming a sideways channel with the boundaries of 70.0066.50. Technical indicators are in a state of uncertainty: the fast EMAs of the Alligator indicator are below the signal line, and the histogram of the AO oscillator has moved into the sell zone, forming the first bar below the zero level. Resistance levels: 70.20, 74.00. Support levels: 66.70, 63.00. 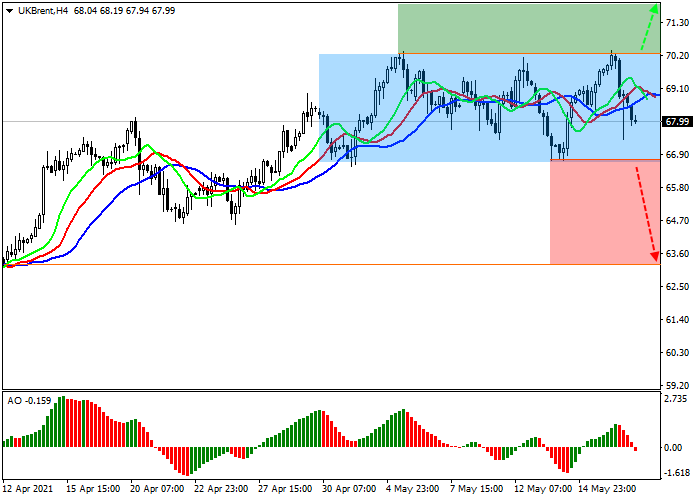
|
|
#1277
20-05-2021, 07:38
|
|||
|
|||
|
NZD/USD: the likelihood of a decline in the USD increased
Current trend The NZD/USD pair corrects and is currently trading near the level of 0.7181, trying to consolidate within an uptrend. The latest statistics from New Zealand did not affect the price significantly. Thus, the Q1 producer purchase price index increased by 2.1%, while a quarter earlier the growth was only 0.1%. The selling price index increased by 1.2%, which was higher than the previous value of 0.5%. The Reserve Bank of New Zealand's net debt may fall to 34.00%, up from 39.70% in the last analyst forecast. Although the publication of the US Federal Reserve Open Market Committee (FOMC) Meeting Minutes did not give clear hints of further actions of the regulator on monetary policy, the statements of several officials forced investors and analysts to take even more seriously a possible change of course at the next meetings. Inflation is accelerating and the authorities need to take measures to contain it. The debt market reacted sharply to the increased likelihood of rate hikes. The yield on the key 10-year US Treasuries reached 1.680%, while yesterday morning it was 1.641%. An increase in yield is a negative signal for USD, which is now on the verge of a new cycle of decline. Support and resistance The price moves within the local upward correction. Technical indicators keep a poor buy signal: fast EMAs on the Alligator indicator are above the signal line, and the AO oscillator histogram is in the buy zone. Support levels: 0.7131, 0.6950. Resistance levels: 0.7257, 0.7443. 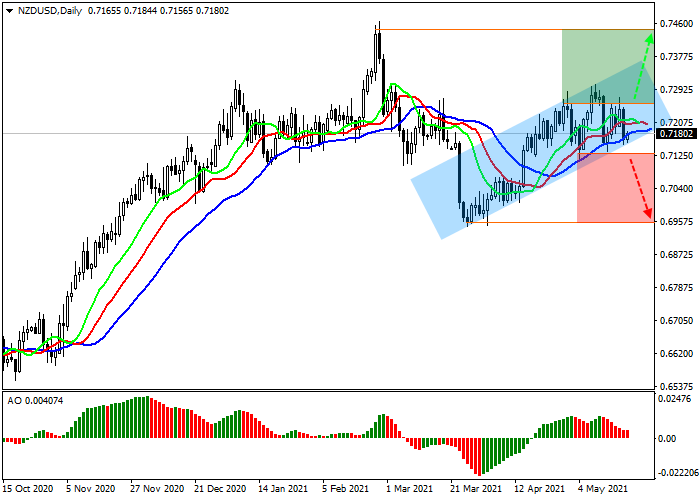
|
|
#1278
21-05-2021, 07:13
|
|||
|
|||
|
USD/JPY: positive reports support the yen
Current trend The USD/JPY pair is correcting around the level of 108.71. The Japanese currency began to rally after the country's Ministry of Health announced approval for the use of two vaccines: from the companies Moderna and AstraZeneca. According to the Ministry of Health, the Moderna vaccine will begin to be used as early as May 24 but the use of the AstraZeneca vaccine has been postponed for now. Also, the instrument is positively influenced by macroeconomic statistics. Japan's nationwide core consumer price index for April was 0.1% YoY, better than analysts expectations of 0.2%. The consumer price index reached 0.4%, while the Service PMI is at the level of 45.7 points. The key data for the American currency was an unexpected reduction in the number of Initial Jobless Claims, amounting to 444K, which is less than the expected 450K. The average number of applications over the past 4 weeks also decreased to 504.75K against 535.25K a week earlier. However, the positive was short-lived, and data on the manufacturing activity index from the Federal Reserve Bank of Philadelphia for May stopped the upward trend. The indicator dropped to 31.5 points from 50.2 points a month earlier. Support and resistance The instrument moves within an upward corrective trend, forming an upward channel, which can subsequently transform into a Flag pattern. Technical indicators are in a state of uncertainty: fast EMAs on the Alligator indicator almost crossed with the signal line, and the histogram of the AO oscillator approached the transition level. Resistance levels: 109.33, 110.75. Support levels: 108.35, 107.48. 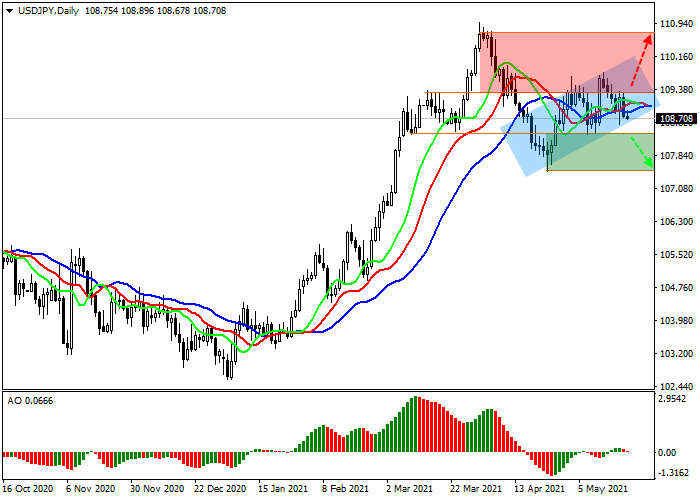
|
|
|
|
 Similar Threads
|
||||
| Thread | Thread Starter | Forum | Replies | Last Post |
| Best News Analysis Platform | fxindicator | News trading | 6 | 27-12-2023 19:55 |
| Forex Analysis by LiteForex | LiteFXnews | Forex Analysis | 0 | 12-11-2015 07:38 |
| Hotforex.com - Market Analysis and News. | HFblogNews | Forex Analysis | 0 | 05-06-2015 10:47 |
| OctaFX.Com - Financial News and Analysis | farid | News trading | 341 | 27-01-2014 15:44 |


