Forex Forums | ForexLasers.com |
|
|||||||
 |
|
|
LinkBack | Thread Tools | Search this Thread |
|
#561
 20-11-2019, 11:06
|
||||
|
||||
|
USD/CAD: Current Dynamics
11/20/2019 In the first ten days of October, the USD / CAD pair broke through an important support level (EMA144, EMA200 on the daily chart), which at that time passed through the 1.3230 mark and reached a local minimum near the 1.3042 mark by the end of October. Nevertheless, there was no further decline of USD / CAD, and after the meeting of the Bank of Canada and the Fed, at which the Fed leaders announced the suspension of the rate reduction cycle, the US dollar began to strengthen, including in the USD / CAD pair. The long-term positive dynamics of the US dollar and, accordingly, the USD / CAD pair, which continues to trade above the key and long-term support level of 1.2920 (EMA200 on the weekly chart), remains. At the beginning of the European session, USD / CAD is trading above 1.3300 mark, developing an upward trend. While USD / CAD is trading in the zone above the support level of 1.3227 (EMA200 on the daily chart, EMA200 on the 1-hour chart), you should look for the opportunity to enter long positions. A signal for sales will be a breakdown of the support level of 1.3227. In this case, the reduction targets will be the support levels 1.3200, 1.3138 (September lows), 1.3100, 1.3060, 1.3042. From the news for today it is worth paying attention to the publication (at 13:30 GMT) of consumer price indices in Canada, as well as weekly data on oil reserves in the USA (at 15:30 GMT). Forecast for October: the consumer price index will come out with a value of +1.9% (in annual terms). Core CPI is also expected to increase by +1.9% in October. Data better than expected and above the previous values will strengthen the Canadian dollar. If the data for October is worse than the previous values, then this will negatively affect CAD. Also, CAD may be negatively affected by the publication of US Department of Energy data on oil reserves, which are expected to rise again last week (+1.1 million barrels). Pessimism over US-China trade relations is forcing investors to give up risk by raising demand for safe assets and the dollar, as well as putting pressure on commodity goods prices and commodity currencies, such as CAD. Oil prices are falling, as the stalled US-China trade negotiations causes worry about demand prospects. The overall decline in oil prices this week was already 4.7%. As Carolyn Wilkins, Bank of Canada Deputy Governor, said on Tuesday, the risks for global GDP growth have intensified, and the uncertainty surrounding foreign trade remains heightened. We cannot afford to lose our vigilance, she said, especially when it comes to recession. The next meeting of the Bank of Canada on the issue of monetary policy is scheduled for December 4. Volatility growth in the financial market today is also expected at 19:00 (GMT), when the minutes from the October meeting of the Fed will be published, especially if they contain unexpected information regarding the issue of monetary policy of the US central bank. Support Levels: 1.3300, 1.3270, 1.3227, 1.3200, 1.3138, 1.3100, 1.3060, 1.3042, 1.3015 Resistance Levels: 1.3345, 1.3380, 1.3400, 1.3452 Trading Scenarios Sell Stop 1.3250. Stop-Loss 1.3320. Take-Profit 1.3227, 1.3200, 1.3138, 1.3100, 1.3060, 1.3042, 1.3015 Buy Stop 1.3320. Buy Limit 1.3270. Stop-Loss 1.3250. Take-Profit 1.3345, 1.3380, 1.3400, 1.3452 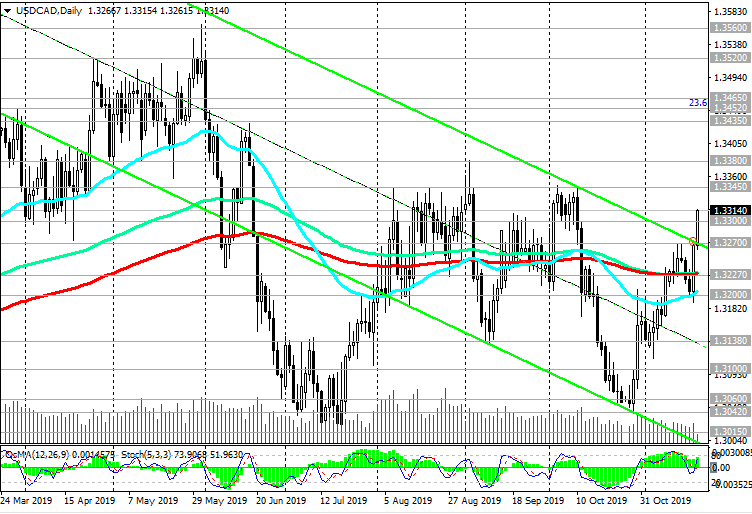 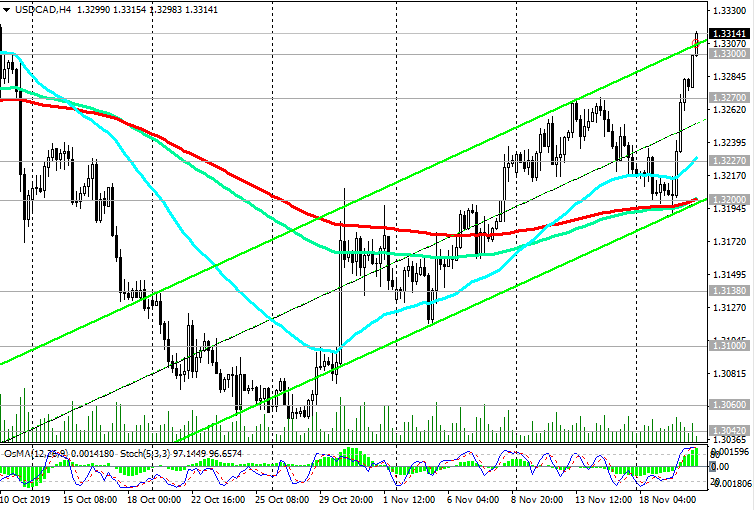 *) For up-to-date and detailed analytics and news on the forex market visit Tifia Forex Broker website tifia.com 
|
|
#562
21-11-2019, 10:39
|
||||
|
||||
|
EUR/USD: the Fed took a wait and see position
11/21/2019 The minutes published on Wednesday from the Fed meeting in October confirmed the central banks leaderships attitude to take a wait-and-see attitude to determine if the economy will need additional stimulus in the coming months. "Most participants decided that monetary policy after lowering rates by a quarter percentage point at this meeting will be precisely tuned to maintain prospects for moderate economic growth, a strong labor market", the minutes said. The probability of the next one reduction in rates by the middle of next year, according to the CME Group, is about 50%. However, the dollar is falling on Thursday. At the start of today's European session, the DXY dollar index futures are trading near 97.70, 6 pips below today's open price and 13 pips below open price earlier this week. Now, participants in the financial market will follow the publication (at 12:30 GMT) of the minutes from the ECB meeting in October. If the protocols contain unexpected statements or new information regarding the prospects of monetary policy, this could lead to a surge in volatility in trading on the euro and on the European stock market. In October, the ECB did not change its monetary policy and announced no new measures. At the same time, among the Governing Council of the ECB, voices of opponents of the current incentive policy are increasingly heard. The next meeting of the ECB on monetary policy will be held on December 12, and any changes in the mood of the ECB leaders and their opinion on the current monetary policy of the central bank may lead to increased volatility in the financial markets, especially for the euro and EUR / USD. Currently, EUR / USD is developing an upward trend, trading above short-term support levels of 1.1065 (ЕМА200 on the 4-hour chart, ЕМА50 on the daily chart), 1.1060 (ЕМА200 on the 1-hour chart). Nevertheless, EUR / USD growth is above key resistance levels of 1.1130 (ЕМА144 on the daily chart), 1.1175 (ЕМА200 on the daily chart) is unlikely. In general, the long-term bearish trend of EUR / USD remains. The breakdown of the support level of 1.1060 will be a signal for the resumption of sales of EUR / USD. Support Levels: 1.1065, 1.1060, 1.0995, 1.0940, 1.0900 Resistance Levels: 1.1110, 1.1130, 1.1175 Trading Recommendations Sell Stop 1.1050. Stop-Loss 1.1110. Take-Profit 1.1000, 1.0940, 1.0900, 1.0850 Buy Stop 1.1095. Stop-Loss 1.1050. Take-Profit 1.1110, 1.1130, 1.1175 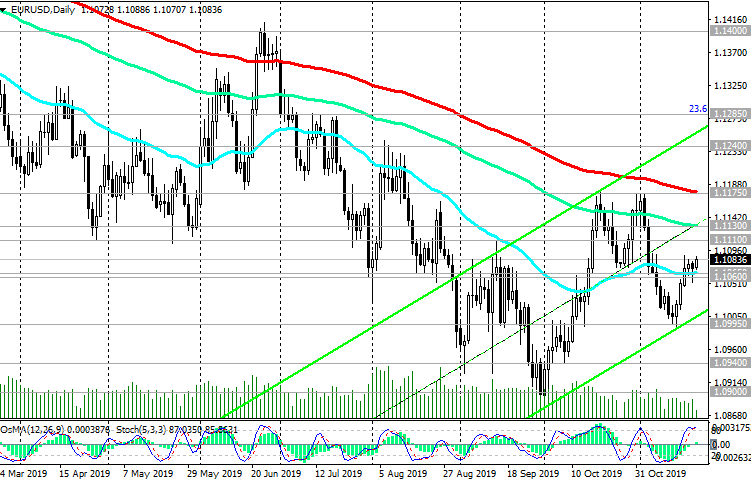 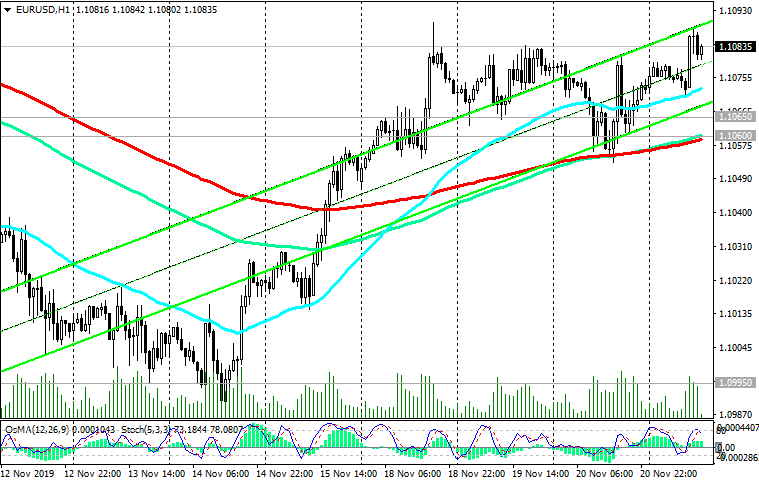 *) For up-to-date and detailed analytics and news on the forex market visit Tifia Forex Broker website tifia.com
|
|
#563
22-11-2019, 11:08
|
||||
|
||||
|
Brent: near key resistance levels
11/22/2019 Against the backdrop of investor optimism regarding the imminent conclusion of a trade agreement between the United States and China, Brent crude prices rose in the past 2 months, exceeding $64.00 per barrel last Thursday. Nevertheless, the price has not yet been able to develop an upward trend above this mark, near which strong resistance levels 63.60 (EMA200 on the daily chart) and 63.90 (Fibonacci level 38.2% of the downward correction in the wave of price growth from a level near the level of 27.10 to highs of October 2018 near the mark of 86.60 dollars per barrel) are located. Currently, Brent crude is trading in the zone of these resistance levels, from which either a rebound or consolidation is possible. For further price movement in one direction or another, new drivers are needed. They may be trade negotiations between the US and China and the OPEC meeting in December. At the same time, OPECs decision to reduce oil production was mainly taken into account in prices, the level of oil production in the United States remains high, and there is no tangible progress in trade negotiations between the United States and China. These factors indicate that further growth in oil prices will be limited. On Friday, oil market participants will follow the publication (at 18:00 GMT) of the Baker Hughes report on the number of active drilling rigs in the United States. Previous reports showed a decrease in the number of active oil platforms in the United States to 674 units at the moment (from 800 units at the beginning of June and 742 units at the beginning of September). If the report again indicates a decrease in the number of such installations, then this may give a short-term positive impetus to prices. Nevertheless, to say that optimism of investors dominates the oil market is hardly appropriate. The global bearish trend in oil prices remains in force. Brent oil price decline into the zone below 61.80 (ЕМА200 on the 4-hour chart, ЕМА50 on the daily chart) will mean the resumption of a global downtrend with support at 60.40 (May lows), 58.50, 56.90 (Fibonacci level 50%). The first important signal for the resumption of sales will be the breakdown of support levels 63.00 (ЕМА144 on the daily chart), 62.45 (ЕМА200 on the 1-hour chart). In an alternative scenario, the resumption of growth and the breakdown of the local resistance level of 64.00 will strengthen the bullish momentum and direct the price to resistance levels of 66.10, 67.50. Further price increases are unlikely. Support Levels: 63.60, 63.00, 62.45, 61.80, 60.40, 58.50, 56.90 Resistance Levels: 64.00, 65.10, 67.50 Trading recommendations Sell by market. Stop-Loss 64.30. Take-Profit 63.00, 62.45, 61.80, 60.40, 58.50, 56.90 Buy Stop 64.30. Stop-Loss 62.90. Take-Profit 65.10, 67.00, 67.50 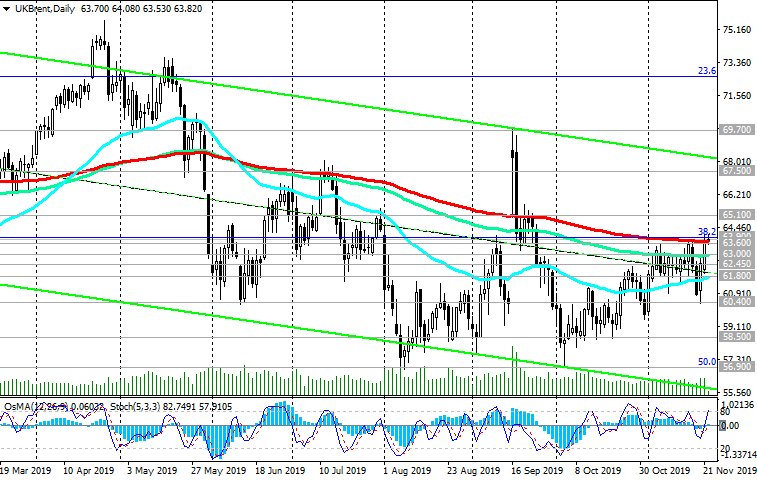  *) For up-to-date and detailed analytics and news on the forex market visit Tifia Forex Broker website tifia.com
|
|
#564
25-11-2019, 10:38
|
||||
|
||||
|
EUR/USD: the euro is vulnerable against the dollar
11/25/2019 Last Friday, the publication of positive US macro data for November supported the dollar. At the beginning of today's European session, DXY dollar index futures are trading at 98.19, 29 pips higher than the closing price last Thursday. The growth of PMIs for purchasing managers for the manufacturing and service sectors, as well as the consumer sentiment index also triggered a decline in demand for defensive assets - gold and government bonds, increasing the tendency of investors to buy risky assets of the US stock market. The final consumer sentiment index of the University of Michigan at the end of November amounted to 96.8 against the October level of 95.5, which is also higher than the forecast of 95.7. American consumers positively assess the prospects for the US economy, which still demonstrates greater stability in the context of international trade conflicts than the economy of other US partner countries. Due to concerns about the state of the Eurozone economy, the euro is unlikely to show significant growth against the US dollar in the near future. Today, regarding the dollar and the euro, the publication of important macro statistics is not planned. This week, investors will follow the publication on Thursday and Friday of inflation indices in Germany and the Eurozone. Meanwhile, EUR / USD continues to decline, trading below key resistance levels of 1.1125 (ЕМА144 on the daily chart), 1.1170 (ЕМА200 on the daily chart). A break into the zone below the local support level of 1.0995 (November lows) is likely to indicate a strengthening of the downward trend with targets at support levels of 1.0940, 1.0900. Any corrective growth of EUR / USD will be limited by resistance levels 1.1125, 1.1170. Long-term negative dynamics of EUR / USD remains. Short positions are preferred. Support Levels: 1.0995, 1.0940, 1.0900 Resistance Levels: 1.1053, 1.1060, 1.1110, 1.1125, 1.1175 Trading Recommendations Sell by market. Stop-Loss 1.1070. Take-Profit 1.0995, 1.0940, 1.0900 Buy Stop 1.1070. Stop-Loss 1.1010. Take-Profit 1.1110, 1.1125, 1.1175 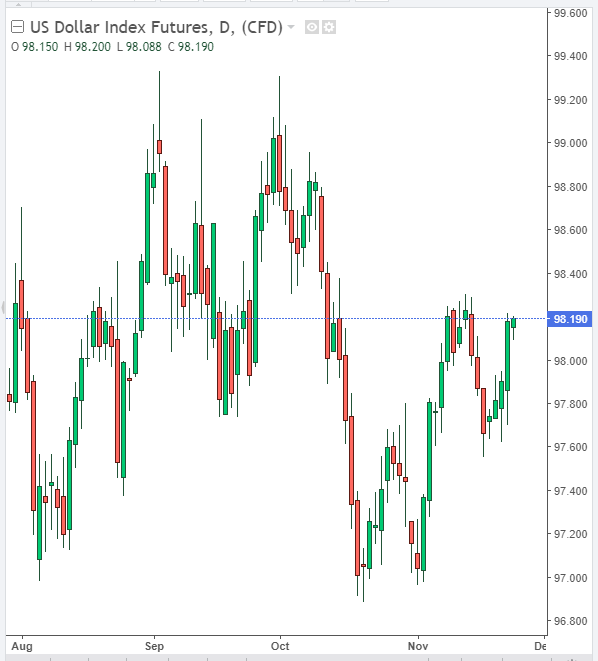 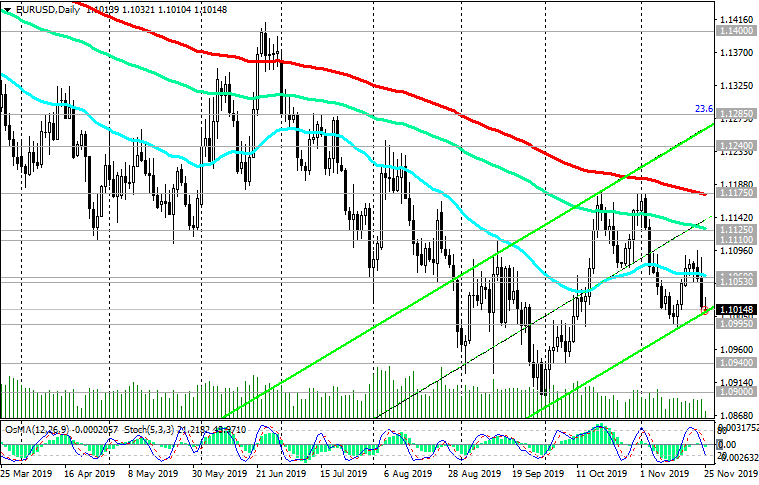 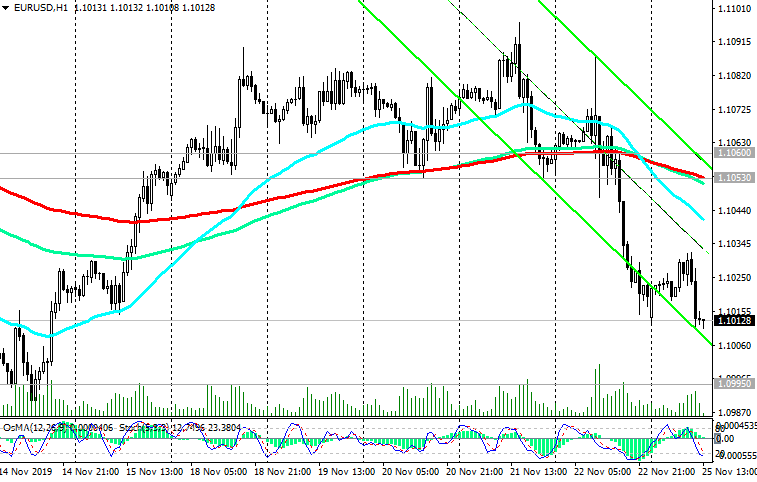 *) For up-to-date and detailed analytics and news on the forex market visit Tifia Forex Broker website tifia.com
|
|
#565
26-11-2019, 12:19
|
||||
|
||||
|
AUD/USD: Current Dynamics
11/26/2019 AUD / USD remains in a long-term downtrend. Disappointing data from the Australian labor market, according to which unemployment rose in October by 0.1%, contributed to a sharp weakening of the Australian dollar and the fall of the pair AUD / USD. OsMA and Stochastic indicators on the weekly and daily charts are on the side of sellers. In case of further decline, the targets will be the support levels of 0.6670 (lows of 2019), 0.6600, 06570 (the lower line of the downward channel on the weekly chart). The distant target is located at support levels of 0.6260, 0.6000 (lows of 2008 - 2009). A signal for the development of an alternative scenario could be a breakdown of the resistance level 0.6802 (ЕМА200 on the 1-hour chart). However, the growth of AUD / USD will be limited by resistance levels of 0.6875 (ЕМА144 on the daily chart), 0.6920 (ЕМА200 on the daily chart). Despite the recent lower interest rates and lower income taxes, consumer confidence in Australia last week fell to its lowest level in more than four years. Consumers' assessment of the future prospects of the Australian economy is currently at the lowest level in the history of this survey. This year, Australia's central bank lowered its key interest rate three times (to the current record low of 0.75%), and markets expect another cut in early 2020. The next RBA meeting on monetary policy will be held next week. It will take place against the backdrop of rising unemployment (up to 5.3% in October), weak GDP growth and declining consumer confidence. If the RBA decides to lower the rate already at this meeting, then AUD is likely to fall under mass sales. RBA managing director Philip Lowe said today that if the key rate is lowered to 0.25%, the issue of quantitative easing will be considered. "There may come a time when quantitative easing will be necessary to support our collective well-being, but that moment has not come yet, and I hope that will not", Lowe said. I hope that other options for state policy will also be included in the agenda, he said. Thus, we should expect further weakening of AUD and the fall of the pair AUD / USD. Support Levels: 0.6745, 0.6700, 0.6670, 0.6600, 0.6300 Resistance Levels: 0.6802, 0.6820, 0.6875, 0.6920 Trading Recommendations Sell by market, Sell Limit 0.6800, 0.6820. Stop-Loss 0.6830. Take-Profit 0.6745, 0.6700, 0.6670, 0.6600, 0.6300 Buy Stop 0.6830. Stop-Loss 0.6770. Take-Profit 0.6870, 0.6900  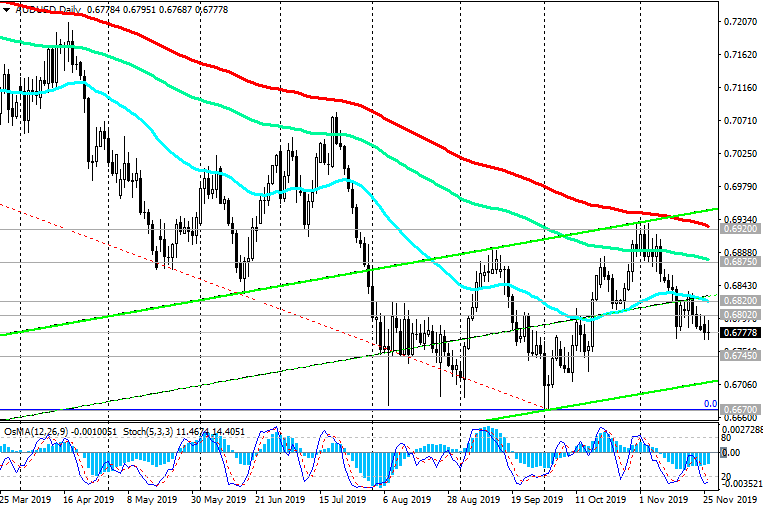  *) For up-to-date and detailed analytics and news on the forex market visit Tifia Forex Broker website tifia.com
|
|
#566
27-11-2019, 10:56
|
||||
|
||||
|
XAU/USD: Current Dynamics
11/27/2019 Against the background of increased expectations of investors in the soon conclusion of a trade agreement between the United States and China, the demand for protective assets, including gold, is declining. According to reports received earlier this month from the Ministry of Commerce of China, if a first phase trade agreement is signed, the parties will cancel duties at the same time and in equal volumes. This news triggered a sharp increase in stock indices and a drop in gold prices. On Tuesday, investor optimism was reinforced by another report by the Chinese Ministry of Commerce that the parties agreed to continue discussion of the remaining issues that need to be agreed upon to conclude a "first phase" deal. At the beginning of the European session on Wednesday, XAU / USD is trading below the important short-term resistance level of 1464.00 (EMA200 on the 1-hour chart). In case of further decline, XAU / USD will go towards the support levels of 1440.00 (ЕМА144 on the daily chart), 1420.00 (ЕМА200 on the daily chart). Above these levels, a long-term bull trend remains. Return to the area above the resistance levels of 1478.00 (ЕМА200 on the 4-hour chart), 1484.00 (Fibonacci level 50% of the correction to the wave of decline since September 2011 and the mark of 1920.00) will create conditions for further growth of XAU / USD. Nevertheless, investors are cautious before Thanksgiving and before the publication of important macro data from the United States today (at 13:30, 14:45, 15:00 GMT), including data on orders for durable goods, the second estimate of GDP for 3- the first quarter and data on applications for unemployment benefits, data on personal income and expenses of Americans, the Chicago Purchasing Managers Index. At 19:00 (GMT) the Fed Beige Book will be published. If the data indicate the stability of the US economy, the dollar will strengthen, and gold prices will come under pressure. Conversely, weak macro data from the United States, as well as new difficulties in the negotiation process between US and Chinese trade representatives, could trigger a fall in stock indices and an increase in demand for gold. The first signal to resume the long XAU / USD positions will be a breakdown of the resistance level of 1464.00. Support Levels: 1440.00, 1420.00, 1380.00, 1368.00, 1310.00, 1253.00 Resistance Levels: 1464.00, 1478.00, 1484.00, 1497.00, 1520.00, 1535.00, 1555.00, 1585.00 Trading Recommendations Sell Stop 1451.00. Stop-Loss 1465.00. Take-Profit 1440.00, 1420.00, 1380.00, 1368.00 Buy Stop 1465.00. Stop-Loss 1451.00. Take-Profit 1478.00, 1484.00, 1497.00, 1520.00, 1535.00, 1555.00, 1585.00 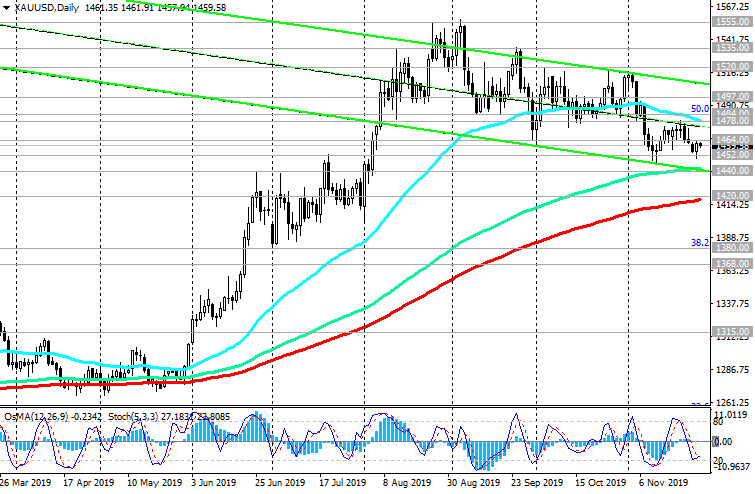 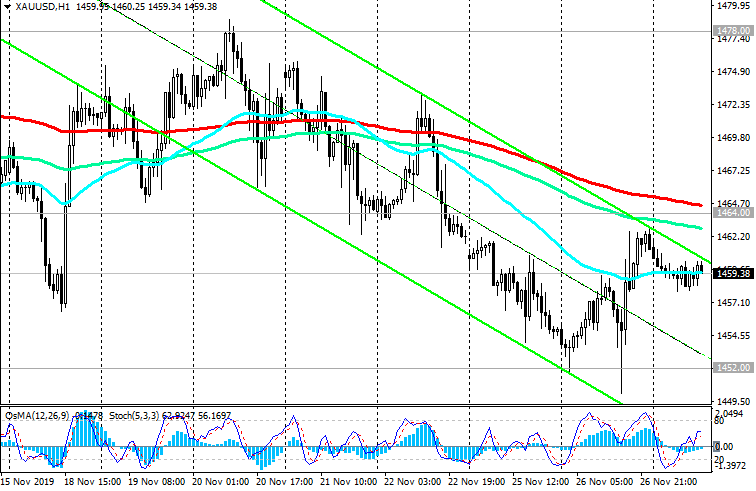 *) For up-to-date and detailed analytics and news on the forex market visit Tifia Forex Broker website tifia.com
|
|
#567
28-11-2019, 10:43
|
||||
|
||||
|
USD/CAD: in the last days of the month
11/28/2019 Today is a day off in the USA (Thanksgiving). US financial markets and banks will be closed, and on Friday, trading will end earlier. In this regard, trading volumes during the US trading session will be low. Meanwhile, the US dollar remains positive. After the publication of a number of positive macro data from the United States on Wednesday, the DXY dollar index reached a local 6-week high near 98.37, while maintaining multi-month positive dynamics. According to official data released on Wednesday, US GDP growth in the 3rd quarter was 2.1% (the initial estimate assumed US GDP growth in the 3rd quarter by 1.9%), mainly due to strong indicators of consumer spending. Rising wages, historically low unemployment and low interest rates in October supported consumer spending, which is about 2/3 of US GDP. Speaking on Monday, Fed Chairman Jerome Powell said that "this growth period has been going on for 11 years and is the longest in US history, so overall economic conditions can be called favorable". The US economy in the current conditions looks more stable compared to other major economies in the world, which will help maintain the demand for US assets and the dollar. Meanwhile, USD / CAD has been growing since the opening of today's trading day. At the beginning of the European session, USD / CAD is trading above the short-term support level 1.3275 (EMA200 on the 1-hour chart) and the important support level 1.3235 (EMA200 on the daily chart), which speaks in favor of purchases of this currency pair. Therefore, you should look for the opportunity to enter long positions, for example, when roll back (lower) to the support level of 1.3275. Above this level of support, long positions are preferred. A breakdown of this level of support will be a signal for sales. In this case, the reduction targets will be the support levels 1.3200, 1.3138 (September lows), 1.3100, 1.3060, 1.3042. Despite the optimism of Bank of Canada managers, many economists believe that the central bank should consider lowering interest rates to prevent the negative economic effects of ongoing trade conflicts. The next meeting of the Bank of Canada will be held on December 4. If at this meeting, the Bank of Canada will signal its intention to lower the rate in the coming months, then the Canadian dollar may come under pressure, which may intensify amid falling oil prices. Support Levels: 1.3275, 1.3235, 1.3200, 1.3138, 1.3100, 1.3060, 1.3042, 1.3015 Resistance Levels: 1.3300, 1.3325, 1.3345, 1.3380, 1.3400, 1.3452 Trading recommendations Sell Stop 1.3250. Stop-Loss 1.3310. Take-Profit 1.3235, 1.3200, 1.3138, 1.3100, 1.3060, 1.3042, 1.3015 Buy Stop 1.3310. Stop-Loss 1.3250. Take-Profit 1.3325, 1.3345, 1.3380, 1.3400, 1.3452 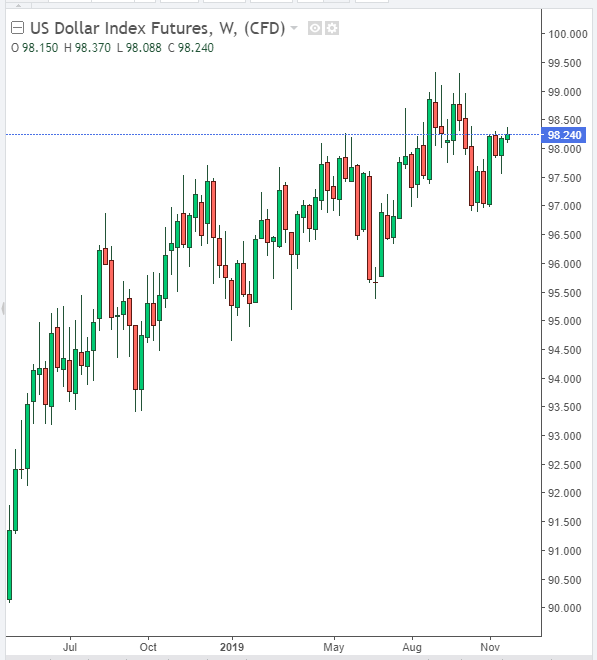 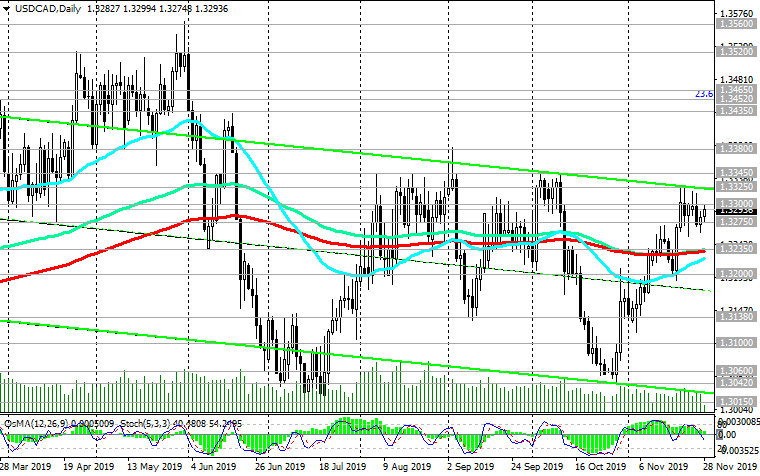 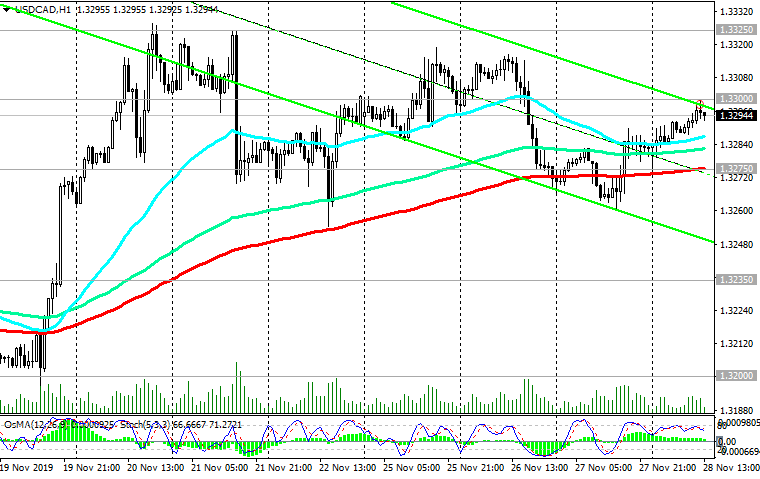 *) For up-to-date and detailed analytics and news on the forex market visit Tifia Forex Broker website tifia.com
|
|
#568
29-11-2019, 10:44
|
||||
|
||||
|
Brent: Strong drivers are needed for price increases
11/29/2019 Expectations of a soon conclusion of a trade agreement between the United States and China contributed to higher prices for commodities, including oil. So, Brent crude oil has risen in price over the past 2 months by almost 6%, reaching $ 64.55 a barrel this week. However, further price growth stopped. The price is trying to gain a foothold in the zone above the key resistance levels 63.70 (ЕМА200 on the daily chart), 63.90 (Fibonacci 38.2% of the downward correction in the wave of price growth from the level near the level of 27.10 to the highs of October 2018 near the mark of 86.60 dollars per barrel). A breakdown of the local resistance level of 64.55 (monthly highs) will strengthen the bullish momentum and will direct the price to resistance levels 65.10, 66.10, 67.50. However, the global downtrend of the price is prevailing. Its further growth is unlikely without strong fundamental drivers. A signal for the resumption of sales will be the breakdown of support levels 63.00 (ЕМА144 on the daily chart), 63.35 (ЕМА200 on the 1-hour chart). The targets for further decline are located at the levels of 60.40 (May lows), 58.50, 56.90 (Fibonacci level of 50%). Continued tensions in international trade relations, as well as significant oil reserves in the United States will put pressure on oil prices in the direction of their decline. A stronger dollar is also putting pressure on oil prices. At the beginning of today's European session, DXY futures are trading near 98.32, 17 pips above the opening price last Monday, staying close to the highs of the last 7 weeks. Support Levels: 63.35, 63.00, 62.30, 61.00, 60.40, 58.50, 56.90 Resistance Levels: 64.00, 64.55, 65.10, 67.50 Trading Recommendations Sell by market. Stop-Loss 64.60. Take-Profit 63.35, 63.00, 62.30, 61.00, 60.40, 58.50, 56.90 Buy Stop 64.60. Stop-Loss 63.30. Take-Profit 65.10, 67.00, 67.50    *) For up-to-date and detailed analytics and news on the forex market visit Tifia Forex Broker website tifia.com
|
|
#569
02-12-2019, 11:27
|
||||
|
||||
|
S&P500: New Year rally continues
12/02/2019 After progress appeared in US-China trade negotiations, growth in the US stock market accelerated. According to statements by the Ministry of Commerce of China made last month, the parties "agreed to properly resolve key issues and confirmed that the technical consultations on some parts of the text of the agreement have basically been completed". Last week, US President Donald Trump signed law to support protesters in Hong Kong, but China refrained from retaliation. The parties are still set to sign a trade agreement. Trump is likely to also refrain from introducing December 15 previously announced new import duties on Chinese goods. On Monday, world and US stock indices received additional support after the publication of positive macro data, indicating that the second largest economy in the world continues to grow, despite a trade conflict with the United States. So, the Procurement Managers Index (PMI) for China's manufacturing sector according to Caixin in November rose to 51.8 from 51.7 in October. The indicator is growing above level 50, signaling an increase in demand for Chinese goods. US stock indices are rising, rewriting absolute highs and continuing New Year's rally. At the beginning of the European session on Monday, the S&P 500 is trading near the 3155.0 mark, the Dow Jones Industrial Average - near the 28200.0 mark, and the Nasdaq100 - near the 8450.0 mark. Trading above the key support level of 2940.0 (EMA200 on the daily chart), as well as the level of 2962.0 (Fibonacci level 23.6% of the correction to the growth since December 2018 and the level of 2335.0), S&P500 maintains a long-term positive dynamics. Long positions are preferable, and above support levels 3130.0 (ЕМА200 on the 1-hour chart), 3078.0 (ЕМА200 on the 4-hour chart) purchases look safe. Support Levels: 3130.0, 3078.0, 3028.0, 2962.0, 2940.0, 2845.0 Resistance Levels: 3157.0 Trading recommendations Sell Stop 3128.0. Stop-Loss 3158.0. Objectives 3078.0, 3028.0, 2962.0, 2940.0 Buy Stop 3158.0. Stop-Loss 3128.0. Objectives 3150.0, 3200.0  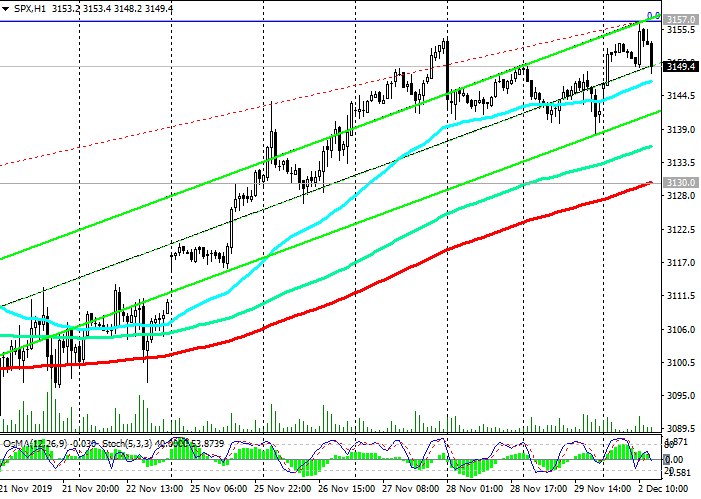 *) For up-to-date and detailed analytics and news on the forex market visit Tifia Forex Broker website tifia.com
|
|
#570
03-12-2019, 12:18
|
||||
|
||||
|
NZD/USD: Current Dynamics
12/03/2019 According to the US Institute for Supply Management (ISM) on Monday, the manufacturing PMI index fell to 48.1 in November from 48.3 in October (the forecast was 49.2). The manufacturing sector does not have such a significant effect on US GDP as consumer spending. However, it is an important indicator of the state of the American economy as a whole. Index values below 50 indicate a decline in activity. At the same time, the value of the manufacturing PMI below this mark has been observed for the fourth month in a row. New manufacturers were pressured by new import duties and uncertainty over the US-China trade dispute. The DXY dollar index reached a new 7-week high last Friday near 98.50. However, on Tuesday, the DXY index is down for the second day in a row. At the beginning of today's European session, futures on the DXY dollar index was trading near 97.75, 45 points below the closing price last Friday. This week, investors will be waiting for the publication of data on the US services sector (on Wednesday at 14:45 and 17:00 GMT), as well as a report on employment by the Department of Labor (on Friday at 13:30 GMT). In general, strong data are expected from the US labor market. At the same time, unemployment remained at a multi-year low of 3.6%. If the data is confirmed or is better than the forecast, then the US dollar will quickly catch up. In the first half of the trading day on Tuesday, NZD strengthened, and the NZD / USD pair rose, and for the second day in a row. At the beginning of the American session, NZD / USD is trading near the 0.6512 mark, through which the key resistance level passes (ЕМА200 on the daily chart). At 0.6545, there is another strong long-term resistance level (EMA50 on the weekly chart). To pass these strongest levels, the NZD / USD pair needs additional drivers. If positive macro data begins to arrive from the USA, then NZD/USD can rebound from current levels and return into the global downtrend. Below the support level of 0.6465 (EMA144 on the daily chart) short positions will again become relevant. * Support Levels: 0.6465, 0.6440, 0.6400, 0.6322, 0.6260, 0.6200, 0.6100 Resistance Levels: 0.6512, 0.6545 Trading Scenarios Sell Stop 0.6490. Sell Limit 0.6545. Stop-Loss 0.6610. Take-Profit 0.6465, 0.6440, 0.6400, 0.6322, 0.6260, 0.6200, 0.6100 Buy Stop 0.6610. Stop-Loss 0.6490. Take-Profit 0.6700, 0.6790 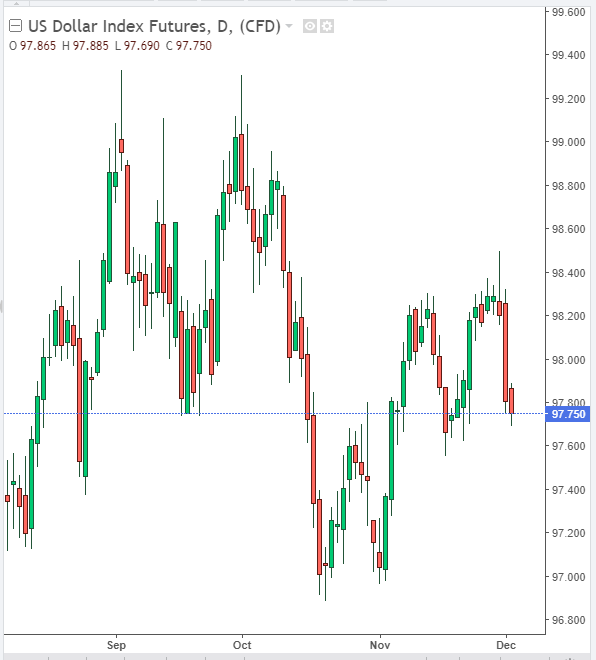  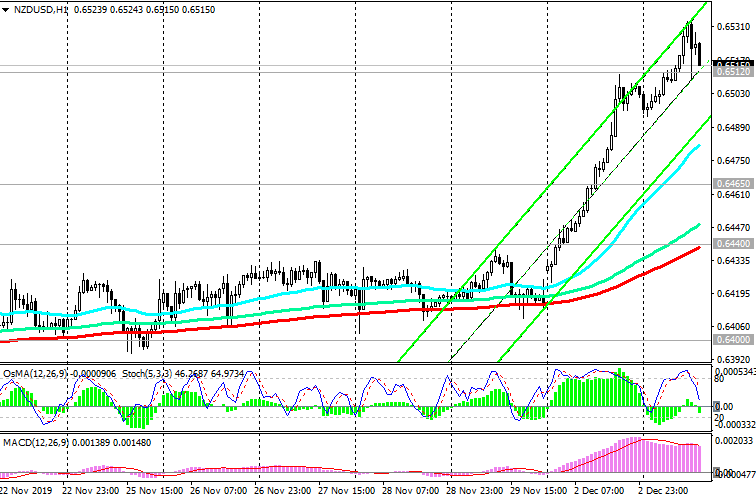 *) For up-to-date and detailed analytics and news on the forex market visit Tifia Forex Broker website tifia.com
|
|
#571
04-12-2019, 12:16
|
||||
|
||||
|
USD/CAD: will the Bank of Canada reduce the rate?
12/04/2019 Bank of Canada managing director Stephen Poloz said last month that the central bank is pursuing the right policy, given the current uncertainty about how global negative factors will affect the country's economy. "We believe that monetary policy is in line with the current situation", said the head of the Bank of Canada, and "remains largely stimulating", he added. In his opinion, the overall economic situation in Canada is favorable, although trade conflicts harm Canadas exports and the investment of Canadian companies. During 2019, the Bank of Canada kept the key rate at 1.75%, and according to the majority of financial market participants, at its meeting on Wednesday, the central bank will leave the key interest rate unchanged, at 1.75%. According to the economic advisers of the central bank, the easing of monetary policy could provoke credit growth and lead to overheating of real estate markets in the country, especially in large cities. At the same time, there is an opinion that the central bank should nevertheless consider reducing interest rates in order to prevent the negative economic consequences of the current trade conflicts. Last Tuesday, US President Donald Trump signaled that a trade war with China would continue next year. Trump said he has no deadline to conclude a trade agreement with China, and he likes the idea of waiting until the election. Reducing the likelihood of a soon deal may put pressure on commodity prices and commodity currencies quotes, in particular the Canadian dollar. If, on the part of the Bank of Canada, signals are sent today aimed at easing monetary policy in the short term, the Canadian dollar could drop sharply. The decision on the rate will be published at 15:00, and at 16:15 (GMT) a press conference will begin, during which the head of the Bank of Canada Stephen Poloz will explain the position of the bank and give an assessment of the current economic situation in the country. Meanwhile, USD / CAD broke through the short-term support level 1.3286 on Wednesday (EMA200 on the 1-hour chart) and is developing a downward trend towards the key support level 1.3238 (EMA200 on the daily chart). In case of breakdown and a further decrease in USD / CAD, the targets will be support levels 1.3200, 1.3138 (September lows), 1.3100, 1.3060, 1.3042. If the Bank of Canada today shows a tendency to soft monetary policy, then USD / CAD will resume growth, and a breakdown of the resistance level of 1.3286 will signal a resumption of long positions. Support Levels: 1.3238, 1.3200, 1.3138, 1.3100, 1.3060, 1.3042, 1.3015 Resistance Levels: 1.3286, 1.3300, 1.3325, 1.3345, 1.3380, 1.3400, 1.3452 Trading Scenarios Sell by market. Stop-Loss 1.3305. Take-Profit 1.3238, 1.3200, 1.3138, 1.3100, 1.3060, 1.3042, 1.3015 Buy Stop 1.3305. Stop-Loss 1.3270. Take-Profit 1.3325, 1.3345, 1.3380, 1.3400, 1.3452  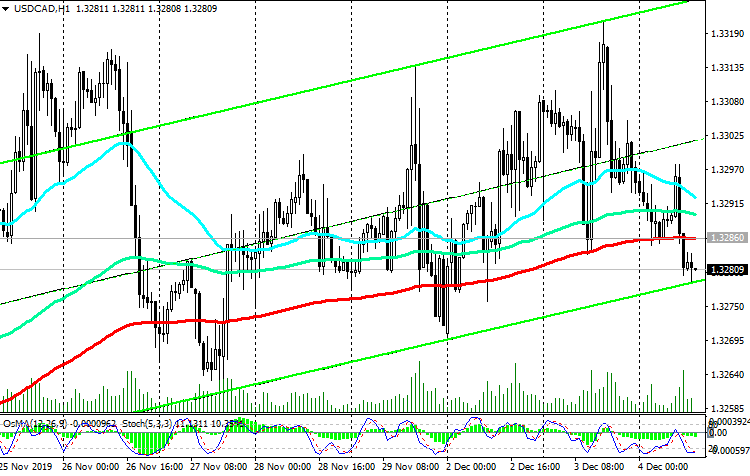 *) For up-to-date and detailed analytics and news on the forex market visit Tifia Forex Broker website tifia.com
|
|
#572
05-12-2019, 11:06
|
||||
|
||||
|
Brent: prices rise again
12/05/2019 Oil prices rose sharply again on Wednesday amid positive reports regarding the course of trade negotiations between the US and China and in anticipation of the outcome of the OPEC meeting. Bloomberg announced that the United States and China are close to concluding a preliminary trade agreement, which may be signed as early as December 15. This deal could spur oil demand. Oil quotes also rose thanks to data from the US Energy Information Administration (EIA), published on Wednesday, according to which oil reserves fell by 4.856 million barrels last week (against the forecast of -1.734 million barrels). ICE Brent crude futures rose 3.6% to $ 63 a barrel, and today, prices continue to rise. At the beginning of today's European trading session, Brent crude is trading at $63.90 a barrel. The price again makes an attempt to gain a foothold in the zone above the key resistance levels 63.70 (ЕМА200 on the daily chart), 63.90 (Fibonacci 38.2% level of the downward correction in the wave of price growth from a level near the level of 27.10 to the highs of October 2018 near the level of 86.60 dollars per barrel) . On Friday (at 18:00 GMT) the next weekly report of Baker Hughes will be published. If he again indicates a decrease in the number of active drilling rigs, this could give a new positive impetus to prices. A breakdown of the local resistance level of 64.55 (monthly highs) will strengthen the bullish momentum and direct the price to the nearest resistance levels of 65.10, 66.10, 67.50. Nevertheless, despite the growth, in general, the global downtrend of prices prevails. A signal for resuming sales will be a breakdown of the support level of 63.00 (ЕМА144 on the daily chart and ЕМА200 on the 1-hour chart). Support Levels: 63.70, 63.00, 62.35, 61.00, 60.40, 58.50, 56.90 Resistance Levels: 64.00, 64.55, 65.10, 67.50 Trading Recommendations Sell Stop 63.30. Stop-Loss 64.60. Take-Profit 62.35, 61.00, 60.40, 58.50, 56.90 Buy Stop 64.60. Stop-Loss 63.30. Take-Profit 65.10, 67.00, 67.50  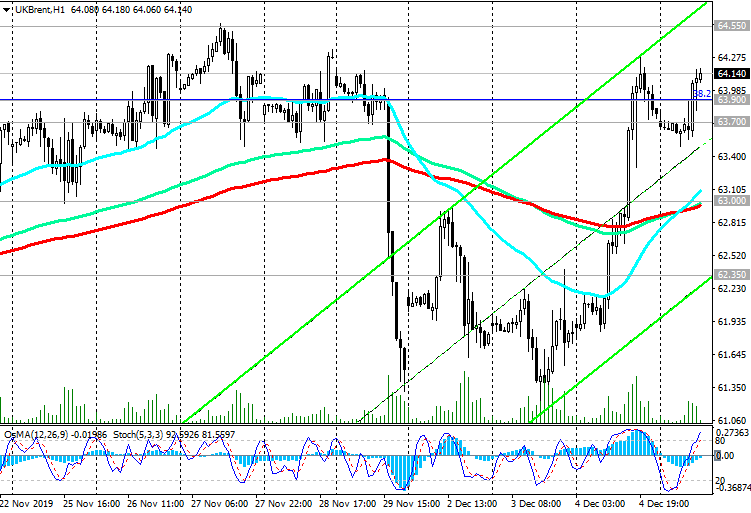 *) For up-to-date and detailed analytics and news on the forex market visit Tifia Forex Broker website tifia.com
|
|
#573
06-12-2019, 10:33
|
||||
|
||||
|
USD/CAD: on the eve of NFP publication and unemployment data
12/06/2019 Last Wednesday, the Bank of Canada left the key interest rate unchanged, signaling that additional monetary stimulus could be implemented in the foreseeable future. Further decisions regarding rates will depend on the banks assessment of the negative impact of trade conflicts on the sources of stability of the Canadian economy, the bank said in a statement. The pair USD / CAD fell sharply after the decision of the Bank of Canada not to change the monetary policy. Having broken through the key support level of 1.3235 (EMA144 and EMA200 on the daily chart), USD / CAD continues to decline towards the lower border of the range located between the levels of 1.3138 and 1.3345. A breakdown of the support levels 1.3042, 1.3015, corresponding to annual minimums, and a decrease to the area below the support level 1.2920 (EMA200 on the weekly chart) will indicate a break in the long-term bullish trend of USD / CAD. In an alternative scenario, and after returning to the zone above the resistance level 1.3235, long positions will become relevant again. On Friday, investors will be waiting for the publication of employment reports by the US and Canadian Department of Labor (at 13:30 GMT). Strong data expected in the USA. At the same time, unemployment remained at a multi-year low of 3.6%. Unemployment stays at current levels for 20 consecutive months. This is the longest period since the 1960s. The Fed is guided by the level of inflation, GDP and the state of the labor market, which remains a bright spot against the general background. In Canada, unemployment in October was 5.5%. If unemployment rises, the Canadian dollar will decline. If the data turn out to be better than the previous value, the Canadian dollar will strengthen. A decrease in unemployment is a positive factor for the currency, an increase in unemployment is a negative factor. Thus, during the publication of data from the US and Canadian labor markets (at 13:30 GMT), a sharp increase in volatility is expected in the financial market, especially in the USD / CAD pair. Support Levels: 1.3138, 1.3100, 1.3060, 1.3042, 1.3015 Resistance Levels: 1.3235, 1.3286, 1.3300, 1.3325, 1.3345, 1.3380, 1.3400, 1.3452 Trading Recommendations Sell Stop 1.3150. Stop-Loss 1.3210. Take-Profit 1.3138, 1.3100, 1.3060, 1.3042, 1.3015 Buy Stop 1.3210. Stop-Loss 1.3150. Take-Profit 1.3235, 1.3300, 1.3325, 1.3345, 1.3380, 1.3400, 1.3452 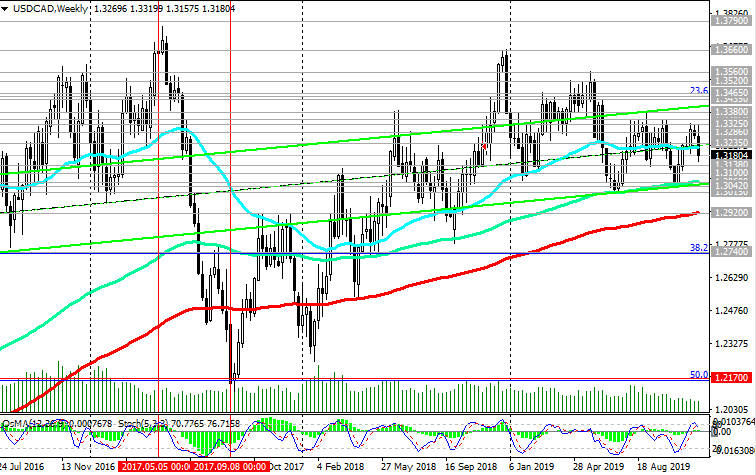 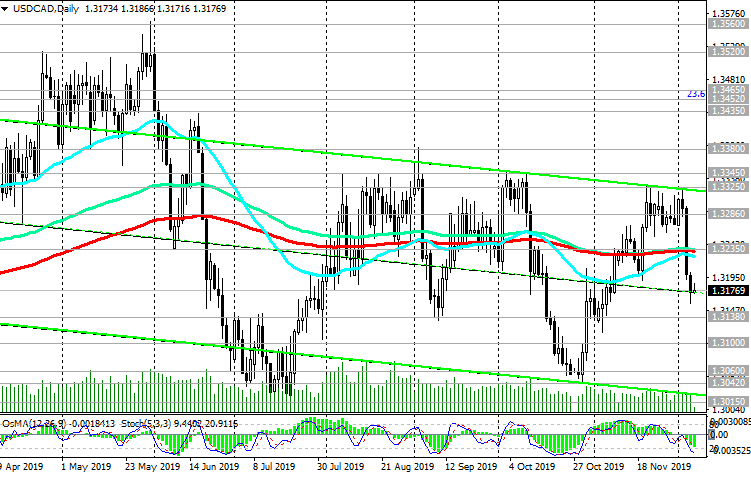 *) For up-to-date and detailed analytics and news on the forex market visit Tifia Forex Broker website tifia.com
|
|
#574
09-12-2019, 10:27
|
||||
|
||||
|
XAU/USD: a tendency to further decline remains
12/09/2019 Last Friday, the price of gold was under pressure after the publication by the US Department of Labor of data according to which in November 266,000 jobs were added (against the forecast of +180,000 and +156,000 in October) outside the US agriculture. At the same time, the unemployment rate fell to 3.5% from 3.6%, the minimum since 1969. At the end of the trading day on Friday, gold was trading at $ 1,461 an ounce. Also, pressure on gold prices in the short term will be provided by the information on progress in the development of a trade agreement between the United States and China. Earlier, Donald Trump threatened to introduce on December 15 a new series of protective duties that will affect Chinese goods worth about $ 156 billion. Neither side is interested in disrupting the negotiations, which will inevitably be followed by another round of escalation of the trade conflict. Investors hope that countries will be able to sign an agreement before December 15, when new customs duties on Chinese goods when they are imported into the United States, must be entered into force. Another disruption of the trade agreement between the United States and China or weak macro data from the United States could trigger a fall in world stock indices and higher gold prices. Also, this week will be the next Fed meeting. Earlier, the central bank said that monetary policy is likely to remain unchanged in December. If the Fed signals an intention to maintain current policy unchanged, then gold is likely to continue to remain under pressure, given the prospect of a trade agreement between the United States and China, as well as strong macro data from the United States. At the beginning of the European session on Monday, XAU / USD is trading below important short-term resistance levels of 1467.00 (EMA200 on the 1-hour chart), 1475.00 (EMA200 on the 4-hour chart, EMA50 on the daily chart), while remaining 5 weeks in the range between the levels 1484.00 (Fibonacci level 50% of the correction to the wave of decline since September 2011 and the mark of 1920.00) and 1446.00 (ЕМА144 on the daily chart). The tendency to further decline to the support levels of 1446.00, 1423.00 (EMA200 on the daily chart) remains. Breakdown of support levels of 1380.00 (Fibonacci level 38.2% and highs of 2016), 1368.00 (highs of 2018) can cancel the bullish trend XAU / USD. Support Levels: 1452.00, 1446.00, 1423.00, 1380.00, 1368.00, 1310.00, 1253.00 Resistance levels: 1467.00, 1475.00, 1484.00, 1497.00, 1520.00, 1535.00, 1555.00, 1585.00 Trading Recommendations Sell Stop 1445.00. Stop-Loss 1469.00. Take-Profit 1423.00, 1380.00, 1368.00 Buy Stop 1469.00. Stop-Loss 1445.00. Take-Profit 1475.00, 1484.00, 1497.00, 1520.00, 1535.00, 1555.00, 1585.00 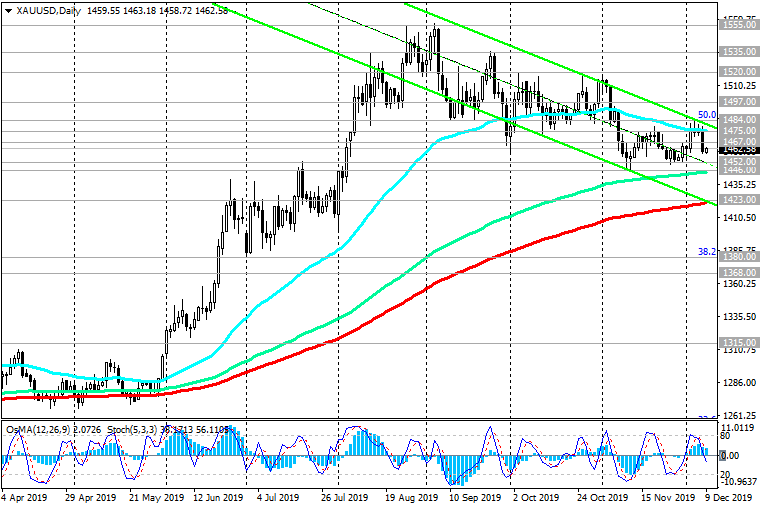  *) For up-to-date and detailed analytics and news on the forex market visit Tifia Forex Broker website tifia.com
|
|
#575
10-12-2019, 11:43
|
||||
|
||||
|
EUR/USD: on the eve of the Fed and ECB meetings
12/10/2019 Despite current growth, the Euro is still vulnerable against the dollar, while EUR / USD remains in a global downtrend. Data released last Friday indicated an increased risk of worsening recession in German industry. Industrial production in October fell by 1.7% compared with the previous month after a decline of 0.6% in September. Compared to October last year, industrial production decreased by 5.3%, and recent polls by economists do not contain any signals that the situation is improving. In the 3rd quarter, Eurozone GDP, according to updated data provided by Eurostat last week, grew by 0.2% (+1.2% in annual terms). Eurozone GDP is also likely to show slight growth in the 4th quarter. However, many economists point out that the risks for the 4th quarter are still biased towards the downside. This week, financial market participants will follow the publication of decisions by the Fed and the ECB at rates on Wednesday (at 19:00 GMT) and on Thursday (at 12:45 GMT), respectively. Bets are likely to remain at current levels. Comments on rate decisions and press conferences by the Fed and the ECB, which will also begin on Wednesday (at 19:30 GMT) and on Thursday (at 13:30 GMT), will be of interest. If the management of the Fed or the ECB signals aimed at changing the monetary policy plans in the near future, then the volatility in the quotations of the dollar and the euro and the pair EUR / USD will increase sharply. Similar press conferences in previous years moved the euro by 3-5%. At the moment, EUR / USD is developing an upward movement above the short-term support levels of 1.1064 (ЕМА200 on the 1-hour chart), 1.1058 (ЕМА200 on the 4-hour chart, ЕМА50 on the daily chart). Nevertheless, the correctional growth of EUR / USD will be limited by the resistance levels of 1.1115 (ЕМА144), 1.1160 (ЕМА200 on the daily chart). In general, the long-term negative dynamics of the EUR / USD pair remains, which speaks in favor of its sales. Support Levels: 1.1064, 1.1058, 1.0995, 1.0940, 1.0900 Resistance Levels: 1.1115, 1.1160 Trading Recommendations Sell Stop 1.1050. Stop-Loss 1.1120. Take-Profit 1.0995, 1.0940, 1.0900 Buy Stop 1.1120. Stop-Loss 1.1050. Take-Profit 1.1155 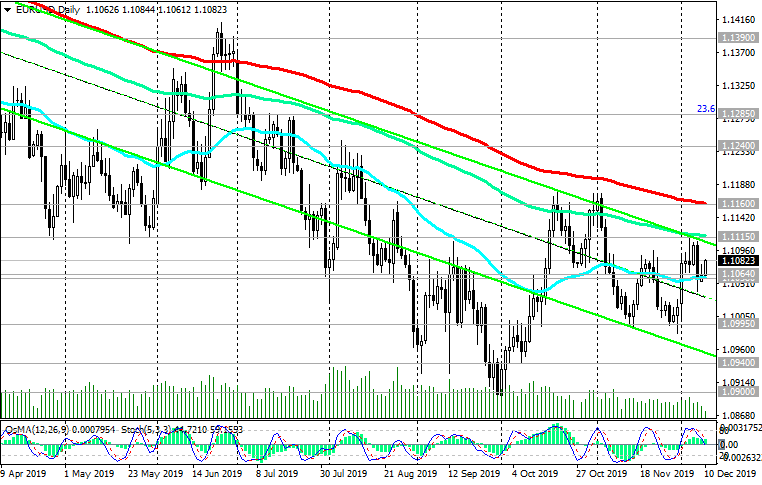 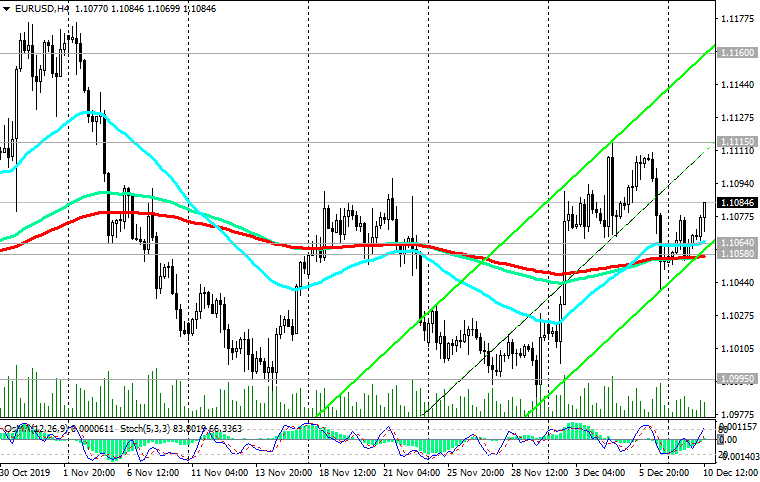 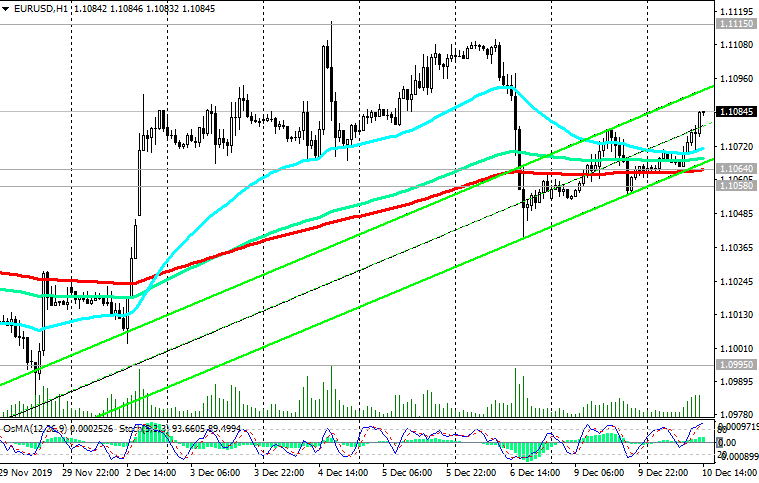 *) For up-to-date and detailed analytics and news on the forex market visit Tifia Forex Broker website tifia.com
|
|
#576
11-12-2019, 11:31
|
||||
|
||||
|
GBP/USD: on the eve of the Fed decision and the British parliamentary elections
12/11/2019 On Thursday in the UK parliamentary early elections will be held. After YouGovs poll came out last Tuesday, which showed conservatives would win the Thursdays election and get a majority in parliament by 28 seats rather than 68, as previously expected, the pound has dropped. Nevertheless, the GBP / USD pair is likely to consolidate at current levels near 1.3150 before the preliminary voting results are released on Thursday. Investors are holding long positions on the pound in the expectation that Prime Minister Boris Johnson will be able to win a majority in parliament. The British economy will probably be able to regain some momentum early next year if Prime Minister Boris Johnson succeeds in negotiating Brexit in parliament or shifting towards a softer Brexit or canceling Brexit. In the campaign, Boris Johnson promised to break Brexits deadlock. Today, investors will wait for the publication (at 19:00 GMT) of the Fed decision on rates. Now the Fed interest rate is at 1.75%. As expected, the central bank will leave the monetary policy unchanged, and the attention of market participants will be riveted to the Fed statement. The Fed press conference will begin at 19:30 (GMT). Fed Chairman Jerome Powell previously called the rate cut this year a mid-cycle correction, which could mean that the central bank could resume raising rates. Strong data on the US labor market published last Friday may convince some Fed leaders and force them to consider raising rates. Therefore, any signals from the Feds leaders about the likelihood of a rate hike in the coming months could trigger a stronger dollar. To break the global bearish trend, GBP / USD must overcome the strongest resistance levels of 1.3340 (EMA200 on the weekly chart), 1.3210 (Fibonacci level 23.6% of the correction to the reduce the GBP / USD pair in a wave that began in July 2014 near the level of 1.7200). Below these resistance levels, preferred are still short long-term positions. The first signal to resume sales will be a breakdown of the local support level 1.3100 and the short-term support level 1.3083 (ЕМА200 on the 1-hour chart). Support Levels: 1.3100, 1.3083, 1.3000, 1.2918, 1.2765, 1.2730 Resistance Levels: 1.3210, 1.3340 Trading Scenarios Sell Stop 1.3070. Stop-Loss 1.3220. Take-Profit 1.3000, 1.2918, 1.2765, 1.2730, 1.2700, 1.2665, 1.2620, 1.2470, 1.2400, 1.2200, 1.2175, 1.2150, 1.2100, 1.2000 Buy Stop 1.3220. Stop-Loss 1.3110. Take-Profit 1.3300, 1.3340 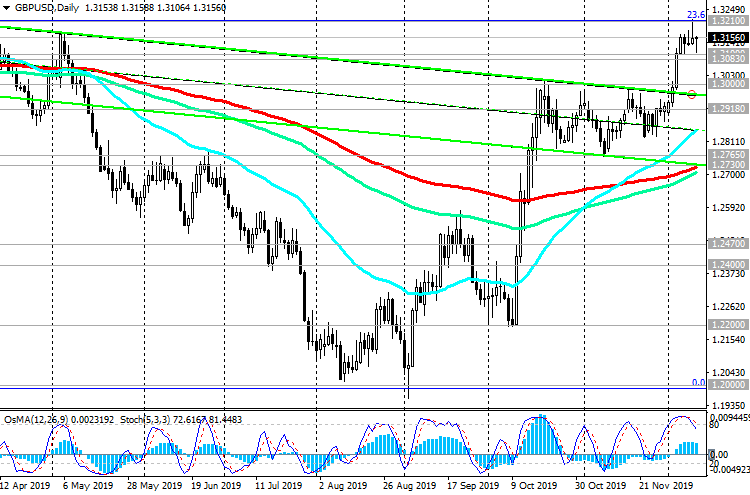  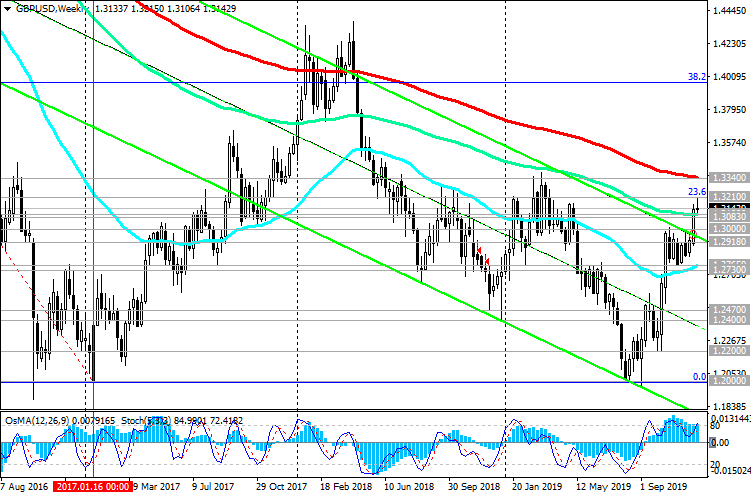 *) For up-to-date and detailed analytics and news on the forex market visit Tifia Forex Broker website tifia.com
|
|
#577
12-12-2019, 10:09
|
||||
|
||||
|
EUR/USD: Current dynamics on the eve of the ECB meeting
12/12/2019 The last Fed meeting this year ended on Wednesday. As expected, no decisions were made by the Fed leadership regarding monetary policy. The rate remained unchanged at 1.75%. Now the financial market participants are waiting for the publication of the decision on interest rates by the ECB. It will be published at 12:45 (GMT). The ECB press conference will begin at 13:30 (GMT). It is widely expected that ECB executives will not make changes to the current monetary policy. However, if they make unexpected statements regarding the current monetary policy, the volatility in the financial markets, primarily in the EUR / USD pair, will increase sharply. Previous macro data provided by Eurostat indicate the need for further support of the European economy by the ECB and the continuation of its extra-soft monetary policy. As you know, at the moment the ECB's basic interest rate is 0%, and the key deposit rate for commercial banks is -0.5%. Many economists point out that the risks to the European economy in the 4th quarter are still biased towards the downside, based on weak data on industrial production and retail sales at the beginning of the 4th quarter. At the same time, EUR / USD remains in a global downtrend, trading below the key resistance level of 1.1160 (ЕМА200 on the daily chart). The current correctional growth of EUR / USD is likely to be limited by this resistance level. The first signal to resume sales will be a breakdown of the support level 1.1115 (EMA144 on the daily chart). After the breakdown of short-term support levels 1.1080 (ЕМА200 on the 1-hour chart), 1.1064 (ЕМА200 on the 4-hour chart, ЕМА50 on the daily chart) the relevance of short positions will increase sharply. A break into the zone below the local support level 1.0995 (November lows) will indicate a strengthening of the downward trend with targets at support levels 1.0940, 1.0900. Support Levels: 1.1115, 1.1080, 1.1064, 1.0995, 1.0940, 1.0900 Resistance Levels: 1.1160 Trading Recommendations Sell Stop 1.1090. Stop-Loss 1.1140. Take-Profit 1.1064, 1.0995, 1.0940, 1.0900 Buy Stop 1.1140. Stop-Loss 1.1110. Take-Profit 1.1160, 1.1200, 1.1240 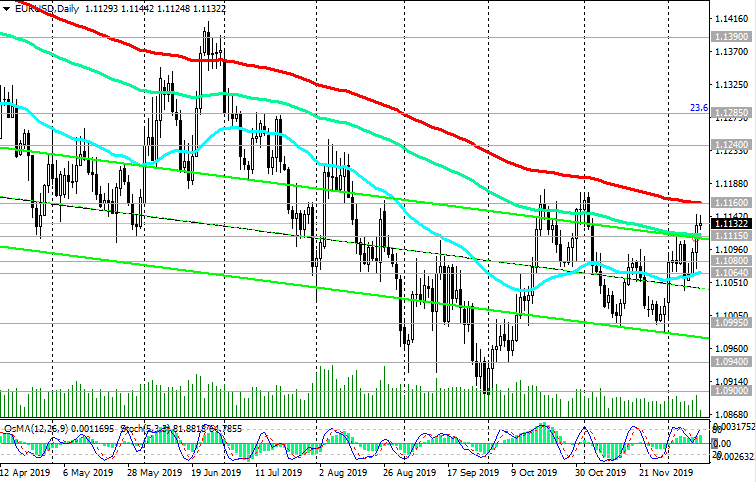 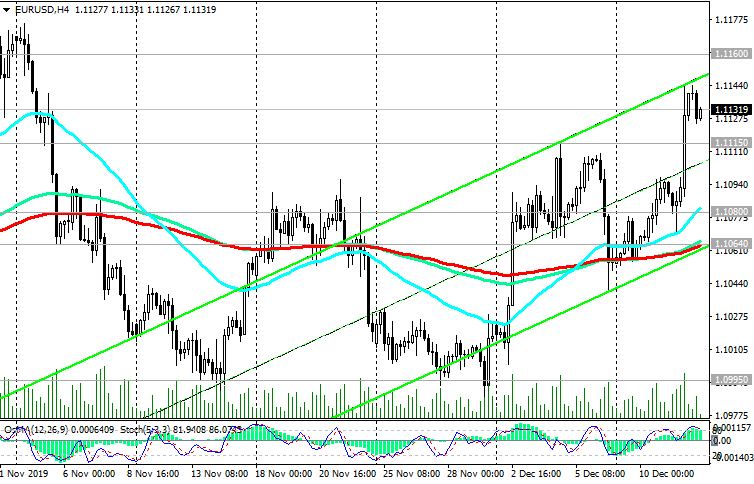 *) For up-to-date and detailed analytics and news on the forex market visit Tifia Forex Broker website tifia.com
|
|
#578
13-12-2019, 10:54
|
||||
|
||||
|
S&P500: positive dynamics of indices
12/13/2019 In the financial markets, optimistic moods are reviving again, associated with increased expectations of a preliminary trade agreement between the US and China. The White House suggested lowering duties on Chinese goods worth about $ 360 billion, as well as repealing the introduction of duties on goods worth $ 156 billion, which was scheduled for Sunday. If China meets this proposal, then, in accordance with the agreement, China must commit itself in 2020 to buy US agricultural products by $50 billion, as well as energy and other goods. As expected, on Friday, US Trade Representative Robert Lighthizer and Chinese Ambassador Tsui Tiankai will sign a draft agreement. We are very close to a big trade agreement with China. They want this, and so do we, Trump tweeted. This news and the high likelihood of a halt in the US-China trade war, as well as the Fed's announcement of its intention to adhere to the current monetary policy (amid low inflation, favorable labor market conditions and price stability) contribute to the growth of world and US stock indices. At the beginning of today's European session, the Dow Jones Industrial Average futures are trading at 28250.0, the NASDAQ100 at 8508.0, the S&P 500 near the new absolute maximum and 3182.0 mark, 36 pips above the opening price at the beginning of the week. The S&P500 index maintains a long-term positive trend, trading above the key support levels of 2962.0 (ЕМА200 on the daily chart), 2982.0 (Fibonacci level 23.6% of the correction to the growth since December 2018 and mark 2335.0). Above the support levels 3139.0 (ЕМА200 on the 1-hour chart), 3100.0 (ЕМА200 on the 4-hour chart) purchases look safe. Long positions are preferred. Support Levels: 3157.0, 3139.0, 3110.0, 3100.0, 3072.0, 3028.0, 2982.0, 2962.0 Resistance Levels: 3182.0 Trading Recommendations Sell Stop 3137.0. Stop-Loss 3158.0. Goals 3110.0, 3100.0, 3072.0, 3028.0, 2982.0, 2962.0 Buy Stop 3183.0. Stop-Loss 3156.0. Goals 3200.0, 3250.0 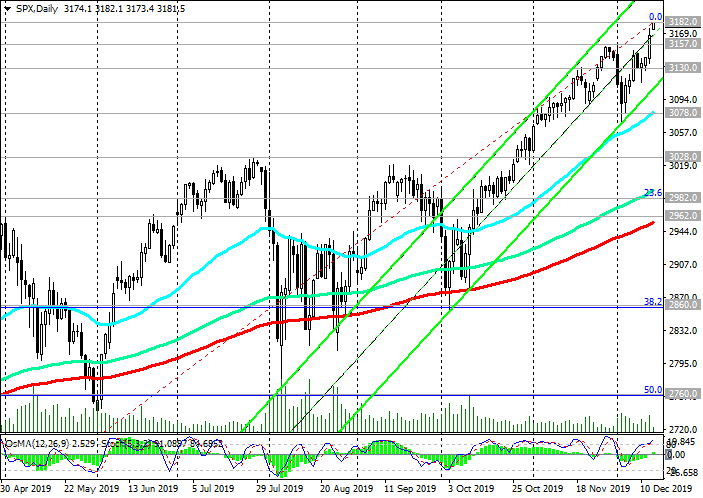 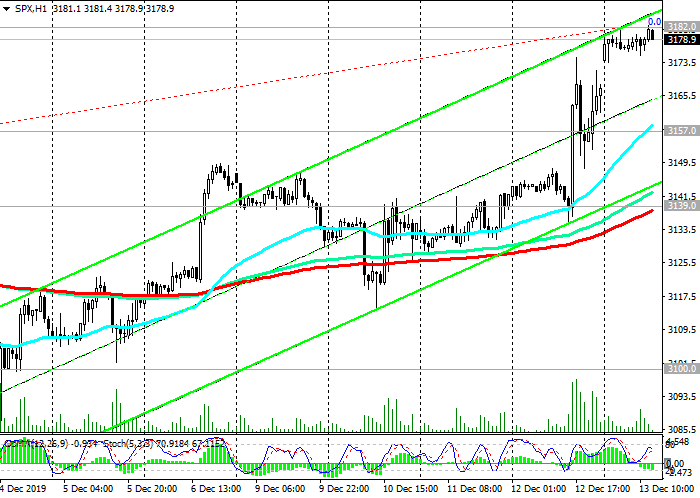 *) For up-to-date and detailed analytics and news on the forex market visit Tifia Forex Broker website tifia.com
|
|
#579
16-12-2019, 11:27
|
||||
|
||||
|
GBP/USD: Conservatives won
12/16/2019 Last Friday, when it became known about the victory of the Conservative Party in parliamentary elections in the UK, the country's Prime Minister Boris Johnson promised to spend billions of pounds and improve the situation in the economy. However, quickly and seriously improve the situation after 3 years of disagreements regarding Brexit, it is unlikely to succeed. Many economists believe the UK economy in 2019 is likely to show the weakest growth since the peak of the financial crisis in 2008. GDP growth is likely to be limited to 1.3%. This is the slowest pace since 2009 compared to 1.4% in 2018. In 2020, it is expected that GDP growth will also remain rather sluggish, no higher than 1.5%, and inflation will remain below the target level of 2%. This week there will be data on inflation, the labor market, GDP, the current account of the balance of payments. However, the focus of investors will be focused on the meeting of the Bank of England on monetary policy, which will be held on Thursday. It is likely that the Bank of England at this meeting, the last in 2019, will maintain its current monetary policy unchanged, but may signal a tendency towards a softer policy. If the Bank of England does indicate the likelihood of a rate cut in 2020, then the pound may again come under pressure, now from a softer monetary policy. As you know, when the interest rate is lowered, the national currency is usually under pressure due to its relative cheapening against other currencies, in particular the dollar. Today at 17:00 (GMT) the Bank of England will present the reports of the Financial Policy Committee with a detailed analysis of the country's financial system. The harsh tone of the report regarding the prospects for the financial sector is a positive factor for GBP. Conversely, the soft tone of the Bank's Committee report demonstrates concern about financial stability, which will negatively affect GBP. Over the past 4 months, the GBP / USD pair has grown by about 10%, and reached a key resistance level of 1.3340 (EMA200 on the weekly chart). Despite a strong positive impulse, it will not be easy for the GBP / USD pair to overcome two resistance levels (1.3340 and 1.3430). The most likely rebound in the zone of these resistance levels and a return to the global downtrend. The first signal for the resumption of GBP / USD sales will be a breakdown of the support level 1.3210 (Fibonacci level 23.6% of the correction to reduce the GBP / USD pair in a wave that began in July 2014 near the level of 1.7200). A short-term level of EMA200 support on the 1-hour chart also passes through this mark. The return of GBP / USD to the zone below the support level of 1.2745 (EMA200 on the daily chart) will indicate the resumption of the bearish trend. An alternative scenario for continued growth will be associated with the breakdown of the local resistance level 1.3510 with targets at resistance levels 1.3960 (Fibonacci level 38.2%), 1.4350 (highs in January and April 2018), 1.4580 (Fibonacci level 50%). Support Levels: 1.3340, 1.3210, 1.3100, 1.3000, 1.2745 Resistance Levels: 1.3510, 1.3960, 1.4350, 1.4580, 1.5080, 1.5190 Trading Scenarios Sell Stop 1.3190. Stop-Loss 1.3260. Take-Profit 1.3100, 1.3000, 1.2745, 1.2700, 1.2665, 1.2620, 1.2470, 1.2400, 1.2200, 1.2175, 1.2150, 1.2100, 1.2000 Buy Stop 1.3520. Stop-Loss 1.3290. Take-Profit 1.3600, 1.3960, 1.4350, 1.4580, 1.5080, 1.5190 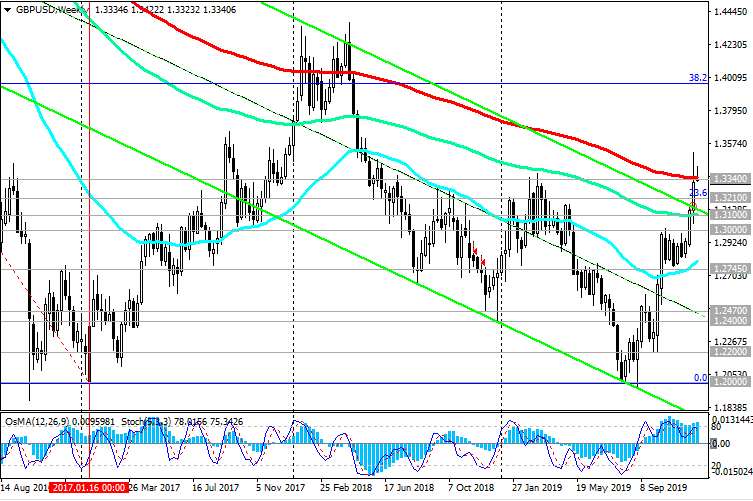 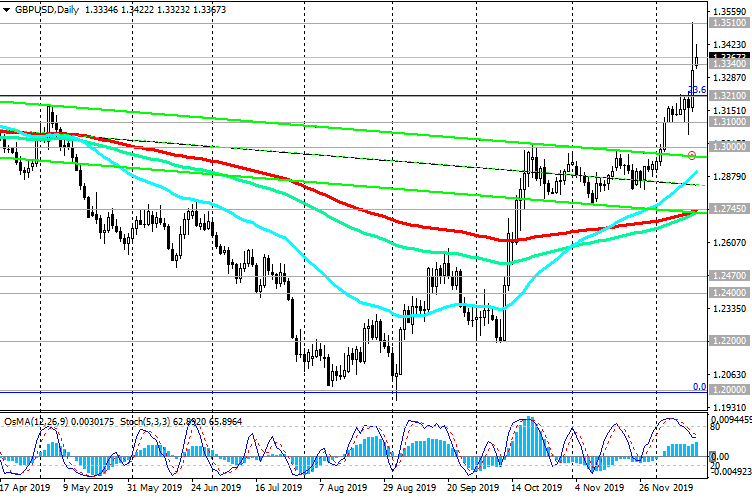 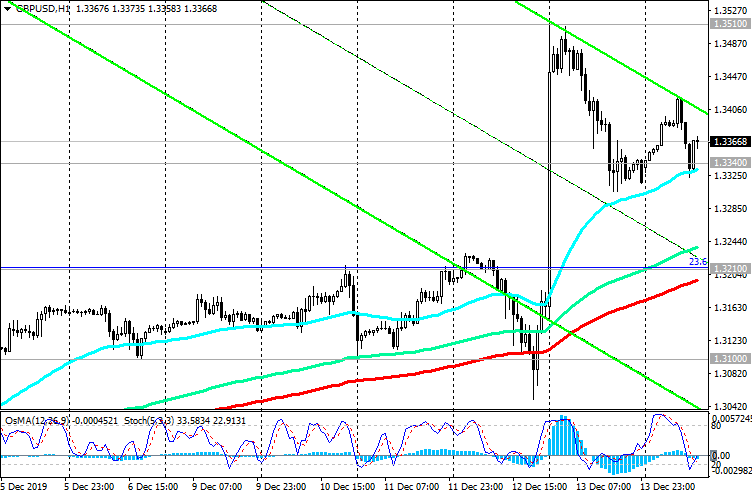 *) For up-to-date and detailed analytics and news on the forex market visit Tifia Forex Broker website tifia.com
|
|
#580
17-12-2019, 12:55
|
||||
|
||||
|
AUD/USD: RBA is ready to lower rates
12/17/2019 The AUD / USD pair broke on Tuesday an important short-term support level of 0.6860 (ЕМА200 on the 1-hour chart) and is developing a downward movement, returning to the global down-trend. Following a meeting in December, the RBA left the key interest rate unchanged, at a record low of 0.75%. Concerns about a sharp slowdown in global economic growth have become one of the main reasons that prompted the RBA to lower interest rates this year. According to the text of the minutes of the meeting of the RBA held on December 3, which were published earlier on Tuesday, the bank's management in February intends to reassess the prospects of monetary policy. RBA Governor Philip Lowe spoke about the "emerging turning point" in the economy. However, the published RBA protocols indicated that the bank was ready to lower rates again if necessary. Weak GDP growth in the 3rd and 4th quarters, remaining low personal consumption and weak retail sales reinforce expectations of a further reduction in interest rates at a meeting of the Reserve Bank of Australia on February 4. This will put downward pressure on AUD. AUD / USD is trading below important resistance levels 0.6912 (ЕМА200 on the daily chart), 0.6869 (ЕМА144 on the daily chart). In the event of a breakdown of the local support level of 0.6802 and a further decrease, the targets will be the support levels of 0.6670 (2019 lows), 0.6600. Below resistance level 0.6860, short positions are preferred. Support Levels: 0.6833, 0.6802, 0.6745, 0.6700, 0.6670, 0.6600, 0.6300 Resistance Levels: 0.6860, 0.6869, 0.6912, 0.6938 Trading Recommendations Sell by market. Stop-Loss 0.6870. Take-Profit 0.6833, 0.6802, 0.6745, 0.6700, 0.6670, 0.6600, 0.6300 Buy Stop 0.6870. Stop-Loss 0.6810. Take-Profit 0.6900, 0.6910 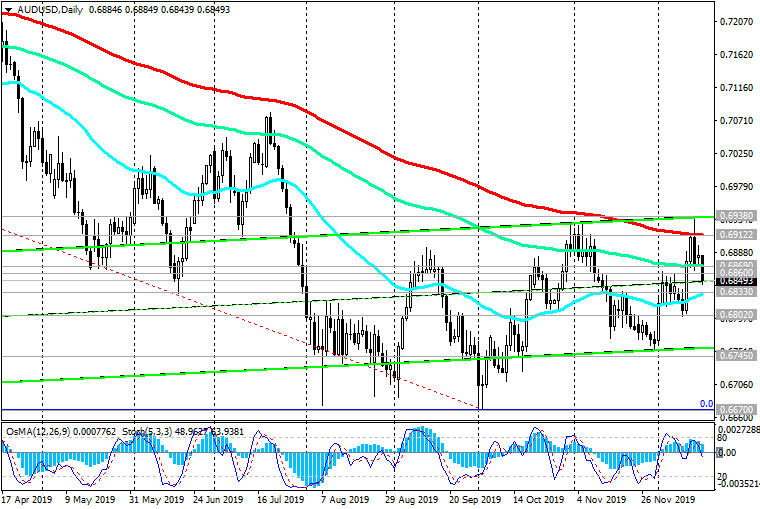 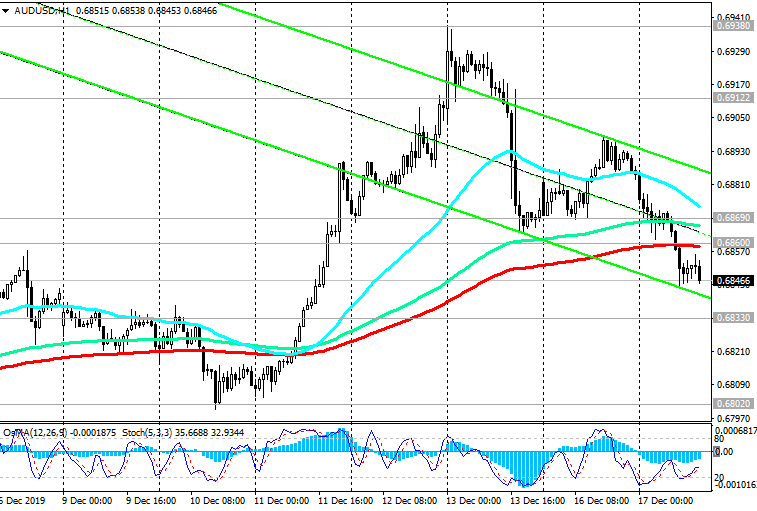 *) For up-to-date and detailed analytics and news on the forex market visit Tifia Forex Broker website tifia.com
|
|
#581
18-12-2019, 11:48
|
||||
|
||||
|
NZD/USD: Current Dynamics
12/18/2019 After the release of weak data from a dairy auction organized by the New Zealand company Fonterra (a specialized trading platform GlobalDairyTrade - GDT) and amid the strengthening of the US dollar, the NZD / USD pair fell. The Dairy Price Index prepared by Global Dairy Trade came out last Tuesday with a value of -5.1% (against the forecast of +0.5% and after a decrease of -0.5% in the previous 2-week period). News of the achievement of an intermediate trade deal between the US and China contributed to the growth of world stock indices and commodity quotes at the beginning of the week. US economic data has also recently eased concerns about a sharp slowdown in global economic growth. At the same time, many investors in the commodity market are cautious because of the abundant supply and continuing risks of an unsuccessful outcome of the upcoming trade negotiations between the US and China. All details of the interim agreement, which has not yet been officially translated and has not been signed, are not yet clear. Some participants in the foreign exchange market consider the current growth in commodity currencies excessive in the framework of the global downtrend, and the closure of long positions may strengthen the rally in the coming days. In particular, this applies to the New Zealand dollar. So far, the NZD / USD pair remains positive dynamics, trading in the upward channel on the daily chart above the important support level of 0.6519 (EMA200 on the daily chart). A breakdown of the local resistance level of 0.6575 can be a signal for continued purchases and an increase in NZD / USD towards the local maximum of 0.6635 and the upper border of the ascending channel on the daily chart and further to the key resistance levels of 0.6770 (EMA144 on the weekly chart), 0.6865 (EMA200 on the weekly chart and Fibonacci level 23.6% of the correction in the global wave of pair decline from the level of 0.8820). An alternative scenario will be associated with the breakdown of the support level of 0.6565 (EMA200 on the 1-hour chart, EMA50 and the bottom line of the ascending channel on the 4-hour chart), which can trigger a decline to the support level of 0.6519 and further to the support level of 0.6485 (EMA200 on the 4-hour chart, ЕМА144 and the bottom line of the ascending channel on the daily chart). A further decline will indicate a resumption of the NZD / USD global downtrend. Support Levels: 0.6565, 0.6555, 0.6519, 0.6485, 0.6440, 0.6400, 0.6322, 0.6260, 0.6200, 0.6100 Resistance Levels: 0.6575, 0.6635, 0.6770, 0.6865 Trading Scenarios Sell Stop 0.6550. Stop-Loss 0.6585. Take-Profit 0.6519, 0.6485, 0.6440, 0.6400, 0.6322, 0.6260, 0.6200, 0.6100 Buy Stop 0.6585. Stop-Loss 0.6550. Take-Profit 0.6635, 0.6770, 0.6865 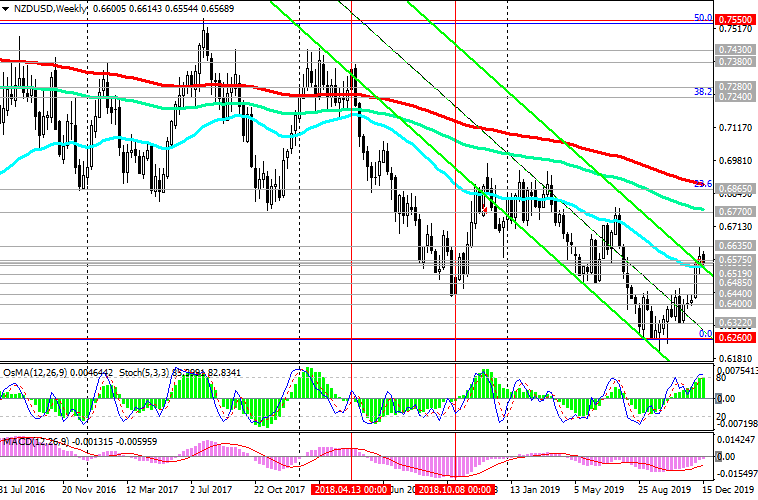 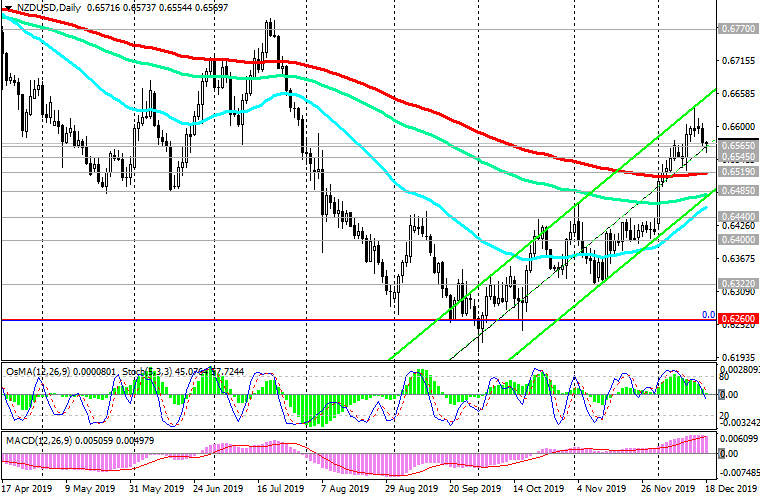 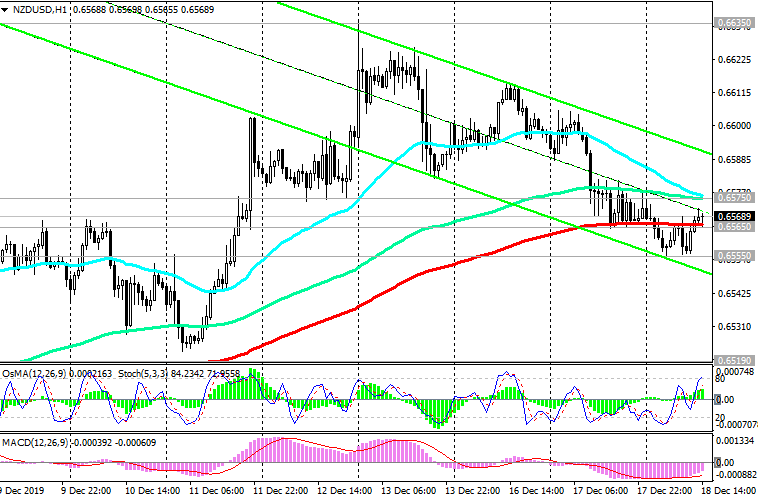 *) For up-to-date and detailed analytics and news on the forex market visit Tifia Forex Broker website tifia.com
|
|
#582
19-12-2019, 10:37
|
||||
|
||||
|
GBP/USD: Bank of England rate decision
12/19/2019 Today at 12:00 (GMT) the decision of the Bank of England on the interest rate will be published. Due to the importance of today's event, a sharp increase in volatility is expected at this time in the foreign exchange market, especially in pound quotes. GBP / USD broke through an important support level of 1.3210 on Tuesday (Fibonacci level 23.6% of the correction to the GBP / USD decline in a wave that began in July 2014 near the level of 1.7200) and a short-term support level of EMA200 on the 1-hour chart. In case of further decline, the immediate goal will be the support level of 1.3010 (ЕМА200 on the 4-hour chart). The Bank of England is expected to maintain its monetary policy today unchanged. However, it may signal the possibility of lowering the key interest rate in the coming months. Inflation remains weak, well below the target level of 2%, and the fiscal stimulus measures promised by the UK government aimed at ensuring robust economic growth are unlikely to be implemented soon. Media reports that conservatives rule out a transitional extension for Brexit could hurt the recovery of investment after the election and increase the risk of a tough Brexit. In addition, the threat of a new referendum on Scottish independence is growing. Given all these negative factors, the Bank of England may be forced to soften its monetary policy in the coming months. The return of GBP / USD to the zone below the support level of 1.2750 (EMA200 on the daily chart) will indicate the resumption of the bearish trend. In case of breakdown of the support level of 1.2750, the aim of lowering for the next 3-4 months will be the support level of 1.2000 (2017 lows and the Fibonacci level of 0%). A signal for the implementation of an alternative scenario will be a growth into the zone above the resistance level of 1.3210. Support Levels: 1.3100, 1.3010, 1.2750 Resistance Levels: 1.3172, 1.3210, 1.3340, 1.3510, 1.3960, 1.4350, 1.4580, 1.5080, 1.5190 Trading Scenarios Sell Stop 1.3190. Stop-Loss 1.3260. Take-Profit 1.3100, 1.3000, 1.2745, 1.2700, 1.2665, 1.2620, 1.2470, 1.2400, 1.2200, 1.2175, 1.2150, 1.2100, 1.2000 Buy Stop 1.3520. Stop-Loss 1.3290. Take-Profit 1.3600, 1.3960, 1.4350, 1.4580, 1.5080, 1.5190  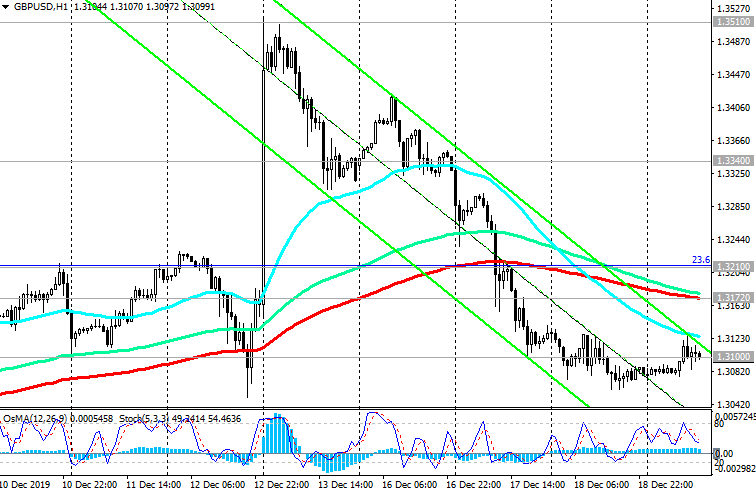 *) For up-to-date and detailed analytics and news on the forex market visit Tifia Forex Broker website tifia.com
|
|
#583
20-12-2019, 11:35
|
||||
|
||||
|
USD/CAD: so far, correction after the fall
12/20/2019 After a many-day decline, the USD / CAD pair entered the correctional phase on Thursday. The weakening Canadian dollar was contributed by the disappointing macro statistics on wholesale trade and supplies to the manufacturing sector of the Canadian economy. According to the National Bureau of Statistics Canada, the volume of wholesale trade in October fell sharply (-1.1%). The data for the previous month were revised downward, to +0.8% versus +1.0% earlier. At the same time, supplies in the manufacturing sector in October fell for the second month in a row (-0.7%) after falling in September by -0.2%. The Canadian dollar reacted negatively to the publication of the data. The Canadian dollar still maintains a positive trend against the US dollar. However, a number of negative macro data from Canada this week could stop the fall of the USD / CAD pair. If positive news about the state of the US economy comes from the US, then the growth of the USD and the pair USD / CAD will resume. Today at 13:30 (GMT) Statistics Canada will publish the retail sales index, which is often considered an indicator of consumer confidence and reflects the state of the retail sector in the near future. Index growth is usually a positive factor for CAD; a decrease in the indicator will negatively affect CAD. If data for October is weaker than the previous value (-0.1%) or forecast (+0.5%), then CAD may drop sharply, given the release of weak macro data on wholesale trade and supplies in Canadas manufacturing sector earlier this week. Thus, at 13:30 (GMT) an increase in volatility is expected in the USD and CAD quotes, and, accordingly, in the USD / CAD pair. In the last 2 days, the USD / CAD pair has been rising after a strong fall before. Breakdown of the short-term resistance level 1.3165 (ЕМА200 on the 1-hour chart) will be a signal for the resumption of long positions. Above the key resistance level of 1.3230 (EMA144 and EMA200 on the daily chart), long positions will again be preferred. In an alternative scenario and in case of breakdown of the support levels 1.3140 and 1.3345, and the lower border of the upward channel on the daily chart, passing near the mark 1.3100, and of further decline, USD / CAD will go to support levels 1.3042, 1.3015, corresponding to annual minimums. A decline into the zone below the support level of 1.2920 (EMA200 on the weekly chart) will indicate a break in the bullish trend of USD / CAD. Support Levels: 1.3100, 1.3060, 1.3042, 1.3015 Resistance Levels: 1.3140, 1.3165, 1.3205, 1.3230, 1.3300, 1.3325, 1.3345, 1.3380, 1.3400, 1.3435 Trading Scenarios Sell Stop 1.3115. Stop-Loss 1.3150. Take-Profit 1.3100, 1.3060, 1.3042, 1.3015 Buy Stop 1.3150. Stop-Loss 1.3115. Take-Profit 1.3165, 1.3205, 1.3230, 1.3300, 1.3325, 1.3345, 1.3380, 1.3400, 1.3435   *) For up-to-date and detailed analytics and news on the forex market visit Tifia Forex Broker website tifia.com
|
|
#584
23-12-2019, 10:23
|
||||
|
||||
|
XAU/USD: Current Dynamics
12/23/2019 After the publication of data on US GDP last Friday, according to which in the 3rd quarter annual growth amounted to 2.1%, and data on personal income / expenses of the Americans, the dollar strengthened and gold futures declined. According to the US Department of Commerce, personal consumption expenditures (household expenses) in November increased by 0.4% compared with October. At the same time, personal income of Americans over this period increased by 0.5%. Expenditure on durable goods increased by 1%. Rising wages and lowering unemployment to 50-year lows stimulated consumer spending this year, which in turn supported the US economy. Gold prices are under pressure from the stabilization of the US economy and amid progress in the course of trade negotiations between Washington and Beijing. And yet, the dollar still can not develop upward momentum at a faster pace, and at the beginning of the new week, the DXY dollar index is falling. Washington and Beijing are expected to sign an interim trade agreement (of first phase) in January, but the uncertainty about the details of the deal adds uncertainty to the ranks of buyers of risky assets and supports safe haven assets. U.S. political uncertainty surrounding President Donald Trumps impeachment, which was announced by the House of Representatives on Wednesday, also boosts gold prices at the start of a new Christmas week. The pair XAU / USD is trading at the beginning of the European session near the mark of 1484.00, which corresponds to 6-week highs. Above the support levels of 1450.00, 1428.00 (EMA200 on the daily chart), the long-term positive dynamics of XAU / USD remains. A break into the zone above the resistance level of 1484.00 (Fibonacci level 50% of the correction to the wave of decline from September 2011 and the mark of 1920.00) will resume the bullish trend XAU / USD. In an alternative scenario, the breakdown of the short-term support level of 1475.00 (EMA200 on the 1-hour chart, EMA50 on the daily chart) will be a signal for XAU / USD sales with targets at the support levels of 1450.00, 1428.00. From the news for today it is worth paying attention to the publication at 13:30 (GMT) of a block of macro data from the United States, including data on orders for capital goods for November. The indicator reflects the value of orders received by manufacturers of capital goods, implying large investments. Forecast for November: -0.3%. The dollar is likely to decline after the publication of data. Data better than forecast will strengthen the dollar in the short term. Support Levels: 1475.00, 1450.00, 1428.00, 1380.00, 1368.00, 1310.00, 1253.00 Resistance Levels: 1484.00, 1497.00, 1520.00, 1535.00, 1555.00, 1585.00 Trading Recommendations Sell Stop 1469.00. Stop-Loss 1487.00. Take-Profit 1450.00, 1428.00 Buy Stop 1487.00. Stop-Loss 1469.00. Take-Profit 1497.00, 1520.00, 1535.00, 1555.00, 1585.00 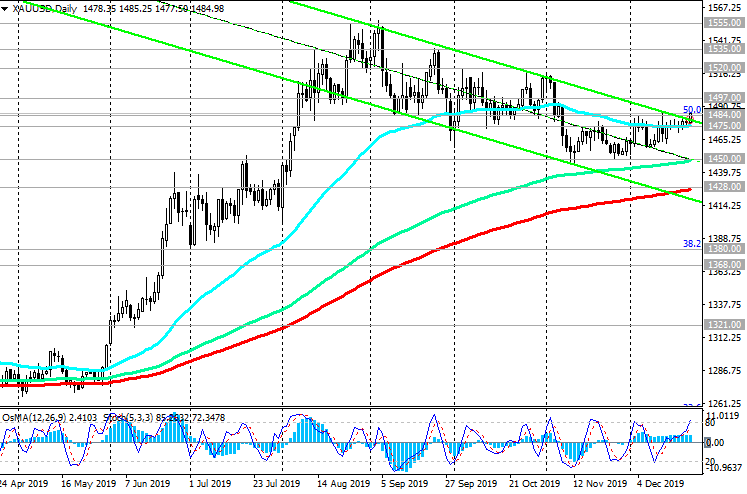 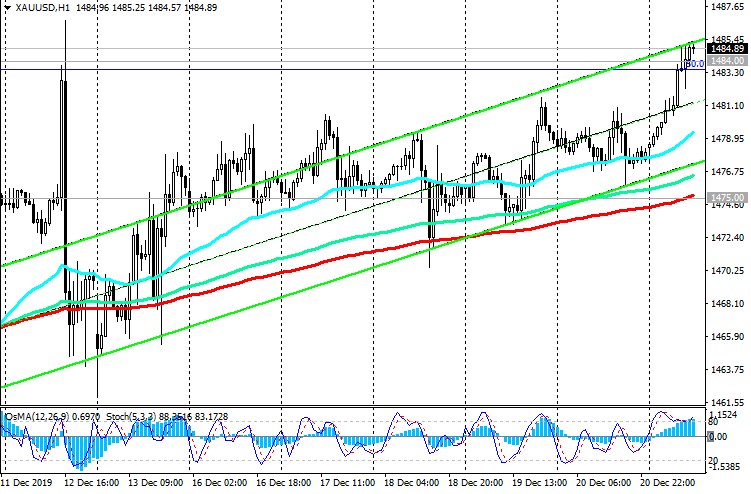 *) For up-to-date and detailed analytics and news on the forex market visit Tifia Forex Broker website tifia.com
|
|
#585
24-12-2019, 10:11
|
||||
|
||||
|
S&P500: positive dynamics continues
12/24/2019 Major US stock indices Dow Jones Industrial Average, Nasdaq Composite and S&P 500 finished trading last Monday at historic highs. After futures for US stock indexes continued on Monday the recent series of growth, today they are trading in a very narrow range: S&P 500 - near 3225.0, Nasdaq100 - near 8702.0, DJIA - near 28570.0. The S&P500 index maintains long-term positive dynamics, trading above key support levels of 2978.0 (ЕМА200 on the daily chart), 3018.0 (ЕМА144 on the daily chart and Fibonacci level 23.6% of the correction to the growth since December 2018 and 2335.0). Probably, after the breakdown of the local resistance level 3229.0, the S&P500 will continue to grow. In an alternative scenario and after the breakdown of support levels 3193.0 (ЕМА200 on the 1-hour chart), 3135.0 (ЕМА200 on the 4-hour chart) S&P500 will go to support levels 3018.0, 2978.0. Long positions are preferred so far. Trading volume on European and American stock markets today will be small. Most exchanges are either closed or shut down early on the eve of the holiday. Market volatility will return on December 26 - 27, and will fully recover after the New Year holidays. Support Levels: 3193.0, 3157.0, 3135.0, 3100.0, 3018.0, 2978.0 Resistance Levels: 3229.0 Trading recommendations Sell Stop 3190.0. Stop-Loss 3131.0. Goals 3157.0, 3135.0, 3100.0, 3018.0 Buy Stop 3131.0. Stop-Loss 3190.0. Goals 3200.0, 3250.0 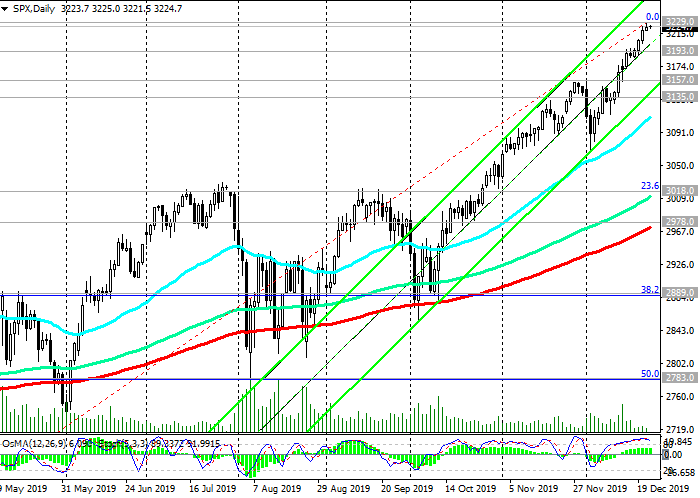  *) For up-to-date and detailed analytics and news on the forex market visit Tifia Forex Broker website tifia.com
|
|
#586
26-12-2019, 10:35
|
||||
|
||||
|
DJIA: rally may continue in the new year
12/26/2019 The US stock market is dominated by positive dynamics. US stock indexes end the year with the best results in the last 6 years. The S&P 500 gained almost 29% this year, DJIA - 24%, moreover, shares rose in almost all sectors. Investors are also mostly optimistic about the prospects for the stock market in 2020. In Europe and some other countries continue to celebrate Christmas. Trading volumes are likely to recover after January 6th. Meanwhile, the uncertainty about the details of the deal between the US and China is fueling some uncertainty among investors. At the same time, the exact form of future trade relations between the UK and the EU is unclear. In addition, the risk of another Scottish independence referendum is growing. Expectations of further growth in stock indices speak in favor of DJIA purchases. In an alternative scenario, after the breakdown of the short-term support level of 28330.0 (ЕМА200 on the 1-hour chart) and in case of resumption of decline, the targets will be support levels 27950.0 (ЕМА200 on the 4-hour chart), 27100.0 (ЕМА144 on the daily chart), 26800.0 (ЕМА200 on the daily chart ) The breakdown of support level 26800.0 may provoke a further decrease to support levels 25500.0 (Fibonacci level of 23.6% of the correction to the DJIA growth wave, which began in February 2016 from the level of 15500.0), 25270.0 (August lows), 24600.0 (June 2019 lows). Stronger decline in the DJIA will require convincing evidence of a slowdown in the US economy and a worsening trade conflict between the US and China. In the meantime, there is the long-term positive dynamics of US stock indices and the DJIA index, including. Support Levels: 28330.0, 27950.0, 27400.0, 27100.0, 26800.0, 25550.0 Resistance Levels: 28585.0 Trading Scenarios Buy Stop 28650.0. Stop-Loss 28300.0. Take-Profit 29000.0, 30000.0 Sell Stop 28300.0. Stop-Loss 28650.0. Take-Profit 27950.0, 27400.0, 27100.0, 26800.0, 25550.0 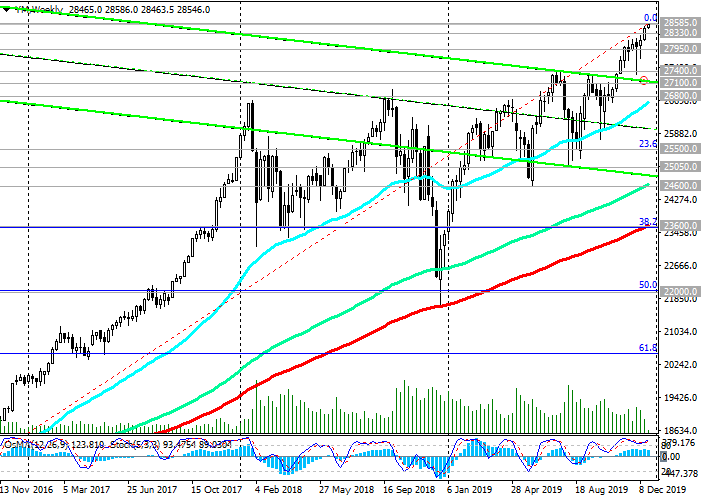 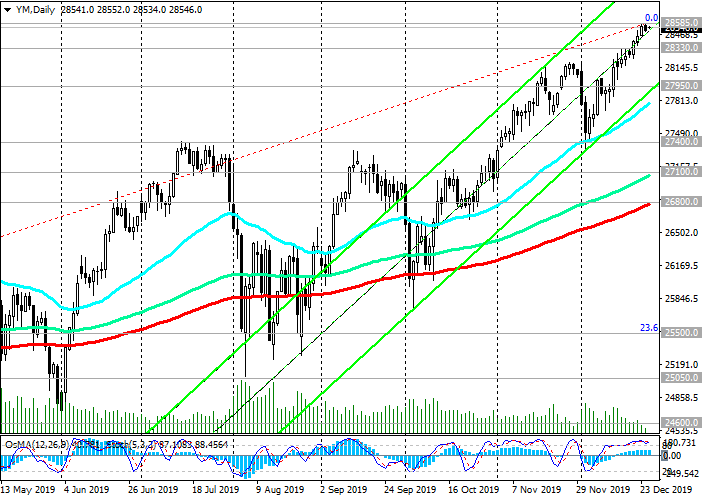 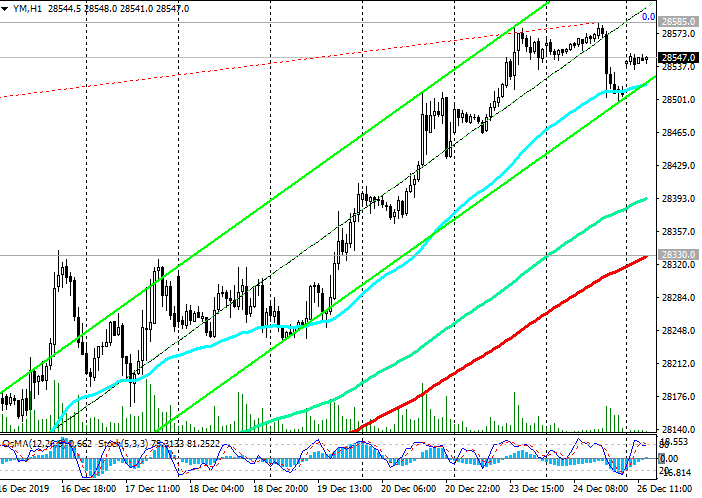 *) For up-to-date and detailed analytics and news on the forex market visit Tifia Forex Broker website tifia.com
|
|
#587
27-12-2019, 10:59
|
||||
|
||||
|
Brent: Strong positive momentum
12/27/2019 A strong positive momentum of a fundamental nature, observed on world stock markets and the oil market, is pushing prices to new 3-month highs. The price broke through at the beginning of the month the key resistance level 63.90 (EMA200 on the daily chart and the Fibonacci level 38.2% of downward correction in the wave of price growth from the level near the level of 27.10 to the highs of October 2018 near the level of 86.60) and continues to develop upward trend in side of the local maximum 69.70. In the case of a breakthrough of this resistance level, the next growth target will be the resistance level 72.60 (Fibonacci level of 23.6% and the upper border of the ascending channel on the weekly chart). The positive mood of investors is fueled by hopes that the US and China will reach an agreement of the "first phase" in January. Earlier this month, OPEC and other oil producing countries, including Russia, agreed on an additional cumulative cap on production of 500,000 barrels per day in order to reduce global supply. Following the results of three meetings, the Fed lowered interest rates this year, and in October the range of key interest rates was 1.5% - 1.75%. At the same time, in December, Fed leaders said that monetary policy was likely to remain unchanged in the next 2020. The stock market euphoria, despite the political instability in some regions of the world, also contributes to the growth of oil prices. Thus, a favorable external background is forming for the possibility of further growth in the oil market. In an alternative scenario, the signal for the resumption of sales will be a breakdown of the support level of 66.40 (ЕМА200 on the 1-hour chart). The breakdown of the support levels 63.90, 63.00 will mean the resumption of the global downtrend with support at the levels of 60.40 (May lows), 58.50, 56.90 (Fibonacci level of 50%). From the news today, we are waiting for the publication by the US Department of Energy at 15:30 (GMT) weekly data on stocks of oil and petroleum products. According to the forecast, it is expected that they decreased by 1.724 million barrels last week. When confirmed, oil is likely to continue to rise in price. Also, today (at 18:00 GMT) the next weekly report of the American oilfield services company Baker Hughes will be published. If the report indicates a decrease in the number of active drilling rigs, this may give an additional positive impetus to prices. Support Levels: 67.50, 66.40, 64.50, 63.90, 63.00, 61.00, 60.40, 58.50, 56.90 Resistance Levels: 68.00, 69.70, 72.60 Trading Recommendations Sell Stop 67.40. Stop-Loss 68.20. Take-Profit 66.40, 64.50, 63.90, 63.00, 61.00, 60.40, 58.50, 56.90 Buy Stop 68.20. Stop-Loss 67.40. Take-Profit 69.70, 71.00, 72.00, 72.60 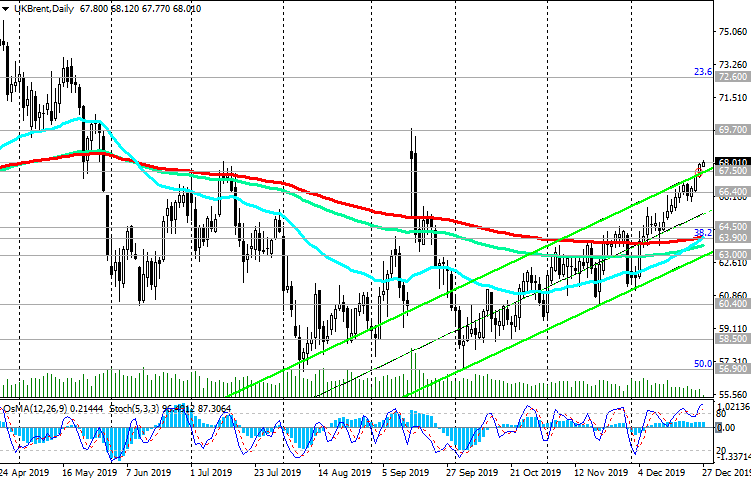 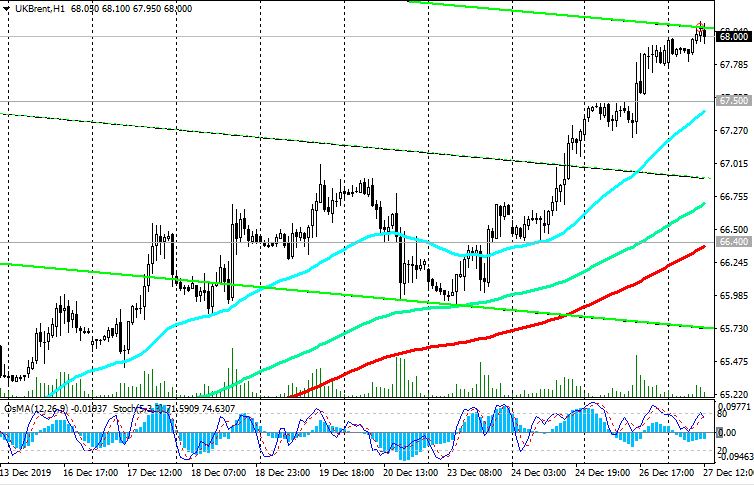 *) For up-to-date and detailed analytics and news on the forex market visit Tifia Forex Broker website tifia.com
|
|
#588
30-12-2019, 10:26
|
||||
|
||||
|
DJIA: investor optimism pushes indices up
12/30/2019 Positive dynamics prevail in the global stock market. The main factor contributing to the growth of indices in recent days is both the traditional New Year rally and the expectation of the signing of the first part of the US-China trade agreement in January. If this happens, it should give the world economy an impetus for growth. Nevertheless, there remains a lot of ambiguity regarding the future prospects of trade relations between the two countries, whose total GDP is about 35% of total world GDP. The details of the agreement were not disclosed, so it remains unclear what will happen if the parties fail to resolve the remaining contradictions. Investors are also mostly optimistic about the prospects for the stock market in 2020. Expectations of further growth in stock indices speak in favor of DJIA purchases. In an alternative scenario, after the breakdown of the short-term support level 28450.0 (ЕМА200 on the 1-hour chart) and in case of further decrease in DJIA, the targets will be the support levels 28030.0 (ЕМА200 on the 4-hour chart), 27100.0 (ЕМА144 on the daily chart), 26850.0 (ЕМА200 on the daily chart). The breakdown of support level 26800.0 may provoke a further decline to support levels 25600.0 (Fibonacci level 23.6% of the correction to the DJIA growth wave, which began in February 2016 from 15500.0), 25270.0 (August lows), 24600.0 (June 2019 lows). Stronger decline in the DJIA will require convincing evidence of a slowdown in the US economy and a worsening trade conflict between the US and China. In the meantime, there is the long-term positive dynamics of US stock indices and the DJIA index, including. Support Levels: 28450.0, 28030.0, 27400.0, 27100.0, 26850.0, 25600.0 Resistance Levels: 28730.0 Trading Scenarios Buy Stop 28750.0. Stop-Loss 28430.0. Take-Profit 29000.0, 30000.0 Sell Stop 28430.0. Stop-Loss 28750.0. Take-Profit 28030.0, 27400.0, 27100.0, 26850.0 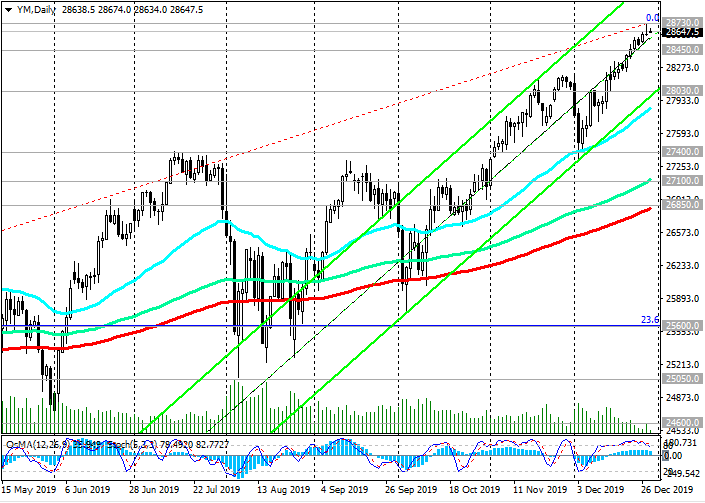 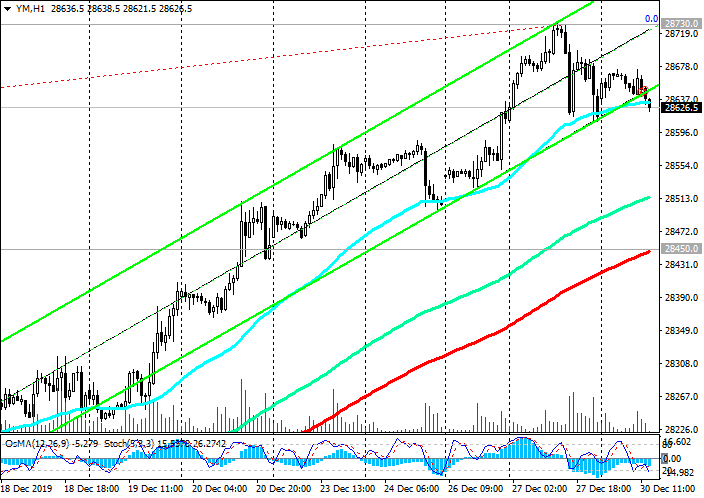 *) For up-to-date and detailed analytics and news on the forex market visit Tifia Forex Broker website tifia.com
|
|
#589
09-01-2020, 11:49
|
||||
|
||||
|
USD/CAD: US dollar resumed growth
09/01/2020 Current Dynamics Against the backdrop of the weakening US dollar, the USD / CAD pair broke through the key support level 1.3205 (EMA144 and EMA200 on the daily chart) last month and reached 1.2957 in early January. Further decline and breakdown of the long-term support level of 1.2930 (EMA200 on the weekly chart) would mean breaking the bullish trend of USD / CAD. Nevertheless, there was no further decrease in USD / CAD and today the pair has been growing for the third day in a row. The pairs growth is facilitated by both the strengthening of the US dollar and the decline in oil prices that followed after their significant increase on the eve amid a sharp aggravation of the geopolitical situation in the Middle East. As you know, on Tuesday night, Iran launched a missile attack on US military bases in Iraq. However, as follows from the statements of the White House, none of the US military was injured. In turn, the Iranian Foreign Minister tweeted that the missile attacks were not intended to escalate the conflict or start a war. The words of US President Trump that "everything is fine", and Iran, it seems, does not intend to continue the conflict, reassured investors, which helped to renew the rally of US stock indices and the USD. USD / CAD broke through the short-term resistance level 1.3027 on Wednesday (EMA200 on the 1-hour chart), which was the first signal to resume long positions, and is trading on Thursday near the local resistance level 1.3050 (October lows). If the growth continues, USD / CAD will go to the resistance level 1.3120 (ЕМА200 on the 4-hour chart), and in case of breakdown, the growth will accelerate to the key resistance level 1.3205. The December report of the US Ministry of Labor will be published on Friday. Economists expect jobs to reach +160,000, while unemployment remains at 3.5%, as in November. Also, on Friday at the same time (at 13:30 GMT) will be published data from the Canadian labor market. In December, Canada's unemployment rate is expected to be 5.8%. This is slightly better than the November figure, but still worse than the average for 2019 (about 5.6% - 5.7%). Growth in unemployment is a negative factor for the national currency. If the data turn out to be worse than the forecast of 5.8%, then the Canadian dollar will drop sharply, and the growth of USD / CAD will continue. In an alternative scenario and after the breakdown of the short-term support level 1.3027 (ЕМА200 on the 1-hour chart), short positions will again become relevant. Nevertheless, in this period of time (13:30 GMT) on Friday, a sharp increase in volatility in the foreign exchange market is expected, and above all - in the pair USD / CAD. From the news today it is worth paying attention to the speech at 19:00 (GMT) of the head of the Bank of Canada Stephen Poloz. If in his speech today he touches on the topic of monetary policy, the volatility of Canadian dollar quotes will increase. If Stephen Poloz speaks out in favor of the need for a softer monetary policy of the Bank of Canada, then the weakening of the Canadian dollar and the growth of USD / CAD will accelerate. Support Levels: 1.3027, 1.3000, 1.2960, 1.2930 Resistance Levels: 1.3050, 1.3120, 1.3205, 1.3300, 1.3325, 1.3345, 1.3380, 1.3400, 1.3452 Trading Scenarios Sell Stop 1.3025. Stop-Loss 1.3065. Take-Profit 1.3000, 1.2960, 1.2930 Buy Stop 1.3065. Stop-Loss 1.3025. Take-Profit 1.3120, 1.3205, 1.3300, 1.3325, 1.3345, 1.3380, 1.3400, 1.3452  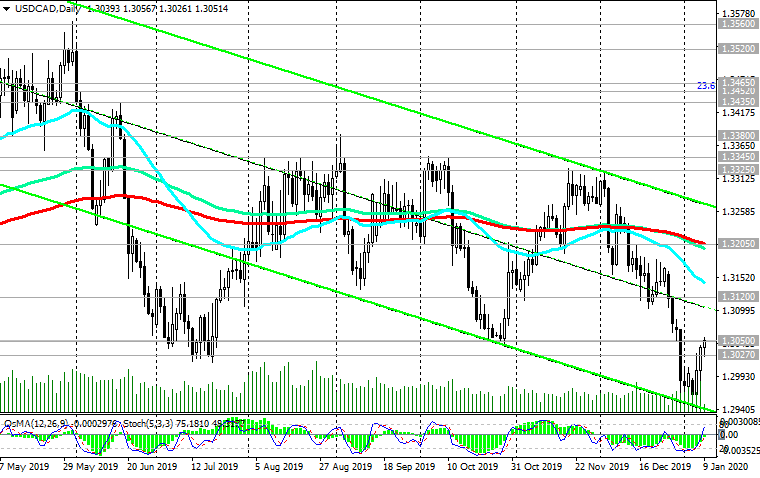 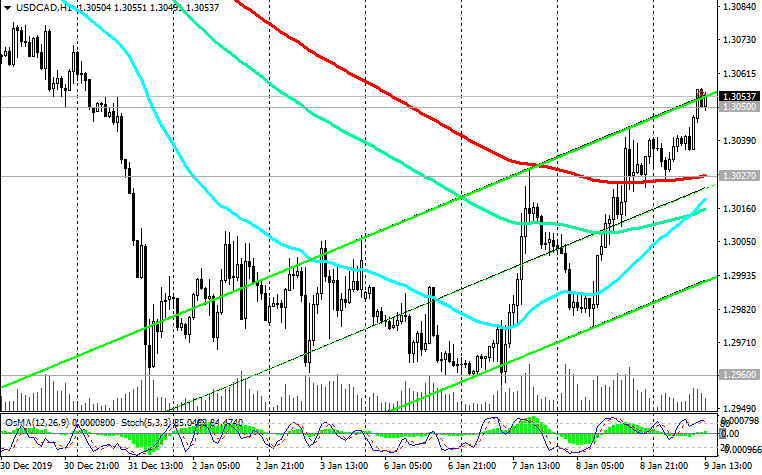 *) For up-to-date and detailed analytics and news on the forex market visit Tifia Forex Broker website tifia.com
|
|
#590
10-01-2020, 11:49
|
||||
|
||||
|
Brent: prices fell sharply after rising
earlier 10/01/2020 Current Dynamics Dollar growth continues on Friday. The DXY dollar index, which reflects the value of the dollar against a basket of 6 major currencies, rose another 0.18% to 97.25, 10 points above today's open price. Most likely, the dollar will also end this week on a positive note, if data from the US labor market will meet the expectations of market participants. The publication of this data is scheduled for 13:30 (GMT), and economists expect that in December the number of jobs outside the agricultural sector of the American economy increased by +160,000, while unemployment remained at 3.5%, as In November. A report by the ADP Research Institute on the change in the number of employees published on Wednesday indicated an increase in jobs in the private sector of the US economy by 202,000 in December (the forecast was +160,000). November ADP data on jobs were revised up to +124,000, while earlier it was reported an increase of 67,000. These are very positive data indicating the stability of the US labor market. Meanwhile, oil prices continue to decline on Friday, both against the backdrop of a stronger dollar and after statements by US President Donald Trump, which eased investors' concerns about escalating the conflict in the Middle East region. As the degree of tension in the Middle East declined, the price also began to decline. At the beginning of today's European session, Brent crude is trading near the short-term support level of 66.00 (EMA200 on the 4-hour chart). Nevertheless, above the support levels of 64.30 (ЕМА200 on the daily chart), 63.90 (Fibonacci retracement 38.2% of downward correction in the wave of price growth from the level near the level of 27.10 to the October 2018 highs near the level of $86.60 per barrel), long-term positive dynamics Brent oil prices remain. Therefore, a decrease to the support level of 66.00 provides a good opportunity to build up long positions. In the case of a breakthrough of the local maximum of 69.70, recorded in September after the drone attack on large oil facilities in Saudi Arabia, the next growth target will be the resistance level of 72.60 (Fibonacci level of 23.6% and the upper border of the ascending channel on the weekly chart). In an alternative scenario, the signal for resumption of sales will be a breakdown of support levels 66.00, 65.10 (EMA50 on the daily chart) with targets at support levels 64.30, 63.90, 63.00. The breakdown of these support levels will mean breaking the bull trend and the resumption of the global downtrend with support at 60.40 (May lows), 58.50, 56.90 (Fibonacci level of 50%). From the news today regarding oil prices, it is worth paying attention to the publication (at 18:00 GMT) of the weekly report of the American oilfield services company Baker Hughes. According to the latest report, the number of active drilling rigs in the United States grew over the past month by just 2 rigs, to 670 units from 668 units 4 weeks ago. However, this is much less than the number of active drilling rigs at the beginning of June (800 units) and at the beginning of September (742 units). If a Baker Hughes report indicates a decline in the number of active rigs, it could also support oil prices. Support Levels: 66.00, 65.10, 64.30, 63.90, 63.00, 61.00, 60.40, 58.50, 56.90 Resistance Levels: 66.65, 67.50, 69.70, 71.95, 72.60 Trading Recommendations Sell Stop 64.90. Stop-Loss 66.70. Take-Profit 64.30, 63.90, 63.00, 61.00, 60.40, 58.50, 56.90 Buy Stop 66.70. Stop-Loss 64.90. Take-Profit 67.50, 69.70, 71.95, 72.60   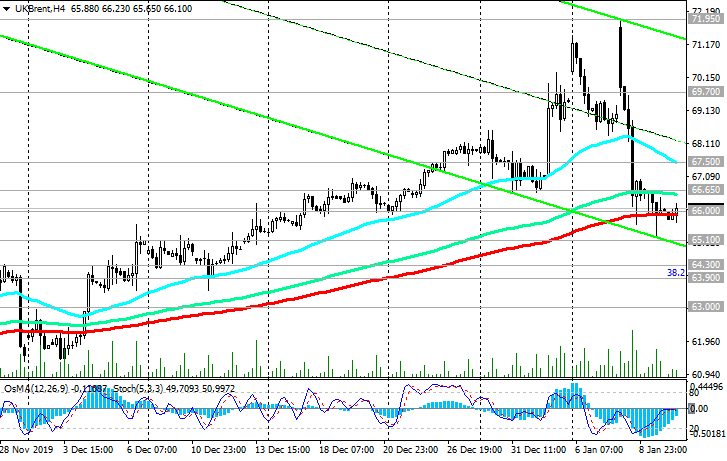 *) For up-to-date and detailed analytics and news on the forex market visit Tifia Forex Broker website tifia.com
|
|
#591
13-01-2020, 10:24
|
||||
|
||||
|
GBP/USD: the pair still has positive dynamics
Current dynamics 13/01/2020 Pound and GBP / USD are falling at the beginning of the new week. Last Thursday, Bank of Canada Governor Mark Carney said the Monetary Policy Committee was ready to take action if the weakness of the economy continued. At the same time, member of the committee, Sylvanas Tenreiro, said on Friday that further stimulation of the British economy is possible in the "coming months". Another member of the Bank of England's Monetary Policy Committee, Gertyan Wlige, also spoke in the same tone in an interview with the Financial Times on Monday, saying he would vote in January to lower interest rates if there are no signs of an improvement in the economy. Following the publication of fresh UK macro data at the beginning of today's European session, the pound accelerated its decline. According to the data presented, production in the UK manufacturing sector decreased by -1.7% in November (-2% in annual terms with a forecast of -1.7%), and overall industrial production decreased by -1.2% in November ( -1.6% in annual terms). The data turned out to be significantly worse than forecasts of economists. Data continues to show the extremely negative impact of the Brexit process on the British economy. After the publication of macro data, the GBP / USD pair fell to 1.2970, which is 88 points below the closing price last Friday. If GBP / USD continues to decline, the goals will be the support levels of 1.2910 (December lows), 1.2800 (ЕМА200 on the daily chart). So far (and above the key support level of 1.2800), medium-term positive dynamics of GBP / USD remains. The return of GBP / USD to the zone above the resistance level of 1.3090 (ЕМА200 on the 1-hour chart) will indicate the restoration of positive dynamics. In this case, the growth will continue towards the resistance levels 1.3210 (Fibonacci level 23.6% of the correction to the GBP / USD reduce in the wave that began in July 2014 near the level of 1.7200), 1.3340 (EMA200 on the weekly chart). A breakdown of the local resistance level of 1.3510 will mark targets at resistance levels of 1.3960 (Fibonacci level of 38.2%), 1.4350 (highs of January and April 2018), 1.4580 (Fibonacci level of 50%). Growth above the level of 1.4580 will mean the final break of the bearish trend. At the same time, the dollar is likely to retain its position in the current conditions. Investors are now excitedly waiting for the first-phase trade agreement between the US and China on January 15. The parties also intend to continue negotiations on a broader economic cooperation and agreed to hold negotiations twice a year with the aim of promoting economic reforms and resolving disputes. Such a development of events is also likely to help maintain demand for US assets and the dollar. Support Levels: 1.2980, 1.2910, 1.2800 Resistance Levels: 1.3015, 1.3050, 1.3090, 1.3175, 1.3210, 1.3340, 1.3510, 1.3960, 1.4350, 1.4580, 1.5080, 1.5190 Trading Scenarios Sell Stop 1.2960. Stop-Loss 1.3060. Take-Profit 1.2910, 1.2800 Buy Stop 1.3060. Stop-Loss 1.2960. Take-Profit 1.3090, 1.3175, 1.3210, 1.3340, 1.3510, 1.3960, 1.4350, 1.4580, 1.5080, 1.5190  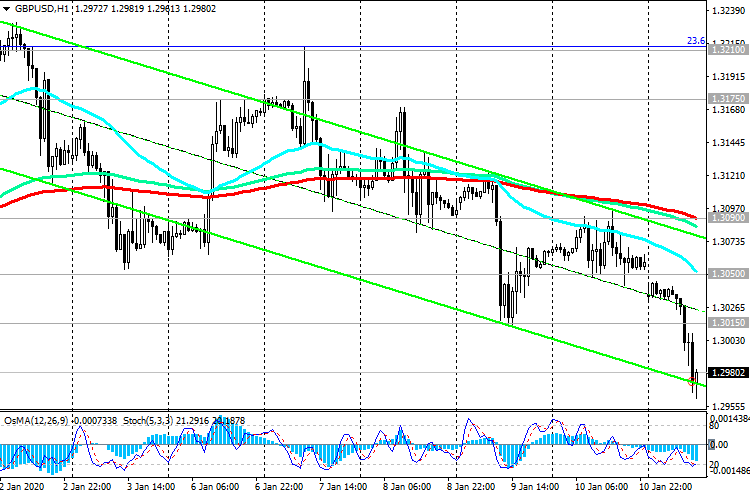 *) For up-to-date and detailed analytics and news on the forex market visit Tifia Forex Broker website tifia.com
|
|
#592
14-01-2020, 10:54
|
||||
|
||||
|
S&P 500: need new drivers to continue the rally
14/01/2020 The risks of escalating the conflict between the US and Iran have declined. Investors are waiting for the signing of the first phase of a trade agreement between the US and China on Wednesday. The parties also intend to continue negotiations on a broader economic cooperation and agreed to hold negotiations twice a year with the aim of promoting economic reforms and resolving disputes. The strongest negative factor and risks holding back the growth of the global economy seem to be starting to decline. At the same time, it should be noted that the signing of this trade agreement is already mainly taken into account in prices. Therefore, to continue the rally in the stock market, additional drivers are needed. On Tuesday, the volatility of the dollar and US stock indexes may rise at 13:30 (GMT), when the latest data on consumer inflation in the US will be published. The Core Consumer Price Index (Core CPI), which is a key indicator for measuring inflation and changing consumer preferences, is expected to increase +0.2% in December (as it did in the previous two months). If the data for December is weaker than the forecast, then the dollar will most likely respond with a short-term, but strong decline, and stock indices are likely to rise. According to the latest data from the US Department of Labor published on Friday, private sector wages rose 2.9% in December compared with the same period last year. This is the weakest growth since July 2018, which, according to investors, does not raise concerns about rising inflation. So, the Fed will not raise interest rates to curb inflation. This is a positive fact for buyers in the stock market. The S&P 500 index maintains long-term positive dynamics, trading above key support levels of 3010.0 (ЕМА200 on the daily chart), 3068.0 (Fibonacci level 23.6% of the correction to the growth since December 2018 and mark 2335.0). Long positions are preferred. In an alternative scenario, and after the breakdown of the short-term support level 3255.0 (ЕМА200 on the 1-hour chart), the correctional decline of S&P 500 can continue to the support levels 3196.0 (ЕМА200 on the 4-hour chart), 3168.0 (ЕМА50 on the daily chart). However, only a breakdown of support levels of 3010.0 and 2926.0 (Fibonacci level of 38.2%) will increase the risks of the bullish trend S&P 500 breaking. Support Levels: 3255.0, 3196.0, 3168.0, 3100.0, 3068.0, 3010.0, 2926.0 Resistance Levels: 3294.0, 3300.0 Trading Recommendations Sell Stop 3254.0. Stop-Loss 3296.0. Goals 3196.0, 3168.0, 3100.0, 3068.0, 3010.0, 2926.0 Buy Stop 3296.0. Stop-Loss 3254.0. Goals 3300.0, 3350.0, 3400.0 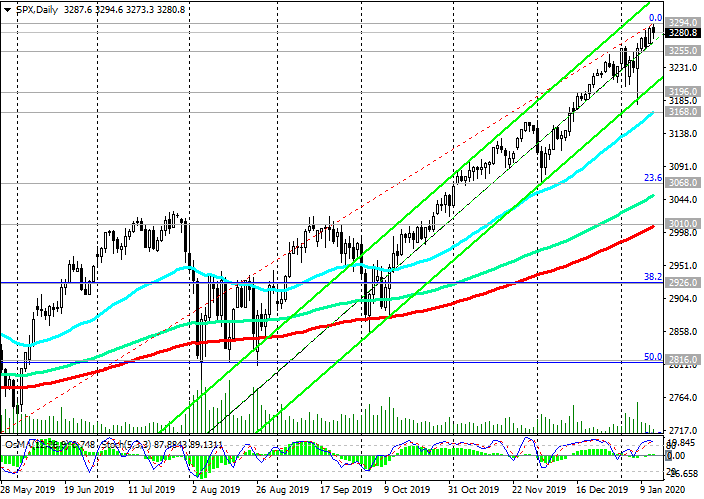 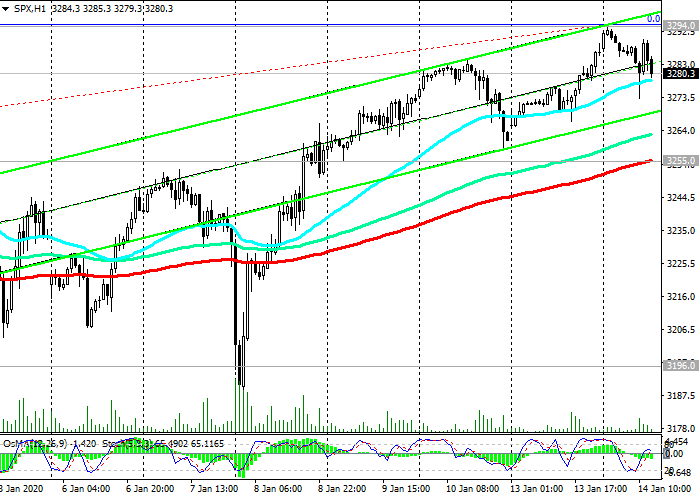 *) For up-to-date and detailed analytics and news on the forex market visit Tifia Forex Broker website tifia.com
|
|
#593
15-01-2020, 10:55
|
||||
|
||||
|
GBP/USD: the pound remains under pressure from disappointing macro data
15/01/2020 After the release of fresh UK macro data (at 09:30 GMT), GBP / USD continued to decline on Wednesday, trading at the moment near the 1.2995 mark and the EMA50 support level on the daily chart. The dynamics of the pound, which has already fallen by about 2% since the beginning of the year, is determined by weak macro data coming from the UK and the continuing uncertainty about Brexit. The UK should leave the EU on January 31, although access to the EU markets in their current form will remain at least until the end of this year, while the terms of a new agreement are being worked out. However, weak economic data suggests that uncertainty about Brexit harms the economy more than many observers expected. Following comments by Bank of England management and disappointing macro data this week, market participants sharply increased the likelihood of policy easing at a Bank of England meeting on January 30. If the bank really lowers the rate (as predicted by some economists, by 0.25%), then the drop in the pound in the absence of progress on Brexit is likely to accelerate. Now the attention of market participants has shifted to the signing of a trade agreement between the United States and China. The signing process will begin at 16:00 (GMT). The White House will evaluate the progress made and, possibly, reduce duties on goods from China again, but not earlier than 10 months after the signing of the trade agreement planned for today. Existing duties on Chinese imports will remain in effect until the end of the US presidential election in November 2020. Despite today's decline in the pound, above the key support level of 1.2800 (EMA200, EMA144 on the daily chart), medium-term positive dynamics of GBP / USD remains. If GBP / USD returns to the zone above the resistance level 1.3050 (EMA200 on the 4-hour and 1-hour chart), the pair will continue to grow towards the resistance levels 1.3210 (Fibonacci level 23.6% of the correction to the GBP/USD reduce in the wave that started in July 2014, near the level of 1.7200), 1.3340 (EMA200 on the weekly chart). Support Levels: 1.2995, 1.2955, 1.2910, 1.2800 Resistance Levels: 1.3050, 1.3100, 1.3175, 1.3210, 1.3340, 1.3510, 1.3960, 1.4350, 1.4580, 1.5080, 1.5190 Trading Scenarios Sell Stop 1.2985. Stop-Loss 1.3055. Take-Profit 1.2955, 1.2910, 1.2800 Buy Stop 1.3055. Stop-Loss 1.2985. Take-Profit 1.3090, 1.3175, 1.3210, 1.3340, 1.3510, 1.3960, 1.4350, 1.4580, 1.5080, 1.5190  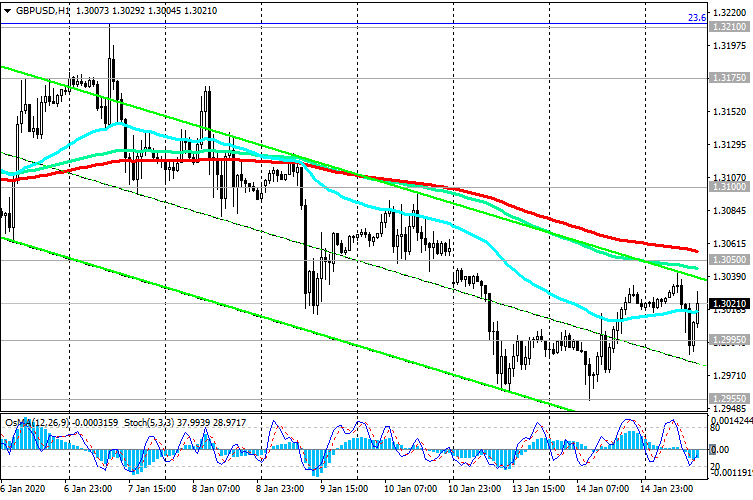 *) For up-to-date and detailed analytics and news on the forex market visit Tifia Forex Broker website tifia.com
|
|
#594
16-01-2020, 10:58
|
||||
|
||||
|
DJIA: positive fundamental background
16/01/2020 Despite the fact that the signing of the first phase trade agreement between the United States and China has largely been won back by markets, investors enthusiastically welcomed this event. US President Donald Trump called the deal a crucial and unprecedented step in relations with China, leading to "fair and mutually beneficial trade". Speaking to reporters, Trump's economic adviser Larry Kudlow called the signed agreement the best deal ever made between the United States and China. The United States agreed to lower duties on Chinese goods worth $ 120 billion to 7.5% and to cancel the previously planned introduction of new duties on imports from China. Meanwhile, as Trump had previously stated, the remaining fees will be used in working out the second phase agreement. If, in the course of fulfilling the obligations undertaken, one of the parties violates them, then the infringed party will be entitled to take proportional measures of protection, which, in essence, means the restoration of duties. So far, markets have ignored the likelihood of possible complications during the elaboration of the second stage of the trade agreement. As the Beige Book published last Wednesday, the U.S. economy continued to grow at a moderate pace in the last six weeks of 2019. Expectations regarding short-term prospects remain moderately favorable in the country, the Fed said. Thus, the fundamental factor speaks in favor of the further growth of US stock indices and the DJIA index as well. In an alternative scenario, the first signal for sales will be a breakdown of the short-term support level of 28855.0 (ЕМА200 on the 1-hour chart). In case of further decline, the targets will be the support levels 28420.0 (ЕМА200 on the 4-hour chart), 27400.0 (ЕМА144 on the daily chart), 27100.0 (ЕМА200 on the daily chart). Above the key support levels of 27400.0, 27100.0, the long-term upward dynamics of the DJIA remains. Support Levels: 28855.0, 28420.0, 28000.0, 27400.0, 27100.0, 25945.0, 25050.0, 24600.0, 23970.0 Resistance Levels: 29180.0 Trading Scenarios Buy Stop 29205.0. Stop-Loss 28850.0. Take-Profit 29300.0, 30000.0 Sell Stop 28850.0. Stop-Loss 29205.0. Take-Profit 28420.0, 28000.0, 27400.0 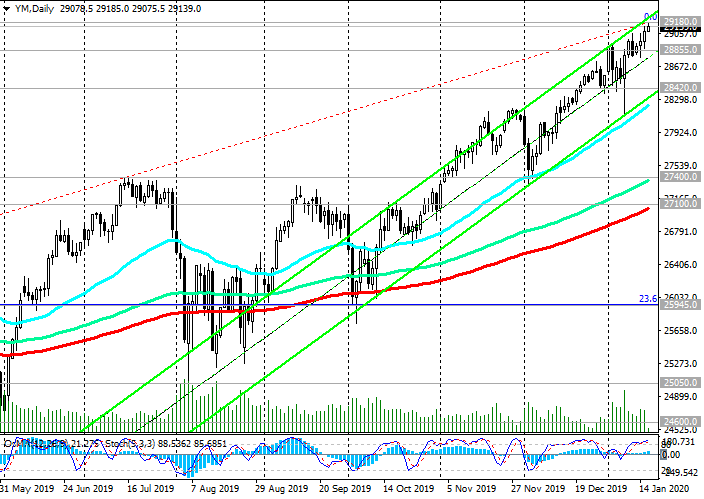  *) For up-to-date and detailed analytics and news on the forex market visit Tifia Forex Broker website tifia.com
|
|
#595
17-01-2020, 11:19
|
||||
|
||||
|
EUR/USD: the pair is again under pressure
17/01/2020 The weakening Euro and lower EUR / USD continued on Friday. On Thursday and Friday, the EUR / USD pair has broken important support levels of 1.1138 (ЕМА200 on the 1-hour chart), 1.1122 (ЕМА200 on the 4-hour chart, ЕМА144 on the daily chart) and continued to decline towards the support level 1.1109 (ЕМА50 on the daily chart) . In case of breakdown of the support level 1.1109 and further decrease, the goal will be the local support level 1.1064. A deeper decline or resumption of growth will depend on the fundamental background. As follows from the protocols published on Thursday from the December meeting of the ECB, the bank's leaders promised not to raise the key interest rate until inflation reaches the target level (slightly less than 2%), which is unlikely in the coming months and, possibly, years. The executives also said that even with negative rates, bank returns will be on the positive side, noting that interest rates can be reduced even more if necessary. At the same time, previously published macro data showed that at the beginning of 2020, the US fundamental indicators supporting consumer spending (low unemployment and rising earnings) remain stable. According to the report of the Ministry of Commerce, retail sales in December grew by 0.3%. As you know, consumer spending is more than 2/3 of US GDP. Today, market participants will follow the publication at 15:00 (GMT) of the preliminary consumer confidence index of the University of Michigan in January. It is expected that this indicator will be released in January with a value of 99.4 (against 99.3 in December). This is a high indicator, which indicates the growth of the economy and the confidence of American consumers in the economic development of the country. The publication of the indicator is also likely to support the dollar. Below the key resistance level of 1.1155 (ЕМА200 on the daily chart), long-term negative dynamics of EUR / USD remains and short positions are preferred. In an alternative scenario, a signal to resume purchases will be a growth into the zone above resistance levels 1.1122, 1.1138 (ЕМА200 on the 1-hour chart). Support Levels: 1.1109, 1.1064, 1.0995, 1.0940, 1.0900 Resistance Levels: 1.1120, 1.1138, 1.1155, 1.1205, 1.1240, 1.1285 Trading Recommendations Sell Stop 1.1090. Stop-Loss 1.1125. Take-Profit 1.1064, 1.1000, 1.0940, 1.0900 Buy Stop 1.1125. Stop-Loss 1.1090. Take-Profit 1.1155, 1.1200, 1.1240, 1.1285   *) For up-to-date and detailed analytics and news on the forex market visit Tifia Forex Broker website tifia.com
|
|
#596
20-01-2020, 10:19
|
||||
|
||||
|
GBP/USD: Current Dynamics
After the publication of data from the retail sector in the UK and the USA last Friday, GBP / USD continues to decline today for the second day in a row. In the UK, retail sales in December fell by -0.6% in the country (v.s. a forecast of +0.7%), and in the United States, according to the report of the Ministry of Commerce, they grew by 0.3% compared to the previous month. Strong retail sales in the 4th quarter will have a positive impact on the growth rate of US GDP, economists say, expecting GDP growth in the 4th quarter at 2.5 - 2.6%. At the same time, weak macro data recently received from the UK reinforce expectations of a softening of the Bank of England policy at a meeting on January 30. In the USA today is a day off on the occasion of the celebration of the birthday of Martin L. King. Therefore, trading volumes during the american trading session will be low, which, however, does not exclude the possibility of a sharp increase in volatility in the "thin market". The volatility in the GBP / USD pair may again rise sharply tomorrow after the publication (at 09:30 GMT) of the UK labor market data. It is likely that the data will indicate a slowdown in wage growth and that unemployment is no longer dropping, although it is close to the lows over the past few years. Meanwhile, the GBP / USD pair broke through the lower border of the rising channel on the daily chart and is trading below important resistance levels of 1.2995 (ЕМА50 on the daily chart), 1.3050 (ЕМА200 on the 4-hour and 1-hour charts). In case of breakdown of the support levels 1.2955, 1.2910 (local lows), a further decrease in GBP / USD is likely. Below resistance levels 1.3120 (ЕМА144 on the weekly chart), 1.3050, short positions are preferred. Support Levels: 1.2955, 1.2910, 1.2800 Resistance Levels: 1.2995, 1.3050, 1.3100, 1.3120, 1.3210, 1.3340, 1.3510, 1.3960, 1.4350, 1.4580, 1.5080, 1.5190 Trading Scenarios Sell Stop 1.2945. Stop-Loss 1.3010. Take-Profit 1.2910, 1.2800 Buy Stop 1.3010. Stop-Loss 1.2945. Take-Profit 1.2995, 1.3050, 1.3100, 1.3120, 1.3210, 1.3340, 1.3510 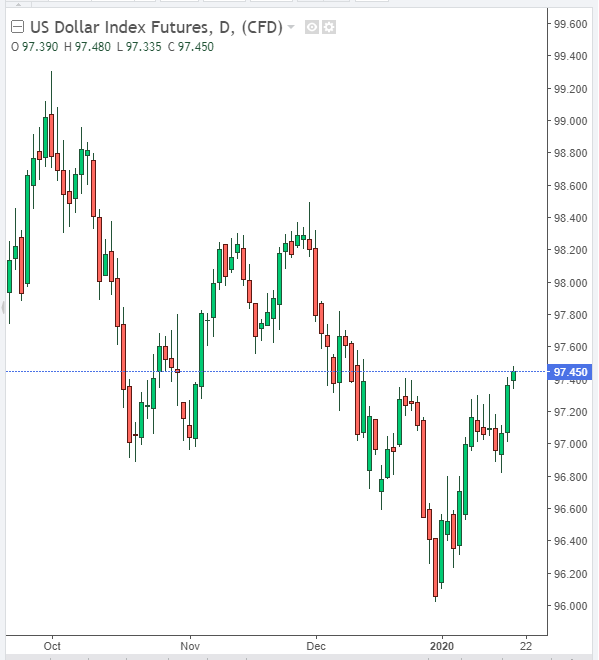 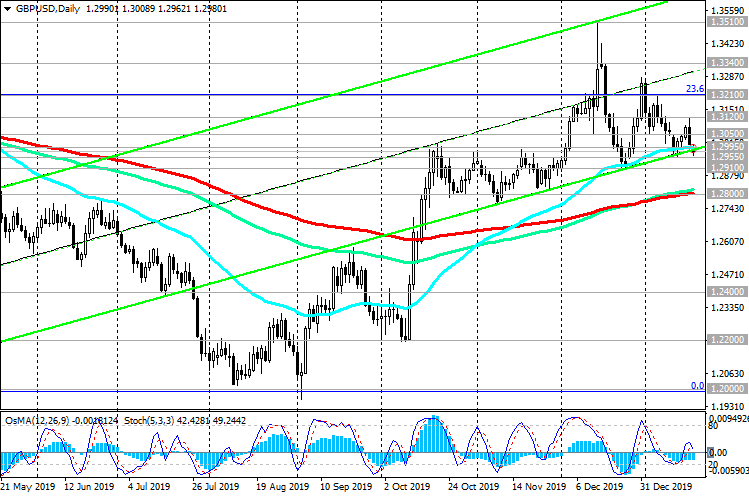  *) For up-to-date and detailed analytics and news on the forex market visit Tifia Forex Broker website tifia.com
|
|
#597
21-01-2020, 11:16
|
||||
|
||||
|
USD/CAD: Current Dynamics
21/01/2020 In December, following a decision by the Bank of Canada not to change monetary policy, and amid a weakening US dollar, the USD / CAD pair fell sharply, breaking through the key support level of 1.3195 (ЕМА144 and ЕМА200 on the daily chart). The Bank of Canada leadership is looking positively at the state of the country's economy and labor market. Back in November, Stephen Poloz said that "the current monetary policy remains appropriate in this situation" and, in his opinion, it still "largely remains stimulating". The regular meeting of the Bank of Canada on monetary policy issues will be held on Wednesday, and the decision on the rate will be published at 15:00 (GMT). As expected, the Bank of Canada will not change the current interest rate, which is at the level of 1.75%, and will give a moderately positive assessment of the state of the Canadian economy. At 16:15, the banks press conference will begin, which can also cause sharp fluctuations in the Canadian dollar quotes if unexpected statements are made by the head of the Bank of Canada Stephen Poloz. USD / CAD reached 1.2957 mark in January. Nevertheless, the breakdown of the support level of 1.2930 (EMA200 on the weekly chart), which would indicate a break in the bull trend, has not occurred, so far, and the USD / CAD is growing again, breaking through the short-term resistance level 1.3052 (EMA200 on the 1-hour chart). The immediate goal in case of continued growth of USD / CAD will be the resistance level 1.3096 (ЕМА200 on the 4-hour chart), and in case of its breakdown, the growth will accelerate to the key resistance level 1.3195. Growth into the zone above this resistance level will indicate a restoration of the bullish trend of USD / CAD. You can return to sales if USD / CAD falls into the zone below the support level of 1.3027. Below this level, short positions will again become preferable. Support Levels: 1.3052, 1.3027, 1.3000, 1.2960, 1.2930 Resistance Levels: 1.3096, 1.3120, 1.3195, 1.3300, 1.3325, 1.3345, 1.3380, 1.3400, 1.3452 Trading Scenarios Sell Stop 1.3025. Stop-Loss 1.3100. Take-Profit 1.3000, 1.2960, 1.2930 Buy Stop 1.3105. Stop-Loss 1.3025. Take-Profit 1.3120, 1.3190, 1.3300, 1.3325, 1.3345, 1.3380, 1.3400 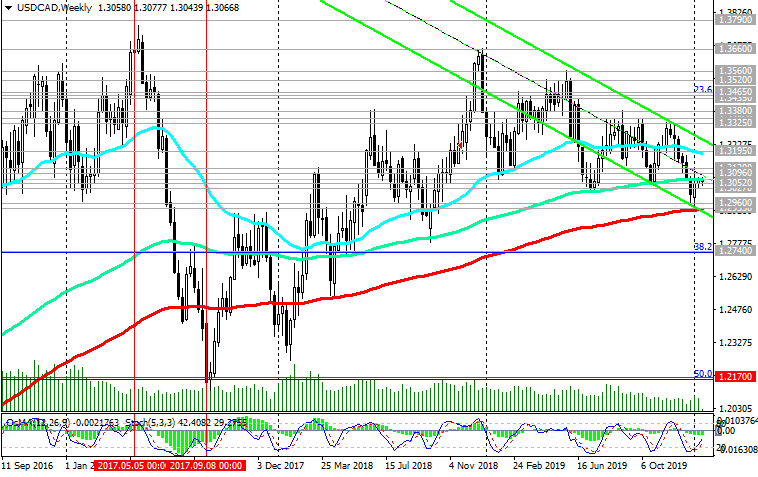 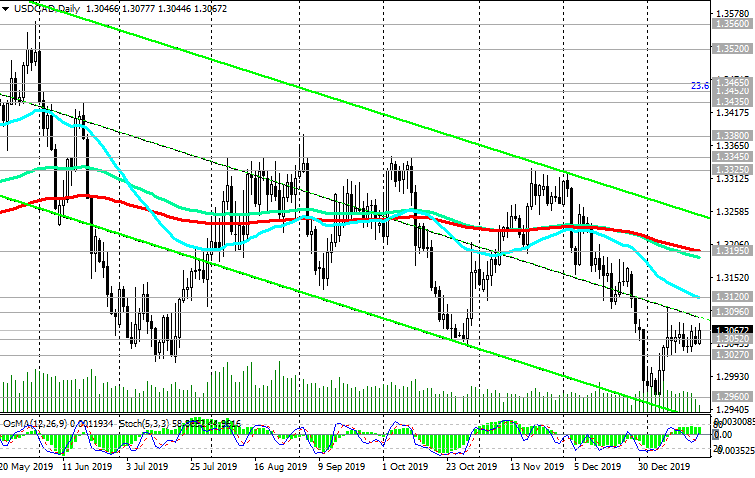 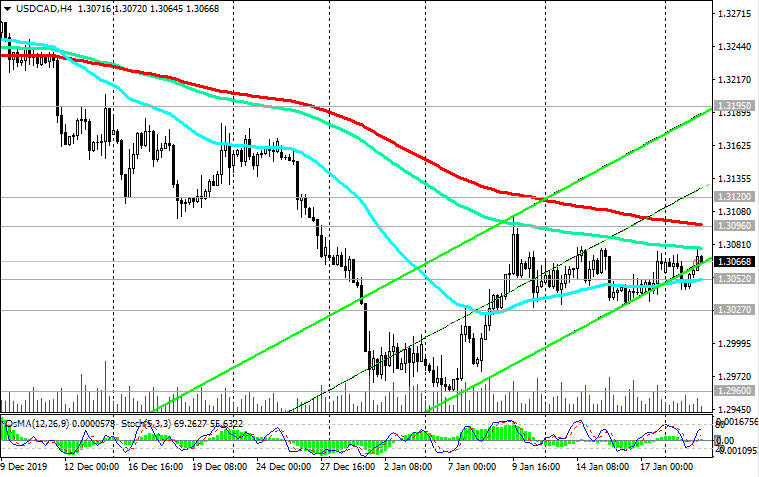 *) For up-to-date and detailed analytics and news on the forex market visit Tifia Forex Broker website tifia.com
|
|
#598
22-01-2020, 10:18
|
||||
|
||||
|
AUD/USD: the pair remains under pressure
22/01/2020 Last year, the RBA cut interest rates three times amid a trade conflict between the US and China and weak growth in the Australian economy. In December, the RBA left the key interest rate unchanged, at a record low of 0.75%. Now, labor market conditions, household consumption growth rates, and company investment are key to the February meeting of the RBA, after the US and China entered into a first phase trade agreement last week. RBA managing director Philip Lowe in November admitted the possibility of further stimulating the Australian economy after the rate drops below 0.25%. In the Australian economy, consumer demand is now declining and in recession. Personal consumption accounts for almost 60% of GDP, so the RBA always focuses on spending in stores. Without rapid growth in personal consumption, employment in the labor market will slow down, and the investment market will cool. On Wednesday, Westpac reported a decline in consumer confidence in the country. The consumer confidence index fell in January by -1.8% (against the forecast of -0.8% and after falling by -1.9% in December). The Australian dollar continued to decline after the publication of this index at the beginning of today's trading day. A day earlier, the Australian dollar was pressured by information about the outbreak of coronavirus in China. The Australian economy is expected to create +15,000 new jobs in December, while unemployment remains at 5.2%. Data from the Australian labor market will be released Thursday at 00:30 (GMT). Weak GDP growth, low personal consumption and weak retail sales reinforce expectations of further interest rate cuts at a meeting of the Reserve Bank of Australia on February 4, which will put downward pressure on AUD. On Wednesday, AUD / USD is trading below the key resistance level of 0.6910 (ЕМА200 on the daily chart) and below the important resistance level of 0.6881 (ЕМА200 on the 1-hour and 4-hour charts, ЕМА144 on the daily chart). A breakdown of the local support level of 0.6828 (today's and monthly lows) will confirm a downward trend and a return to the global downtrend, in which AUD / USD has been since August 2011. A signal for the development of an alternative scenario could be a breakdown of the local resistance level of 0.6850. However, the possible growth of AUD / USD is likely to be limited by the resistance level of 0.6910 (ЕМА200 on the daily chart). Support Levels: 0.6828, 0.6802, 0.6745, 0.6700, 0.6670, 0.6600, 0.6300 Resistance Levels: 0.6850, 0.6881, 0.6910, 0.6938 Trading Scenarios Sell Stop 0.6825. Stop-Loss 0.6860. Take-Profit 0.6802, 0.6745, 0.6700, 0.6670, 0.6600, 0.6300 Buy Stop 0.6860. Stop-Loss 0.6825. Take-Profit 0.6881, 0.6910 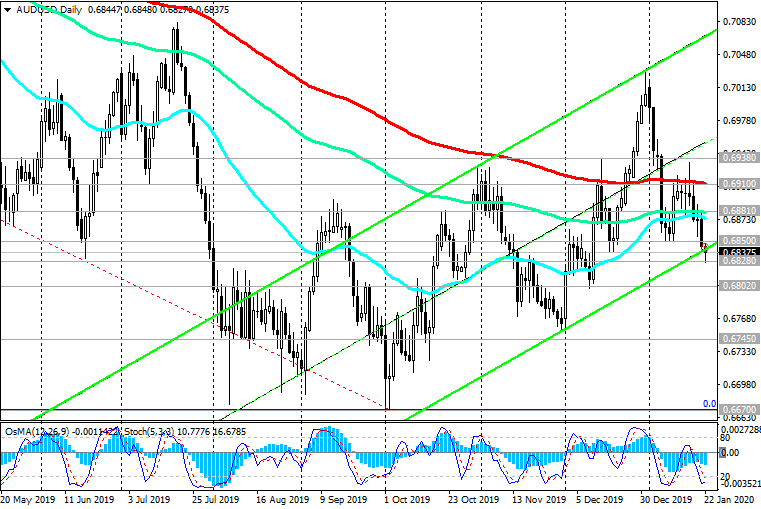 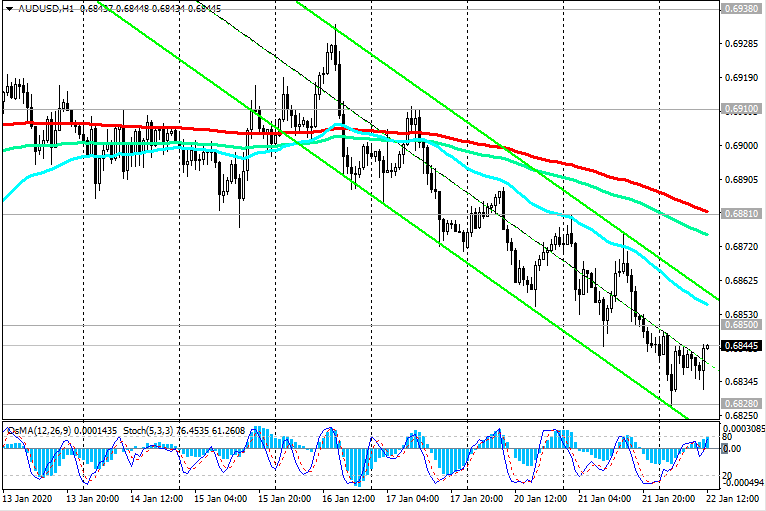 *) For up-to-date and detailed analytics and news on the forex market visit Tifia Forex Broker website tifia.com
|
|
#599
24-01-2020, 10:41
|
||||
|
||||
|
NZD/USD: commodity demand falls
24/01/2020 The New Zealand dollar received support today at the beginning of the Asian trading session after the publication of consumer inflation data. The consumer price index (CPI) in the country in the 4th quarter increased by +1.9% (after rising by +1.5% in the 3rd quarter, with the forecast of +1.8%). The NZD / USD rose in the first half of today's trading day, reaching an intraday high near 0.6628. Meanwhile, commodity prices continue to decline amid the spread of the deadly virus in China. While the NZD / USD is trading above the key support level of 0.6545 (ЕМА200 on the daily chart), its long-term dynamics remains. A signal for resuming sales will be a breakdown of the support level of 0.6613 (EMA200 on the 1-hour chart, EMA50 on the 4-hour chart) with the target at the support level of 0.6598 (EMA200 on the 4-hour chart and the bottom line of the ascending channel on the daily chart). The breakdown of the support level of 0.6428 (EMA144 on the daily chart) and a further decline will indicate the resumption of the global downtrend NZD / USD and the relevance of short positions with long-term goals at support levels 0.6260, 0.6200, 0.6100. On the other hand, a breakdown of local resistance levels of 0.6635, 0.6665 could trigger an alternative growth scenario in the upward channel on the daily chart with targets at resistance levels of 0.6770 (EMA144 on the weekly chart), 0.6865 (EMA200 on the weekly chart and the Fibonacci level 23.6% of the correction in the global wave of the pair decline from the level of 0.8820). Meanwhile, more active growth of the New Zealand dollar at the moment should not be expected, according to economists. Investors are gearing up for a slowdown in China, the largest consumer of commodities. Rising concerns about declining commodity demand will put pressure on commodity currencies, including the New Zealand dollar. Support Levels: 0.6613, 0.6698, 0.6575, 0.6545, 0.6528, 0.6500, 0.6485, 0.6440, 0.6400, 0.6322, 0.6260, 0.6200, 0.6100 Resistance Levels: 0.6635, 0.6665, 0.6770, 0.6865 Trading Scenarios Sell Stop 0.6590. Stop-Loss 0.6640. Take-Profit 0.6575, 0.6545, 0.6528, 0.6500, 0.6485, 0.6440, 0.6400, 0.6322, 0.6260, 0.6200 Buy Stop 0.6640. Stop-Loss 0.6590. Take-Profit 0.6665, 0.6770, 0.6865 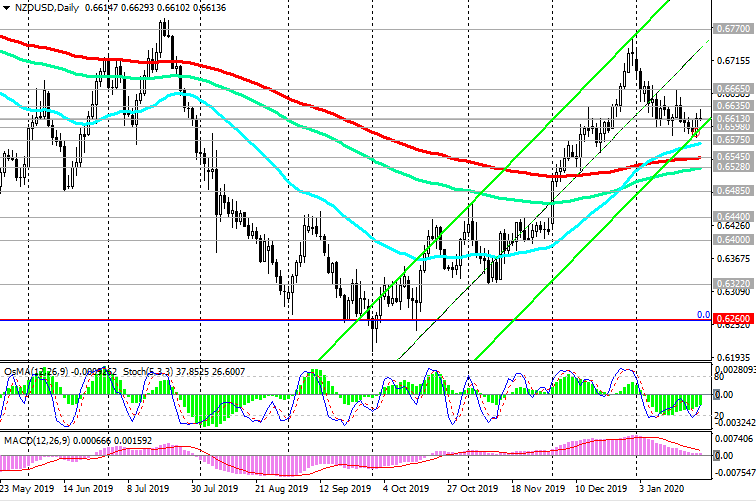 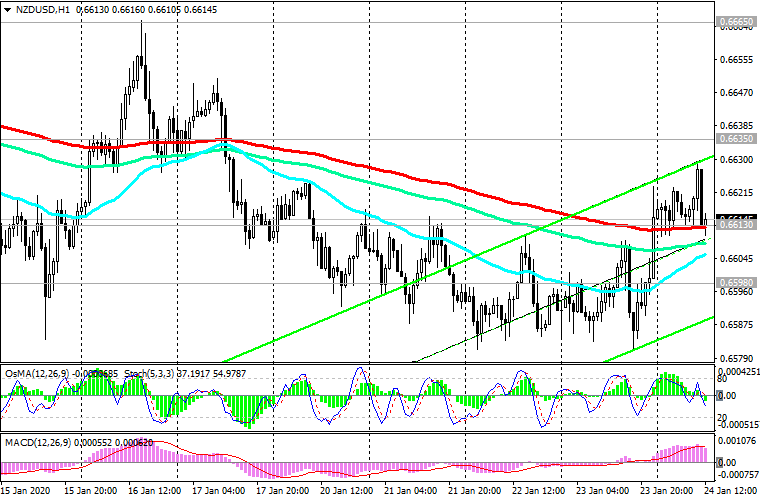 *) For up-to-date and detailed analytics and news on the forex market visit Tifia Forex Broker website tifia.com
|
|
#600
27-01-2020, 10:08
|
||||
|
||||
|
EUR/USD: Current Dynamics
27/01/2020 The number of infected people with coronavirus in China has already exceeded 2,700, and the number of deaths has reached 80. The situation threatens to get out of control, and traders began to take into account the inevitable slowdown in China's GDP growth, which causes a decrease in world stock indexes. Amid concerns about the spread of coronavirus and rising fears of a slowdown in the global economy, demand for safe haven assets (such as gold, yen) and the dollar are growing again. At the same time, the euro resumed falling against the dollar at the beginning of today's European session after the publication of disappointing macro data (at 09:00 GMT). According to the IFO, the business climate worsened in Germany in January. The current situation assessment indicator published by the CESifo research group came out with a value of 99.1, which is worse than the forecast of 99.4. The IFO Economic Expectations Index, which serves as an indicator of current conditions and expectations in the German business sector, came out with a value of 92.9, which is worse than the forecast of 95.0 and the previous value of 93.9. The slowdown in Germany's economic growth and the deterioration of sentiment in the country's business circles is a bearish factor for EUR. EUR / USD continues to trade in the zone below the key resistance level of 1.1150 (ЕМА200 on the daily chart). To resume growth, the price needs to break through the nearest resistance levels of 1.1064, 1.1082 (ЕМА200 on the 1-hour chart), 1.1105 (ЕМА200 on the 4-hour chart). However, the growth of EUR / USD is likely to be limited by the resistance level of 1.1150. In an alternative scenario, and after the breakdown of the resistance level, 1.1150 EUR / USD will go towards the resistance levels 1.1205, 1.1285 (Fibonacci level 23.6% of the upward correction to the fall of the pair from 1.3870 in May 2014 to 1.0480 reached in March 2015). A breakdown of the local support level of 1.1015 (today's low) may trigger a deeper decline in EUR / USD. Below the key resistance level of 1.1150, the long-term negative dynamics of EUR / USD remains, and a decline to the zone below the support level of 1.1000 speaks in favor of short positions. Support Levels: 1.1025, 1.0995, 1.0940, 1.0900 Resistance Levels: 1.1064, 1.1082, 1.1105, 1.1115, 1.1150, 1.1205, 1.1240, 1.1285 Trading Recommendations Sell Stop 1.1010. Stop-Loss 1.1040. Take-Profit 1.0995, 1.0940, 1.0900 Buy Stop 1.1040. Stop-Loss 1.1010. Take-Profit 1.1064, 1.1082, 1.1105, 1.1115, 1.1150, 1.1205, 1.1240, 1.1285 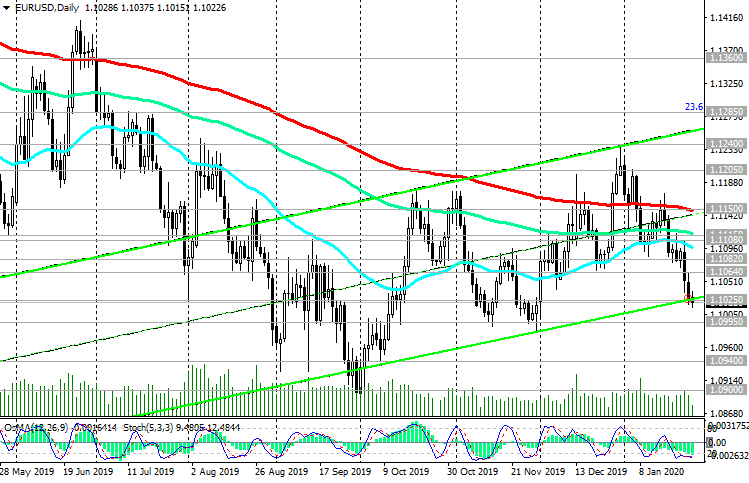 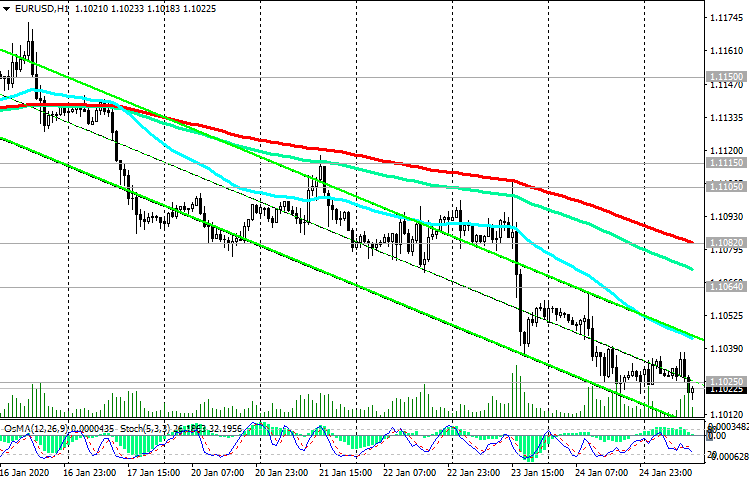 *) For up-to-date and detailed analytics and news on the forex market visit Tifia Forex Broker website tifia.com
|
|
|
|
 Similar Threads
|
||||
| Thread | Thread Starter | Forum | Replies | Last Post |
| Tifia Daily Market Analytics | TifiaFX | Forex Analysis | 0 | 22-03-2017 14:17 |
| Tifia Daily Market Analytics | TifiaFX | Forex Analysis | 0 | 16-03-2017 14:48 |
| Tifia Daily Market Analytics | TifiaFX | Forex Analysis | 0 | 14-03-2017 09:52 |
| Daily Market Analysis by FxGrow | FxGrow10 | Forex Analysis | 0 | 06-05-2015 01:03 |
| Daily Market update by UWC | effexx | Trading Journals | 156 | 01-03-2012 10:40 |


