Forex Forums | ForexLasers.com |
|
|||||||
 |
|
|
LinkBack | Thread Tools | Search this Thread |
|
#41
 26-05-2017, 07:25
|
||||
|
||||
|
NZD/USD is expected to trade in a higher range as the movement is supported by a rising trend line. The pair has been riding a bullish trend line since May 19, which confirmed a positive outlook. The upward momentum is further reinforced by the rising 20-period and 50-period moving averages. The relative strength index is mixed to bullish.
To conclude, as long as 0.6980 holds on the downside, look for a new advance to 0.7080 and even to 0.7095 in extension. The pair is trading above its pivot point. It is likely to trade in a wider range as long as it remains above its pivot point. Therefore, long positions are recommended with the first target at 0.7080 and the second one at 0.7095. In the alternative scenario, the short position is recommended with the first target at 0.6960 if the price moves below its pivot points. A break of this target may push the pair further downwards, and one may expect the second target at 0.6930. The pivot point is at 0.6980. Resistance levels: 0.7080, 0.7095, and 0.7135 Support levels: 0.6960, 0.6930, and 0.6900 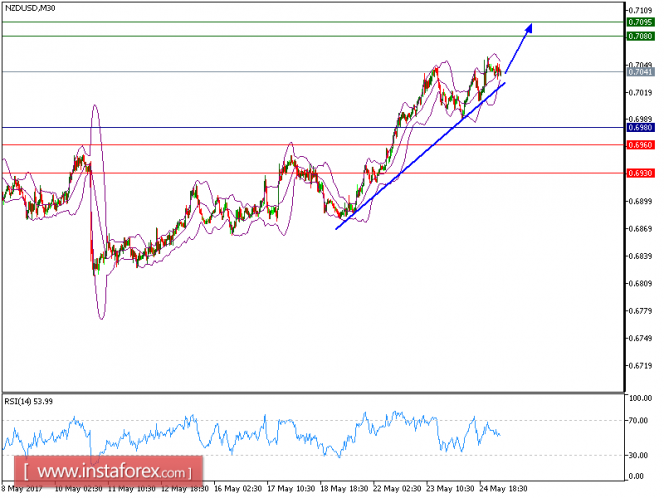 
|
|
#42
02-06-2017, 16:30
|
||||
|
||||
|
Overview:
The NZD/USD pair is in a bullish trend from the support levels of 0.7001 and 0.7053. As a consequence, the first and second support levels are seen at 0.7053 and 0.7001 respectively. Currently, the price is in a strong bullish channel. This is confirmed by the RSI indicator signaling that we are still in a bullish trending market. As the price is still above the moving average (100), major support is seen at 0.7005, which coincides with a golden ratio (61.8% of Fibonacci retracement levels). Consequently, the second support is set at the level of 0.7001. So, the market is likely to show signs of a bullish trend around the spot of 0.7001/0.7053. Consequently, the second support is set at the level of 0.7001. So, the market is likely to show signs of a bullish trend around the spot of 0.7001/0.7053. In other words, buy orders are recommended above the level of 0.7053 with the first target at the level of 0.7121. Furthermore, if the trend is able to breakout through the first resistance level of 0.7121, we should see the pair climbing towards the second resistance (0.7166) to test it. It would also be wise to consider where to place a stop loss; this should be set below the second support of 0.7001. 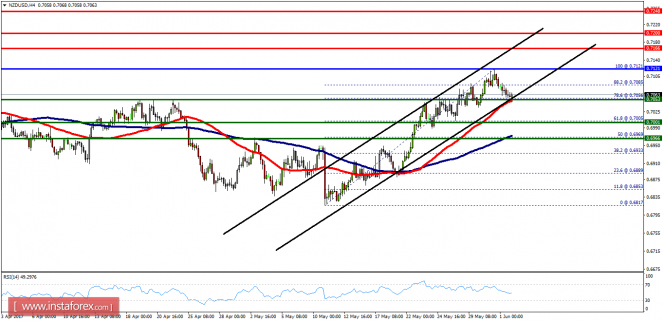
|
|
#43
09-06-2017, 18:51
|
||||
|
||||
|
NZD/USD has been trading in ta ight range and long position is still recommended. The pair is expected to trade with a bullish bias above 0.7165. Although the pair broke below the 20-period and 50-period moving averages, it is still trading above the key support at 0.7185, which should limit the downside potential. Even though a continuation of consolidation cannot be ruled out, its extents should be limited.
To conclude, as long as 0.7165 is not broken, look for a new upside to 0.7260 and even to 0.7280 in extension. At present, the pair is trading above its pivot point. It is likely to trade in a higher range as long as it remains above its pivot point. Therefore, long position is recommended with the first target at 0.7260 and the second one at 0.7300. In the alternative scenario, short position is recommended with the first target at 0.7145 if the price moves below its pivot points. A break of this target is expected to push the pair further downwards, and one may expect the second target at 0.7100. The pivot point lies at 0.7165. Graph Explanation: The black line shows the pivot point; the present price above pivot point indicates the bullish position and below pivot points indicates the short position. The red lines shows the support levels and the green line indicates the resistance levels. These levels can be used for enter and exit trades. Resistance levels: 0.7260, 0.7280, and 0.73000 Support levels: 0.7145,0.7100, and 0.7045 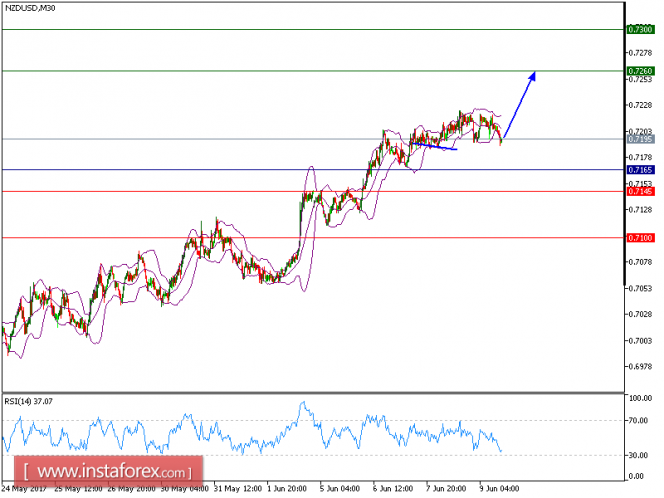
|
|
#44
16-06-2017, 11:57
|
||||
|
||||
|
NZD/USD has been in a bullish non-volatile trend since the break above 0.7050 resistance level. Currently the price is showing some volatility in the market on the back of recent economic reports from the US and New Zealand. New Zealand published the GDP report at 0.5% which was better than previous value of 0.4% but worse than expected value of 0.7% which affected the NZD negatively yesterday. Moreover, the Fed rate hike decision provided some positive gains on USD side which currently paused the NZD bullish trend. Today NZ Business Manufacturing Index was published which showed a rise to 58.5 from 56.9 previously and the news helped NZD to make some gains today. The United States will unveil the Building Permits report which is expected to increase to 1.25M from 1.23M previously. The Housing Starts report is also expected to show a rise to 1.23M from 1.17M. As the high impact US reports are to be published, a good amount of volatility is expected to hit the market today where positive USD reports may lead to counter trend move in this pair in the coming days.
Now let us look at the technical view. The price has moved in a non-volatile way since the break above the resistance at 0.7050. There have been very little retracements in the trend so far which has taken the price quite far from the dynamic level of 20 EMA. As of the recent bearish price action, currently the pair is expected to retrace back to 20 EMA. If 20 EMA is breached below, then the price may fall to 0.7050 level to retest it as a support before proceeding further upward. The bias is currently bullish in this pair until the price breaks below 0.7050 with a daily close. 
|
|
#45
16-06-2017, 11:59
|
||||
|
||||
|
Wave summary:
Our preferred count remains that a low likely was seen with the test of 1.5370 and wave iii/ higher is ready to develop. That said, we need a break above the resistance line near 1.5532 to confirm that wave ii/ has completed and wave iii/ higher to above 1.6237 is developing. Until the break above the resistance-line near 1.5532 is seen, we must allow for a retest of the 1.5370 low and even a spike below, but that should be short lived. Trading recommendation: We are long EUR from 1.5540 with stop placed at 1.5340. If you are not long EUR yet, then buy a break above 1.5532 and use the same stop. 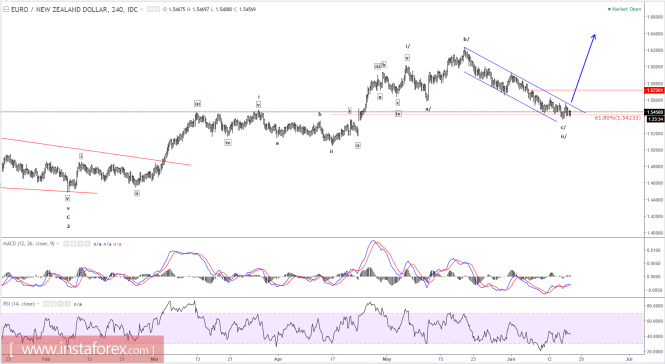
|
|
#46
22-06-2017, 13:58
|
||||
|
||||
|
Our 20th June, targets have been hit precisely as predicted. NZD/USD rebounded from our second target 0.7195 and now is expected to trade with a bullish outlook. The pair made a rebound from 0.7195 (the low of June 21) and broke above both 20-period and 50-period moving averages. The relative strength index lacks downward momentum.
Hence, as long as 0.7210 holds on the downside, expect a further upside to 0.7260 and even to 0.7280 in extension. Strategy: BUY Stop Loss: 0.7230. Take Profit: 0.7300 Chart Explanation: The black line shows the pivot point. Currently, the price is above the pivot point which indicates the bullish position. If it is below the pivot points, it indicates the short position. The red lines show the support levels and the green line indicates the resistance levels. These levels can be used to enter and exit trades. Resistance levels: 0.7300, 0.7320, and 0.7355 Support levels: 0.7210, 0.7195, and 0.7160 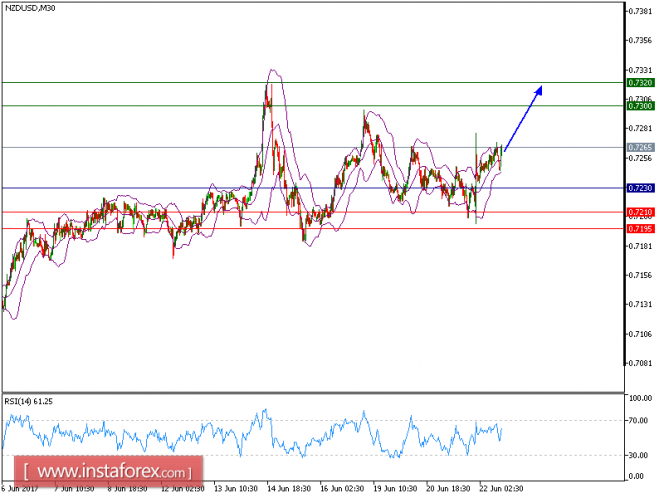
|
|
#47
27-06-2017, 23:27
|
||||
|
||||
|
All our targets which we predicted yesterday of the NZD/USD pair have been hit. NZD/USD is still trading on upside and expected to follow the bullish bias above 0.7275. Although the pair broke below its 20-period and 50-period moving averages, a support base at 0.7275 has been formed and has allowed for a temporary stabilization. The relative strength index lacks downward momentum.
Hence, as long as 0.7275 holds on the downside, look for a further rise to 0.7350 and even to 0.7375 in extension. Strategy: BUY Stop Loss: 0.7275. Take Profit: 0.7350 Chart Explanation: The black line shows the pivot point. Currently, the price is above the pivot point which indicates the bullish position. If it is below the pivot points, it indicates the short position. The red lines show the support levels and the green line indicates the resistance levels. These levels can be used to enter and exit trades. 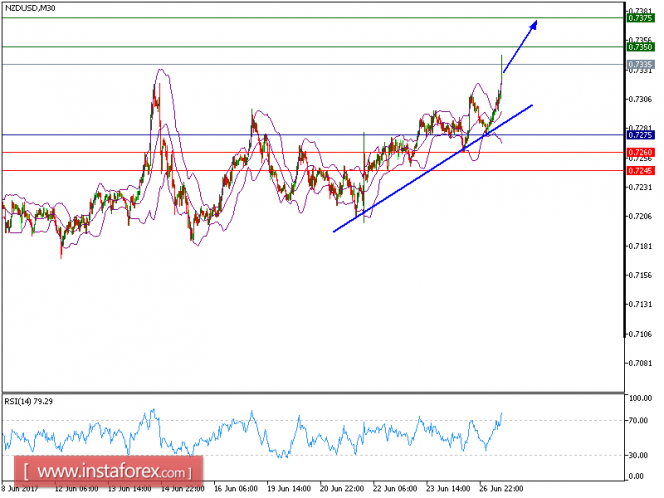
|
|
#48
29-06-2017, 16:01
|
||||
|
||||
|
NZD/USD is expected to continue trading in a lower range and we will keep our yesterday's target intact. The pair recorded lower tops and lower bottoms, which confirmed the negative outlook. The downward momentum is further reinforced by the declining 20-period and 50-period moving averages. The relative strength index is capped by the bearish trend line.
Hence, as long as 1.3075 is not surpassed, expect a further downside to 0.7255 and even to 0.7240 in extension. Strategy: SELL Stop Loss: 0.7320. Take Profit: 0.7255 Chart Explanation: The black line shows the pivot point. Currently, the price is above the pivot point which indicates the bullish position. If it is below the pivot points, it indicates the short position. The red lines show the support levels and the green line indicates the resistance levels. These levels can be used to enter and exit trades. Resistance levels: 0.7355, 0.7375, and 0.7405 Support levels: 0.7255, 0.7240, and 0.7200 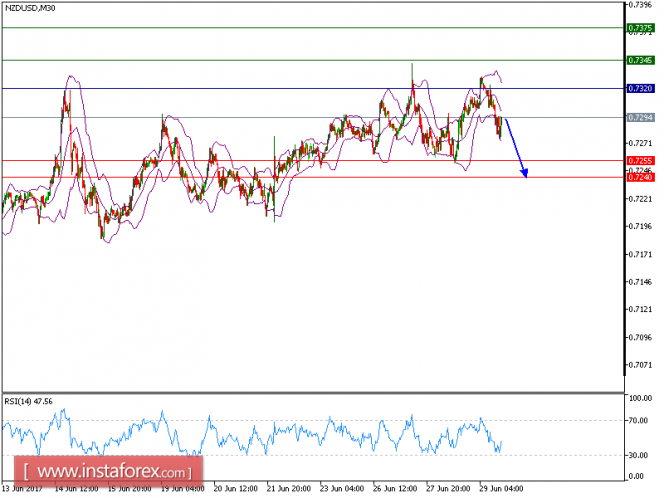
|
|
#49
05-07-2017, 01:46
|
||||
|
||||
|
As predicted NZD/USD downside targets have been hit and NZD/USD is expected to continue its downside movement. The pair remains below its key resistance at 0.7305 and is looking for a lower bottom. The 20-period moving average stays below the 50-period moving average, and the relative strength index is around its neutrality area at 50, lacking upward momentum.
As long as the key resistance at 0.7305 is not broken above, the risk of a drop to 0.7240 remains high. Further down leg to 0.7225 is also likely. Strategy: SELL Stop Loss: 0.7305. Take Profit: 0.7240 Chart Explanation: The black line shows the pivot point. Currently, the price is above the pivot point which indicates the bullish position. If it is below the pivot points, it indicates the short position. The red lines show the support levels and the green line indicates the resistance levels. These levels can be used to enter and exit trades. Resistance levels: 0.7320, 0.7345, and 0.7370 Support levels: 0.7240, 0.7225, and 0.7200 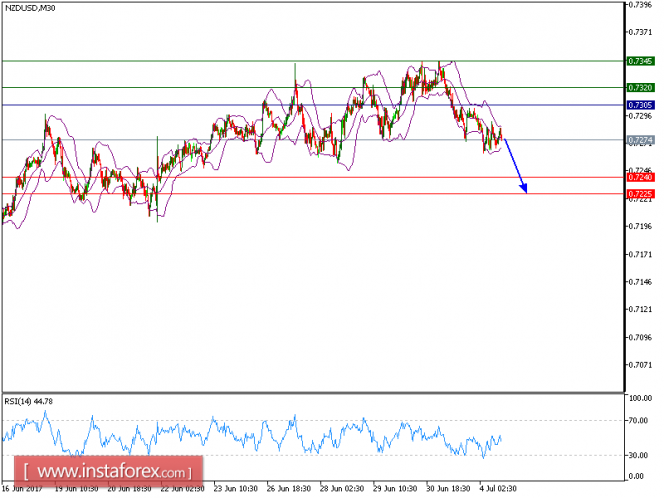
|
|
#50
07-07-2017, 20:02
|
||||
|
||||
|
NZD/USD has been quite volatile recently, struggling to reach the resistance level of 0.7370. This week, New Zealand has provided mixed economic reports which are the main reason behind the struggle of the bullish move in this pair now. Recently, NZ NZIER Business Confidence report was published with a rise to 18 from the previous value of 17 and ANZ Commodity price showed a decrease to 2.1% from the previous value of 3.2%. Today is an important day for USD as a batch of high impact economic reports are due later. Today, US Average Hourly Earnings report is to be published which is expected to show a slight increase to 0.3% from the previous score of 0.2%, Non-Farm Unemployment Change is expected to show an increase to 175k from the previous value of 138k, and the Unemployment Rate is expected to be unchanged at 4.3%. Besides, FED Monetary Policy report is also going to be published today which is expected to be hawkish as well. Though the economic calendar is packed with high impact data from the US today, any negative outcome of any report may lead to further gains on NZD in the coming days.
Now let us look at the technical chart. The price has recently bounced off the dynamic level support of 20 EMA and rejected the bears of the level. Amid the current volatility in the market, if the price remains above the 20 EMA there are higher chances of moving towards the resistance of 0.7370 in the coming days. On the other hand, if the price breaks below 20 EMA with a daily close, the bullish bias will come to end. A daily close today will signal a further move in this pair. 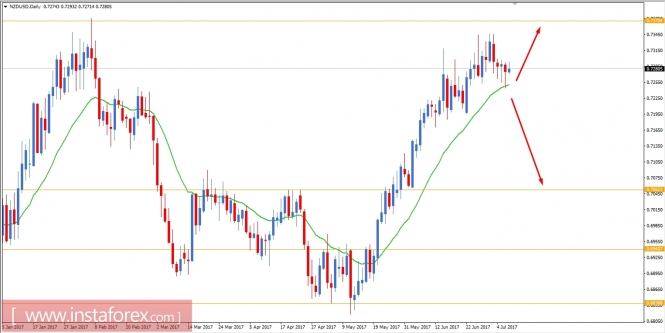
|
|
#51
07-07-2017, 20:19
|
||||
|
||||
|
NZD/USD has been quite volatile recently, struggling to reach the resistance level of 0.7370. This week, New Zealand has provided mixed economic reports which are the main reason behind the struggle of the bullish move in this pair now. Recently, NZ NZIER Business Confidence report was published with a rise to 18 from the previous value of 17 and ANZ Commodity price showed a decrease to 2.1% from the previous value of 3.2%.
Today is an important day for USD as a batch of high impact economic reports are due later. Today, US Average Hourly Earnings report is to be published which is expected to show a slight increase to 0.3% from the previous score of 0.2%, Non-Farm Unemployment Change is expected to show an increase to 175k from the previous value of 138k, and the Unemployment Rate is expected to be unchanged at 4.3%. Besides, FED Monetary Policy report is also going to be published today which is expected to be hawkish as well. Though the economic calendar is packed with high impact data from the US today, any negative outcome of any report may lead to further gains on NZD in the coming days.
|
|
#52
12-07-2017, 20:25
|
||||
|
||||
|
NZD/USD is expected to trade with a bullish outlook. Although the pair posted a pullback from 0.7240, it is still trading above the key support at 0.7200 (the low of July 11), which should limit the downside potential. Even though a continuation of the consolidation cannot be ruled out, its extent should be limited.
To conclude, as long as 0.7245 is not broken, look for a rebound with targets at 0.7280 and 0.7300 in extension. Strategy: BUY Stop Loss: 0.7245 Take Profit: 0.7280 Chart Explanation: The black line shows the pivot point. Currently, the price is above the pivot point which indicates the bullish position. If it is below the pivot points, it indicates the short position. The red lines show the support levels and the green line indicates the resistance levels. These levels can be used to enter and exit trades. Resistance levels: 0.7280, 0.7300, and 0.7375 Support levels: 0.7215, 0.7200, and 0.7165 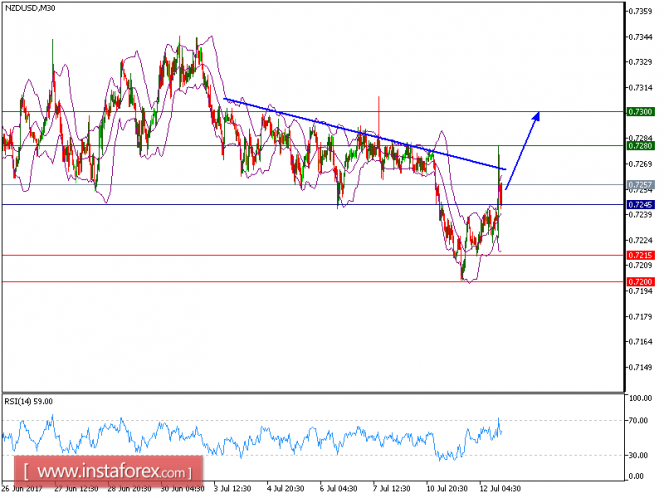
|
|
#53
14-07-2017, 13:02
|
||||
|
||||
|
The NZDUSD currency pair experienced high volatility during the week and moved higher towards the value of 0.7200.
The bullish bias remains in the market, taking us closer to the resistance level 0.7350. At the same time, traders should pay attention not to take long positions, in case the "bullish" potential will not fall and prices were able to firmly fix above the value of 0.7350, it will open the way through 0.7400 / 0.7480. - It is recommended to buy the pair after fixing the price above the level of 0.7370 with the target to move near 0.7400 / 0.7480. - Selling the pair is recommended after the resumption of the downward interest, probably after the formation of the cluster within the level of 0.7350. 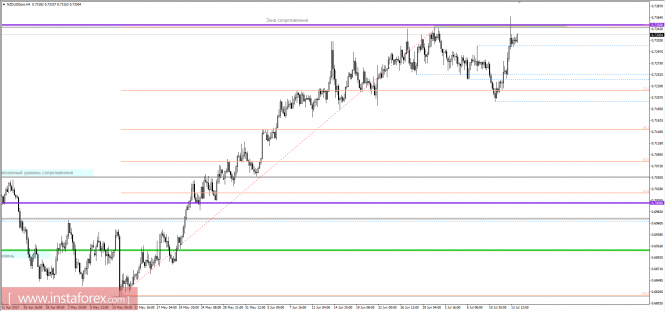
|
|
#54
20-07-2017, 20:25
|
||||
|
||||
|
Our target which we predicted in 18th July analysis has been hit. NZD/USD is expected to continue its upside movement. Although the pair posted a pullback, it is still trading above the key support at 0.7330, which should limit the downside potential.
The relative strength index calls for a new upleg. Hence, as long as 0.7330 is not broken, look for a further rise to 0.7405 and even to 0.7435 in extension. Strategy: BUY Stop Loss: 0.7330 Take Profit: 0.7405 Chart Explanation: The black line shows the pivot point. Currently, the price is above the pivot point which indicates the bullish position. If it is below the pivot points, it indicates the short position. The red lines show the support levels and the green line indicates the resistance levels. These levels can be used to enter and exit trades. Resistance levels: 0.740, 0.7405, and 0.7445 Support levels: 0.7310, 0.7285, and 0.7245 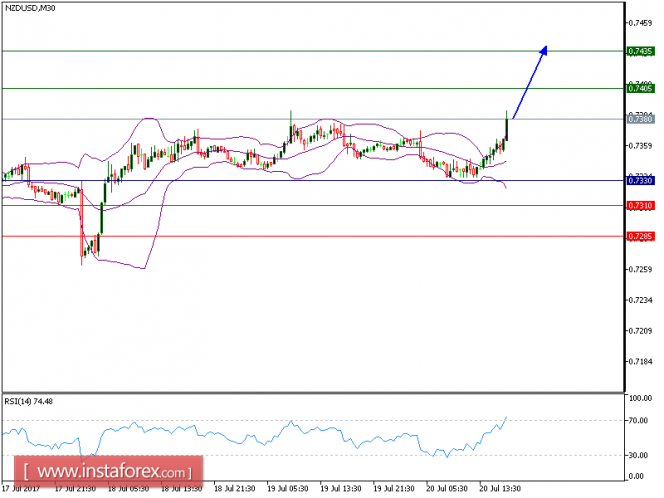
|
|
#55
21-07-2017, 17:24
|
||||
|
||||
|
Both of our targets have been hit which we predicted in yesterday's analysis. NZD/USD is still expected to trade in a higher range as the pair is trading above the trend line. The pair accelerated on the upside after breaking above the upper boundary of the bearish channel. The upward momentum is further reinforced by the rising 20-period and 50-period moving averages. The relative strength index is bullish and calls for further advance.
Hence, as long as 0.7380 holds on the downside, look for a new advance to 0.7470 and even to 0.7500 in extension. Chart Explanation: The black line shows the pivot point. Currently, the price is above the pivot point which indicates the bullish position. If it is below the pivot points, it indicates the short position. The red lines show the support levels and the green line indicates the resistance levels. These levels can be used to enter and exit trades. Resistance levels: 0.7470, 0.7500, and 0.7545 Support levels: 0.7360, 0.7330, and 0.7285 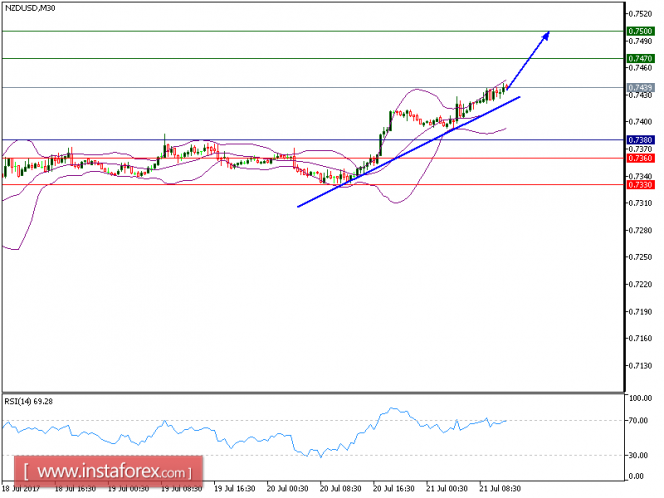
|
|
#56
26-07-2017, 23:32
|
||||
|
||||
|
NZD/USD is still expected to trade with bearish bias as far as the price trades near 0.7460. The pair is under pressure below its key resistance at 0.7460. The downward momentum is further reinforced by the declining 50-period moving average.
Hence, as long as 0.7460 is not surpassed, another decline to 0.7400 and even to 0.7380 seems more likely to occur. Strategy: SELL Stop Loss: 0.7460 Take Profit: 0.7400 Chart Explanation: The black line shows the pivot point. Currently, the price is above the pivot point which indicates the bullish position. If it remains below the pivot point, it indicates the short position. The red lines show the support levels and the green line indicates the resistance levels. These levels can be used to enter and exit trades. Resistance levels: 0.7480, 0.7500, and 0.7530 Support levels: 0.7400, 0.7380, and 0.7360 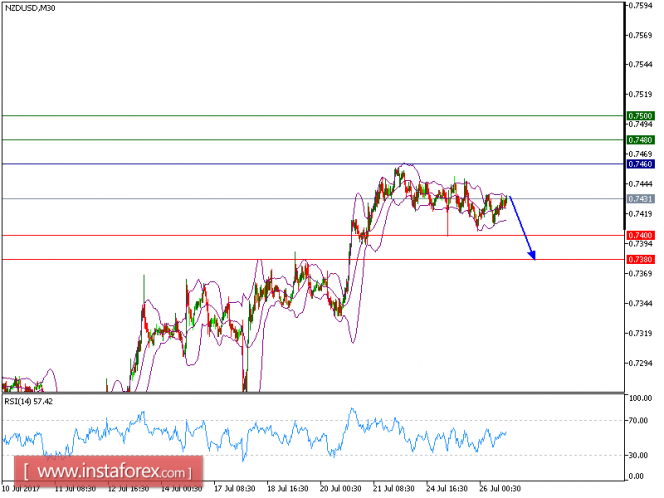
|
|
#57
28-07-2017, 03:22
|
||||
|
||||
|
NZD/USD is expected to trade in higher range and continue its upside movement. The pair accelerated to the upside after breaking above the declining trend line since July 21. The upward momentum is further reinforced by both rising 20-period and 50-period moving averages. The relative strength index is bullish and calls for a further rise.
To sum up, as long as the price holds above 0.7485, look for a new challenge to 0.7560 and even to 0.7590 in extension. Strategy: BUY Stop Loss: 0.7485 Take Profit: 0.7560 Chart Explanation: The black line shows the pivot point. Currently, the price is above the pivot point which indicates the bullish position. If it remains below the pivot point, it will indicate the short position. The red lines show the support levels and the green line indicates the resistance levels. These levels can be used to enter and exit trades. Resistance levels: 0.7560, 0.7590, and 0.7630 Support levels: 0.7450, 0.7410, and 0.7380 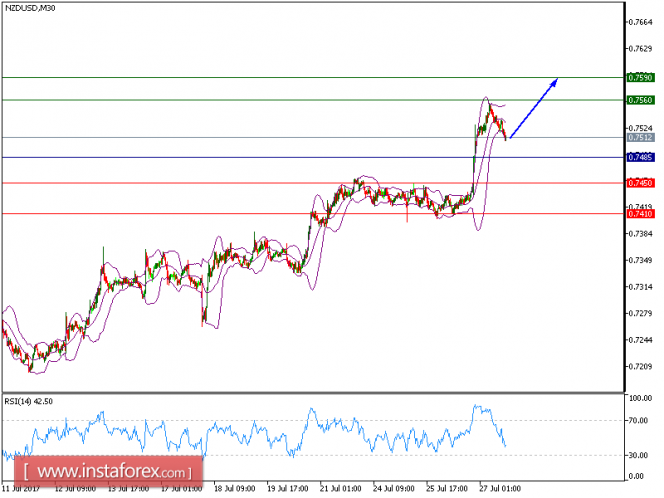
|
|
#58
02-08-2017, 09:26
|
||||
|
||||
|
NZD/USD is expected to trade in a lower range and is under pressure. The pair broke below the lower boundary of Bollinger Bands, which indicated the continuation of a bearish trend. The downward momentum is further reinforced by declining 20-period and 50-period moving averages. The relative strength index broke below its 30 level.
To conclude, as long as 0.7475 is not surpassed, look for a further decline to 0.7380 and even to 0.7350 in extension. Strategy: SELL Stop Loss: 0.7475 Take Profit: 0.7380 Chart Explanation: The black line shows the pivot point. Currently, the price is above the pivot point which indicates the bullish position. If it remains below the pivot point, it will indicate the short position. The red lines show the support levels and the green line indicates the resistance levels. These levels can be used to enter and exit trades. Resistance levels: 0.7495, 0.7525, and 0.7575 Support levels: 0.7380, 0.7350, and 0.7300 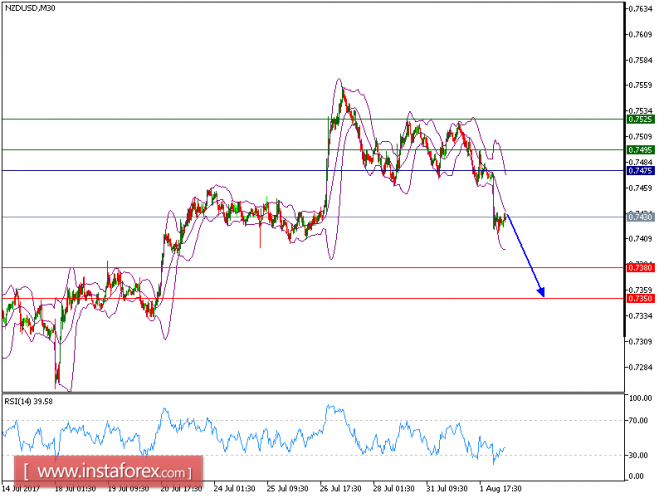
|
|
#59
04-08-2017, 17:30
|
||||
|
||||
|
The NZD/USD is in a bearish short-term trend as long as price is below 0.7525. Price is making lower lows and lower highs since July 27th. I expect more Dollar strength to push this pair towards 0.73-0.7260 at least.
Blue lines - bearish channel The NZD/USD is inside a bearish short-term channel. Channel resistance is at 0.7455. In this area, we also find the resistance by the Ichimoku cloud. So price has turned back up to back test the breakdown of the cloud....holding below the cloud will strengthen our bearish scenario for a move lower. 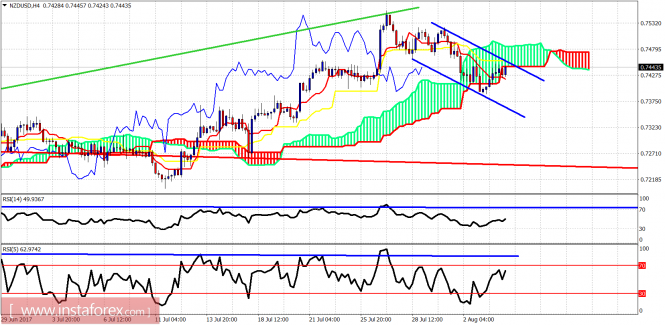
|
|
#60
10-08-2017, 23:49
|
||||
|
||||
|
All our targets which we predicted in Yesterday's analysis has been hit. NZD/USD is still under pressure and expected to trade with a bearish outlook. Although the pair broke above its 20-period and 50-period moving averages, it is still trading below the key resistance at 0.7315, which should limit the upside potential. Even though a continuation of technical rebound cannot be ruled out, its extent should be limited.
Therefore, as long as 0.7315 holds on the upside, a further drop to 0.7240 and even to 0.7210 seems more likely to occur. Chart Explanation: The black line shows the pivot point. Currently, the price is above the pivot point which indicates the bullish position. If it remains below the pivot point, it will indicate the short position. The red lines show the support levels and the green line indicates the resistance levels. These levels can be used to enter and exit trades. Resistance levels: 0.7350, 0.7370, and 0.7390 Support levels: 0.7240, 0.7210, and 0.7180 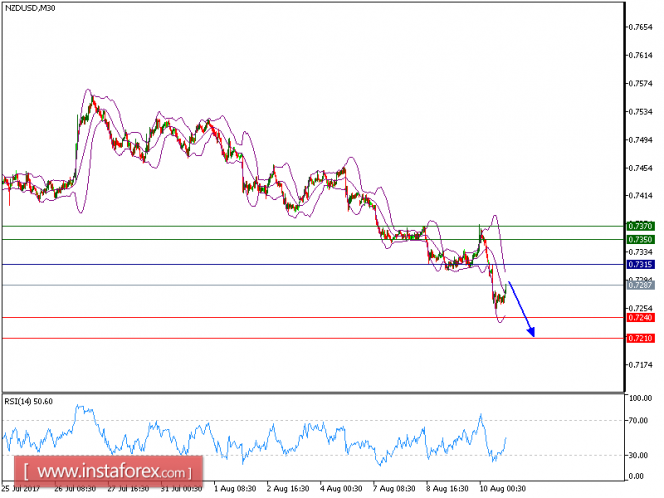
|
|
#61
18-08-2017, 17:51
|
||||
|
||||
|
NZD/USD has been quite volatile recently on the way to retesting the resistance area of 0.7370-0.7460. Yesterday, NZD has lost grounds due to positive economic reports from the United States which lead to more volatility in this pair recently. New Zealand posted a positive PPI input report published yesterday at 1.4% which previously was at 0.8% and expectation was at 0.9%. At the same time, the PPI Output was als positive at 1.3% which was expected to decrease to 0.7% from 1.4%. However, the currency has gained quite impulsively in the early hours of the market but could not sustain it long enough. On the other hand, today the Prelim UoM Consumer Sentiment report is going to be published which is expected to show a slight increase to 94.0 from the previous figure of 93.4.
If the report shows a better than expected result, then we might see more bearish pressure in this pair in the coming days. NZD has been quite positive with the economic reports recently but could not maintain gains long enough against USD, which indicates that USD is stronger than NZD despite the variation of economic report effects. Now let us look at the technical view. The price is currently proceeding higher with a target towards the resistance area of 0.7370-0.7460 but in a volatile corrective structure. The price is currently expected to reject the resistance area and then proceed lower towards 0.7050 support level in the coming days. As the price remains below the resistance level of 0.7460, the bearish bias is expected to continue further in the coming days. 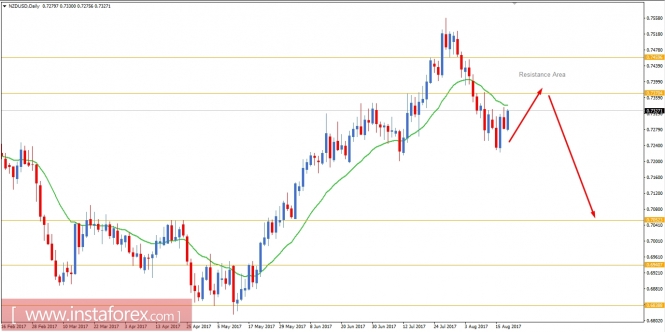
|
|
#62
18-08-2017, 18:07
|
||||
|
||||
|
NZD/USD is expected to trade in higher range. The pair is trading above its ascending 20-period and 50-period moving averages, which play support roles and maintain the bullish bias. The relative strength index is supported by a rising trend line.
To sum up, as long as 0.7280 is not broken, further upside to 0.7350 and even to 0.7365 seems more likely to occur. The black line shows the pivot point. Currently, the price is above the pivot point which indicates the bullish position. If it remains below the pivot point, it will indicate the short position. The red lines show the support levels and the green line indicates the resistance levels. These levels can be used to enter and exit trades. Resistance levels: 0.7350, 0.7365, and 0.7400 Support levels: 0.7250, 0.7225, and 0.7175 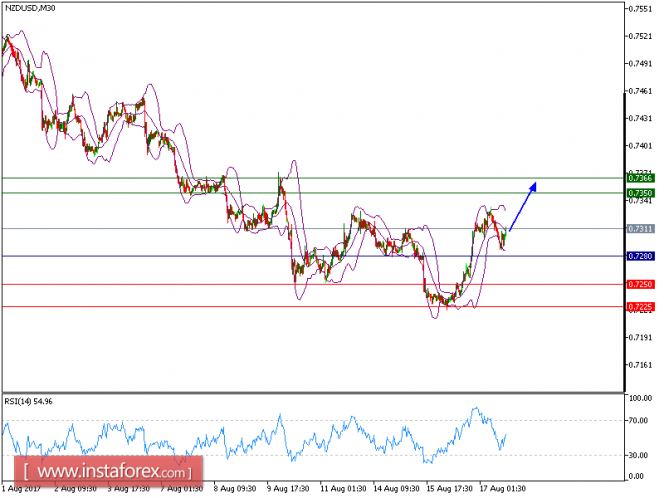
|
|
#63
24-08-2017, 19:45
|
||||
|
||||
|
NZD/USD is under pressure and expected to continue its downside movement. The pair failed to break above its key resistance at 0.7235 and consolidated on the downside. The declining 20-period moving average crossed below the 50-period one, which is a negative signal. The relative strength index is below its neutrality level at 50 and lacks upward momentum.
As long as 0.7235 holds on the upside, look for a further drop towards 0.7170 and even 0.7145 in extension. The black line shows the pivot point. Currently, the price is above the pivot point which indicates the bullish position. If it remains below the pivot point, it will indicate the short position. The red lines show the support levels and the green line indicates the resistance levels. These levels can be used to enter and exit trades. Resistance levels: 0.7255, 0.7280, and 0.7315 Support levels: 0.7170, 0.7145, and 0.7100 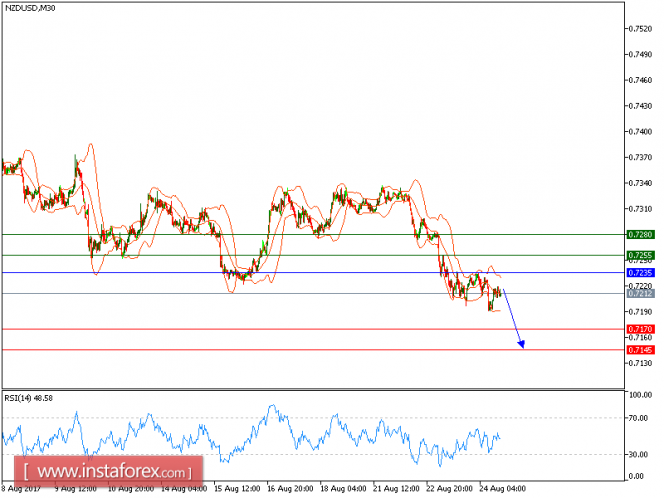
|
|
#64
25-08-2017, 13:17
|
||||
|
||||
|
NZD/USD has been quite bearish in nature but currently, it is showing some bullish intervention denoting certain retracement in the pair. Though NZD spending has been decreased a bit according to the recent economic reports but the Trade Balance showed better than expected which did help in some growth today. Recently NZD Trade Balance was published at 85M which was previously at 246M but it was expected to be negative at -200M. On the other hand, today's USD Core Durable Goods Orders report is going to be published which is expected to increase to 0.4% from the previous value of 0.1% and Durable Goods Orders is expected to be negative at -0.6% from the previous value of 6.4%.
Along with these economic reports, FED Chair Yellen is going to speak today about the nation's interest rate decision and monetary policy which is expected to be hawkish in nature. To sum up, NZD has been recently heavily dominated by USD which is expected to continue further but NZD do seem to show some gain for the short-term due to positive trade balance report but the bearish trend is expected to continue further. Now let us look at the technical view, the price is currently showing some bullish pressure which is expected to reach towards the dynamic level of 20 EMA before proceeding with the bearish trend. If the price rejects off the 20 EMA with a daily close then we will be looking forward to the price reaching the 0.7050 support level. As the price remains below the resistance area of 0.7370-0.7460 the bearish bias is expected to continue further. 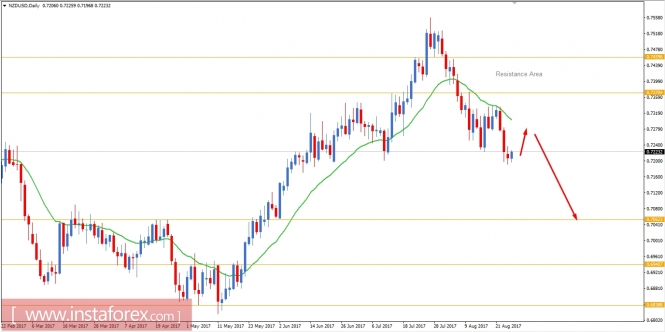
|
|
#65
01-09-2017, 10:00
|
||||
|
||||
|
NZD/USD has been dominated by bears in a nonvolatile manner since the bounce from 0.7550 resistance area. NZD has been quite negative with the reports recently whereas USD has been quite positive and showing consistent growth in the economic reports. Today NZD Overseas Trade Index report was published with worse value at 1.5% from the previous value of 3.9% which was expected to be at 3.5% at least.
The worse report did put the currency in more pressure against USD today whereas high impact USD economic reports are going to be published. Today USD Average Earning Index report is going to be published which is expected to decrease to 0.2% from the previous value of 0.3%, Non-Farm Employment Change is expected to decrease at 180k from the previous figure of 209k, Unemployment Rate is expected to be unchanged at 4.3% and ISM Manufacturing PMI report is expected to have slight increase to 56.5 from the previous figure of 56.3. To sum up, today a good amount of volatility is expected to hit the pair whereas USD is expected to gain more strength over NZD in the coming days. Now let us look at the technical view, the price has been quite loyal to the dynamic level of 20 EMA rejecting the bulls recently. Currently, the price is expected to be bearish in nature with a target towards 0.6940-0.7050 support area. As the price remains below the dynamic level of 20 EMA the bearish bias is expected to continue further. 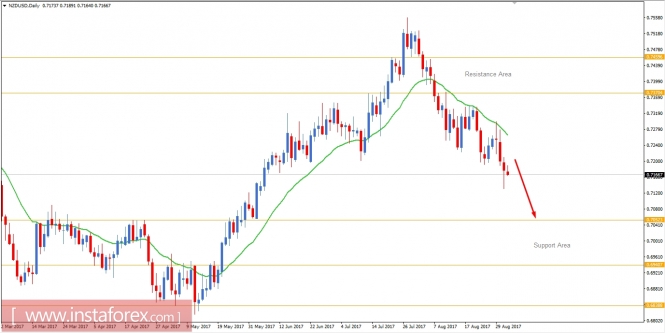
|
|
#66
09-09-2017, 10:38
|
||||
|
||||
|
Overview:
The NZD/USD pair bullish trend from the support levels of 0.7231 and 0.7293. Currently, the price is in a bullish channel. This is confirmed by the RSI indicator signaling that we are still in a bullish trending market. As the price is still above the moving average (100), immediate support is seen at 0.7293, which coincides with a golden ratio (38.2% of Fibonacci). Consequently, the first support is set at the level of 0.7293. So, the market is likely to show signs of a bullish trend around the spot of 0.7293. In other words, buy orders are recommended above the price of 0.7293 with the first target at the level of 0.7343. Furthermore, if the trend is able to breakout through the first resistance level of 0.7343. We should see the pair climbing towards the double top (0.7393) as next objective. It would also be wise to consider where to place a stop loss; this should be set below the second support of 0.7231. 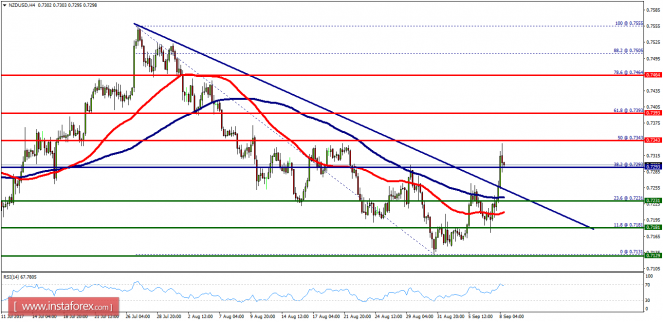
|
|
#67
15-09-2017, 17:45
|
||||
|
||||
|
NZD/USD is under pressure and expected to continue the downside movement. Despite the recent rebound from 0.7220 (the low of September 13), the pair is trading below its key resistance at 0.7265, which should limit the upside potential. The declining 50-period moving average is playing a resistance role. The relative strength index is below its neutrality level at 50.
To conclude, below 0.7265, look for a new drop with targets at 0.7170 and 0.7145 in extension. The black line shows the pivot point. Currently, the price is above the pivot point, which indicates the bullish position. If it remains below the pivot point, it will indicate the short position. The red lines show the support levels and the green line indicates the resistance levels. These levels can be used to enter and exit trades. Resistance levels: 0.7290, 0.7305, and 0.7350 Support levels: 0.7170, 0.7145, and 0.7100 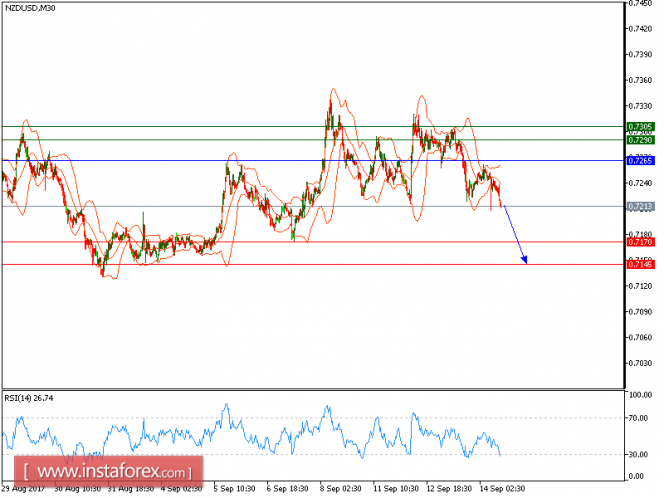
|
|
#68
19-09-2017, 23:15
|
||||
|
||||
|
NZD/USD is expected to trade with a bullish outlook above the key support level of 0.7245. From a technical point of view, the relative strength index is bullish and is calling for further upside. In addition, the 20-period moving average on a 30-minute chart crossed above the 50-period moving average triggering a bullish signal.
As a consequence, long positions above 0.7245 with targets at 0.7310 and 0.7345 in extension can be considered. The black line is showing the pivot point. Currently, the price is above the pivot point, which indicates long positions. If it remains below the pivot point, it will indicate short positions. The red lines is showing the support levels and the green line is indicating the resistance levels. These levels can be used to enter and exit trades. Resistance levels: 0.7310, 0.7345, and 0.7380 Support levels: 0.7210, 0.7180, and 0.7150 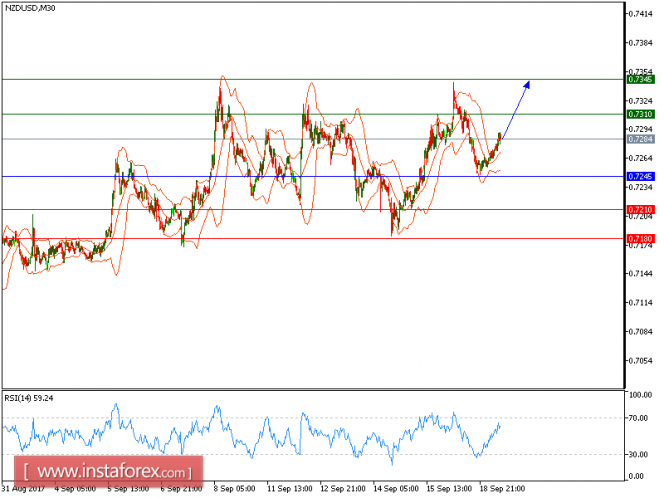
|
|
#69
06-10-2017, 16:36
|
||||
|
||||
|
All our targets which we predicted in yesterday's analysis have been hit. NZDUSD is still under pressure and expected to trade in a lower range. The pair recorded lower tops and lower bottoms since Oct. 3, which confirmed a negative outlook. The downward momentum is further reinforced by both declining 20-period and 50-period moving averages. The relative strength index advocates for a further decline.
To conclude, below 0.7120, look for a new test with targets at 0.7030 and 0.7000 in extension. The black line is showing the pivot point. Currently, the price is above the pivot point, which indicates long positions. If it remains below the pivot point, it will indicate short positions. The red lines are showing the support levels and the green line is indicating the resistance levels. These levels can be used to enter and exit trades. Resistance levels: 0.7145, 0.7170, and 0.7200 Support levels: 0.7030, 0.7000, and 0.6955 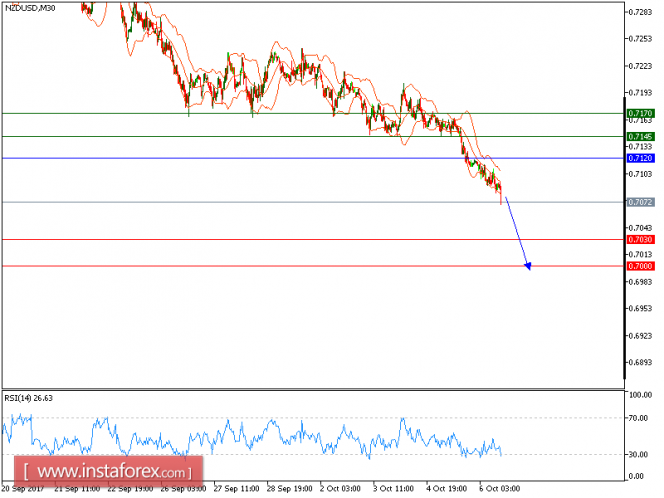
|
|
#70
20-10-2017, 13:55
|
||||
|
||||
|
Our first target which we predicted in yesterday's analysis has been hit. NZD/USD is still uder pressure. The pair accelerated on the downside and is trading below its descending 50-period moving average. The relative strength index is below its neutrality level at 50.
To conclude, as long as 0.7060 holds on the upside, look for a return to 0.7060. A break below this level would trigger another drop to 0.6900. The black line is showing the pivot point. Currently, the price is above the pivot point, which indicates long positions. If it remains below the pivot point, it will indicate short positions. The red lines are showing the support levels and the green line is indicating the resistance levels. These levels can be used to enter and exit trades. Resistance levels: 0.7115, 0.7150, and 0.7175 Support levels: 0.6930, 0.6900, and 0.6865 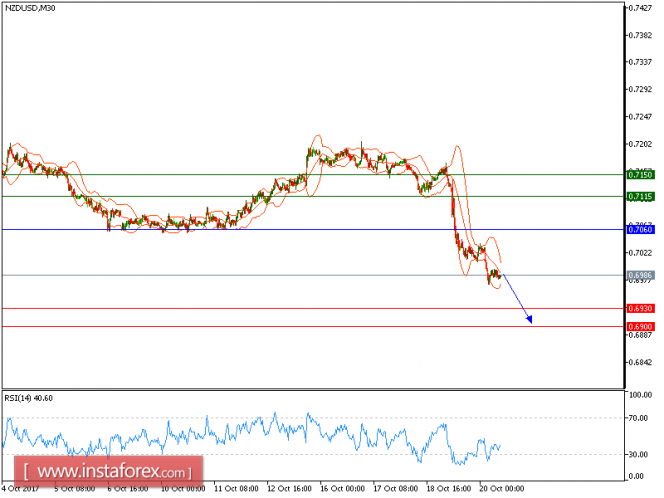
|
|
#71
20-10-2017, 14:04
|
||||
|
||||
|
Overview:
The NZD/USD pair has dropped sharply from the level of 0.7067 towards 0.6972. Now, the price is set at 0.6985 to act as a minor suport. It should be noted that volatility is very high for that the NZD/USD pair is still moving between 0.7020 and 0.6900 in coming hours. Furthermore, the price has been set below the strong resistance at the levels of 0.7020 and 0.7067, which coincides with the 23.6% Fibonacci retracement level. Additionally, the price is in a bearish channel now. Amid the previous events, the pair is still in a downtrend. From this point, the NZD/USD pair is continuing in a bearish trend from the new resistance of 0.7067. Thereupon, the price spot of 0.7067 remains a significant resistance zone. Therefore, a possibility that the NZD/USD pair will have downside momentum is rather convincing and the structure of a fall does not look corrective. In order to indicate a bearish opportunity below 0.7067, sell below 0.7067 or 0.7021 with the first targets at 0.6900 and 0.6849. However, the stop loss should be located above the level of 0.7070. 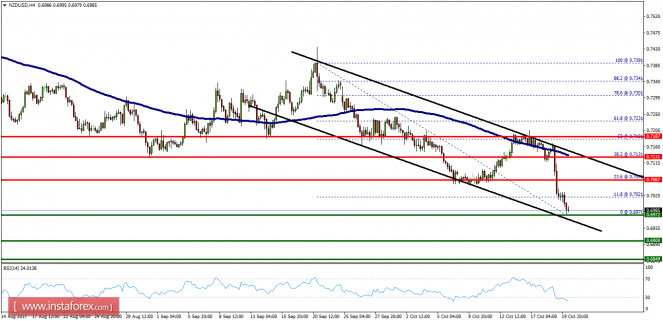
|
|
#72
27-10-2017, 19:48
|
||||
|
||||
|
Overview:
Pivot: 0.6860. The NZD/USD pair didn't make any significant moves yesterday. There are no changes in my technical outlook. The bias remains bearish in nearest term testing 0.6760 or lower. The NZD/USD pair continues to move downwards from the zone of 0.6942 and 0.7880. Yesterday, the pair dropped from the level of 0.6942 to 0.6942 which coincides with a ratio of 23.6% Fibonacci on the H4 chart. Today, the resistance is seen at the levels of 0.6945 and 0.7033. So, we expect the price to set below the strong resistance at the levels of 0.6945 and 0.7033 because the price is in a bearish channel now. The RSI starts signaling a downward trend. Consequently, the market is likely to show signs of a bearish trend. So, it will be good to sell below the level of 0.6942/0.6900 with the first target at 0.6800. If the NZD/USD pair is able to break out the daily support at 0.6800, the market will decline further to 0.6760 in order to test the daily support two. However, the price spot of 0.6942 remains a significant resistance zone. Thus, the trend is still bearish as long as the level of 0.6940 is not breached. 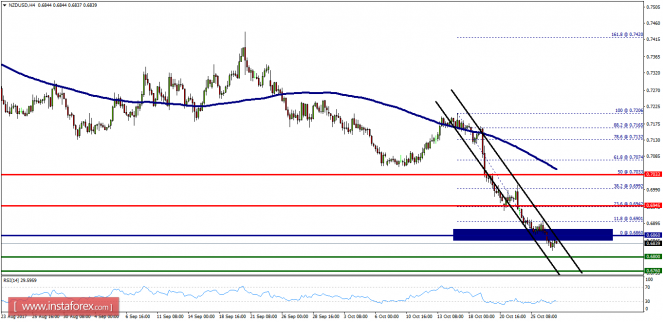
|
|
#73
03-11-2017, 15:35
|
||||
|
||||
|
We will retain our yesterday's bullish outlook of NZD/USD pair. The pair is consolidating above the key support at 0.6900, which should maintain the buying interest. Even though a continuation of the consolidation cannot be ruled out, its extent should be limited.
To conclude, as long as 0.6900 is not broken, look for a further upside with targets at 0.6950 and 0.6970 in extension. The black line is showing the pivot point. Currently, the price is above the pivot point, which indicates long positions. If it remains below the pivot point, it will indicate short positions. The red lines are showing the support levels and the green line is indicating the resistance levels. These levels can be used to enter and exit trades. Resistance levels: 0.6950, 0.6970, and 0.6995 Support levels: 0.6880, 0.6850, and 0.6725 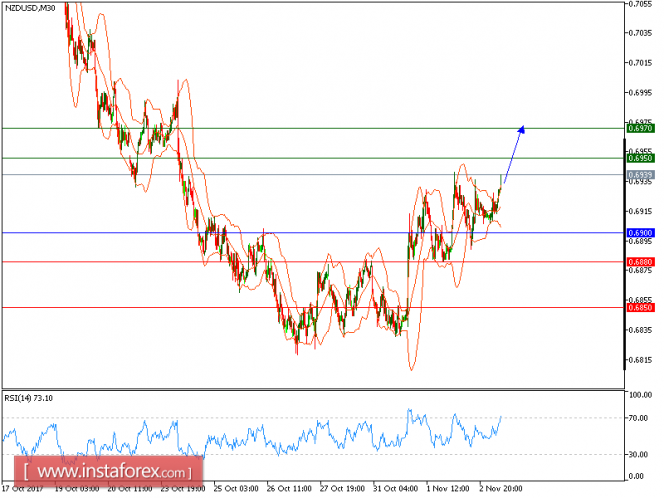
|
|
#74
10-11-2017, 11:51
|
||||
|
||||
|
Overview:
The NZD/USD pair tested the level of 0.6933 on the H1 chart. This pair will probably continue to move upwards from the level of 0.6933. However, the first resistance level is seen at 0.6963 followed by 0.6981 and 0.7003, while the weekly support 1 is seen at 0.6889 (major support this week). According to the previous events, the NZD/USD pair is still moving between the levels of 0.6933 and 0.7003. Furthermore, if the trend is able to break out the first resistance level at 0.6963, we could see the pair climbing towards the resistance levels of 0.6981 and 0.7003. Therefore, buy above the level of 0.6933 (major support) with the first target at 0.6981 in order to test the daily resistance 2 and further to 0.7003. Also, it should be noted that the level of 0.7003 is a good place to take profit on the H1 chart. On the other hand, in case a reversal takes place and the NZD/USD pair breaks through the support level of 0.6933, a further decline to 0.6862 can occur which would indicate a bearish market. On the whole, we are still looking for a strong bullish market as long as the trend is above the price of 0.6933. 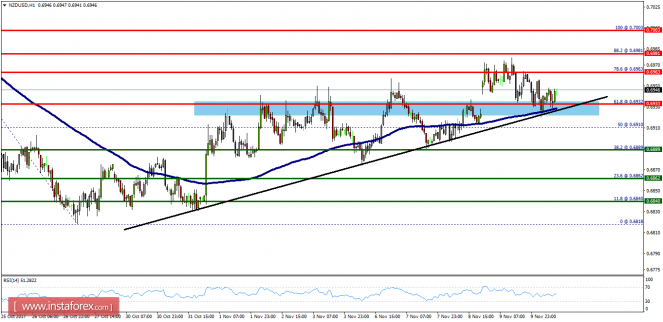
|
|
#75
15-11-2017, 20:26
|
||||
|
||||
|
NZD/USD is expected to trade with a bullish outlook and expected to continue the upside movement. The pair has reversed up after yesterday's strong rebound on its key support at 0.6860. A bullish cross between the 20-period and 50-period moving averages has been identified. In addition, the relative strength index is also turning up, and calling for a further advance.
In conclusion, as long as 0.6860 is not broken, the pair is likely to advance to 0.6935 and 0.6955 in extension. The black line shows the pivot point. Currently, the price is above the pivot point, which indicates long positions. If it remains below the pivot point, it will indicate short positions. The red lines are showing the support levels and the green line is indicating the resistance levels. These levels can be used to enter and exit trades. Resistance levels: 0.6935, 0.6955, and 0.6975 Support levels: 0.6840, 0.6820, and 0.6790 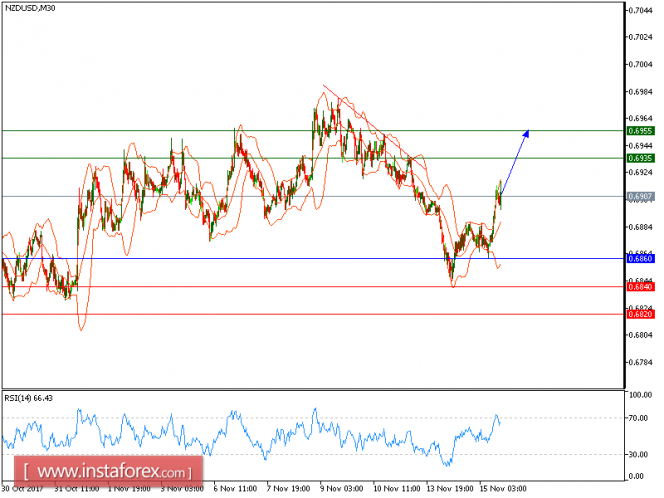
|
|
#76
16-11-2017, 20:03
|
||||
|
||||
|
NZD/USD is under pressure. The pair posted some consolidations but is still under pressure below its nearest resistance at 0.6890. The 20-period moving average is turning down and has just crossed below the 50-period one. The relative strength index has broken below its neutrality area at 50.
To conclude, as long as 0.6890 is not surpassed, likely decline to 0.6820 and 0.6795 in extension. The black line shows the pivot point. Currently, the price is above the pivot point, which indicates long positions. If it remains below the pivot point, it will indicate short positions. The red lines are showing the support levels and the green line is indicating the resistance levels. These levels can be used to enter and exit trades. Resistance levels: 0.6915, 0.6935, and 0.6975 Support levels: 0.6820, 0.6795, and 0.6745 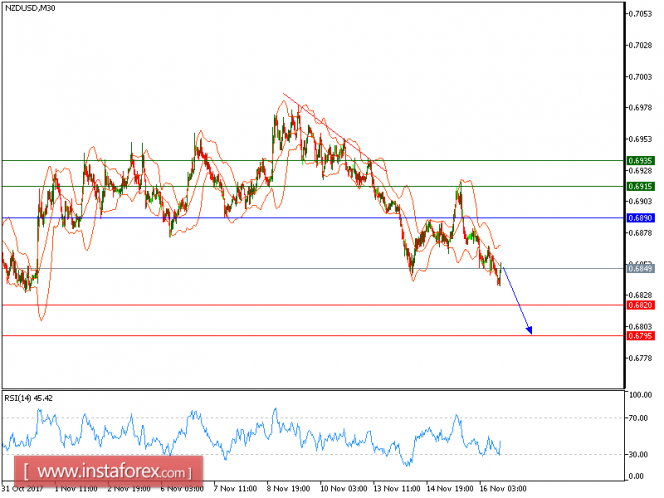
|
|
#77
17-11-2017, 18:39
|
||||
|
||||
|
Overview:
As expected the NZD/USD pair continues to move downwards from the level of 0.6800. Yesterday, the pair dropped from the level of 0.6800 to the bottom around 0.6779. Today, the first resistance level is seen at 0.6800 followed by 0.6943, while daily support 1 is seen at 0.6779. According to the previous events, the NZD/USD pair is still moving between the levels of 0.6800 and 0.6703; for that we expect a range of 97 pips (0.6800 - 0.6703). If the NZD/USD pair fails to break through the resistance level of 0.6800, the market will decline further to 0.6779 again. This would suggest a bearish market because the RSI indicator is still in a positive area and does not show any trend-reversal signs. The pair is expected to drop lower towards at least 0.6703 with a view to test the daily pivot point. On the contrary, if a breakout takes place at the resistance level of 0.6943 (the double top), then this scenario may become invalidated. 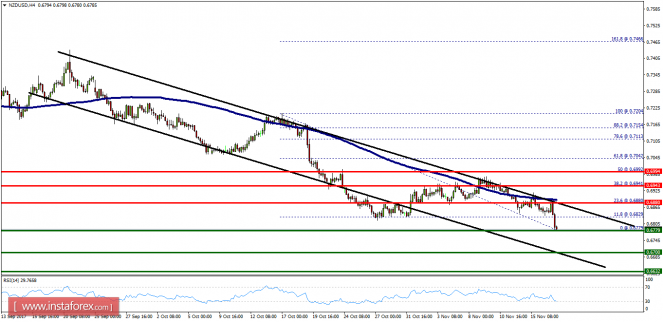
|
|
#78
24-11-2017, 00:40
|
||||
|
||||
|
Overview:
The NZD/USD pair is going to continue to rise from the level of 0.6779 in the long term. It should be noted that the support is established at the level of 0.6779 which represents thedoule bottom on the H4 chart. The price is likely to form a double bottom in the same time frame. Accordingly, the NZD/USD pair is showing signs of strength following a breakout of the highest level of 0.6880. So, buy above the level of 0.6880 with the first target at 0.6943 in order to test the daily resistance 1 and further to 0.6940. Also, it might be noted that the level of 0.6940 is a good place to take profit because it will form a double top. On the other hand, in case a reversal takes place and the NZD/USD pair breaks through the support level of 0.6779, a further decline to 0.6632 can occur which would indicate a bearish market. 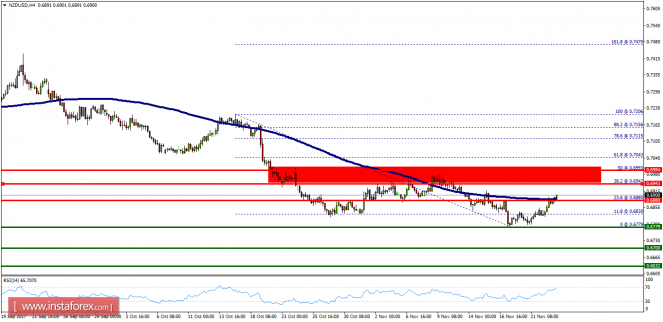
|
|
#79
24-11-2017, 13:05
|
||||
|
||||
|
NZD/USD is expected to trade with a bullish bias above 0.6850. The pair remains bullish above its key support at 0.6850, which should limit any downside room. The relative strength index is mixed, but lacks downward momentum. Therefore, even though a consolidation cannot be ruled out at the current stage, its extent should be limited.
As long as 0.6850 is not broken, look for a new rebound to 0.6895 and 0.6915 in extension. The black line shows the pivot point. Currently, the price is above the pivot point, which indicates long positions. If it remains below the pivot point, it will indicate short positions. The red lines are showing the support levels and the green line is indicating the resistance levels. These levels can be used to enter and exit trades. Resistance levels: 0.6895, 0.6915, and 0.6950 Support levels: 0.6830, 0.6815, and 0.6790 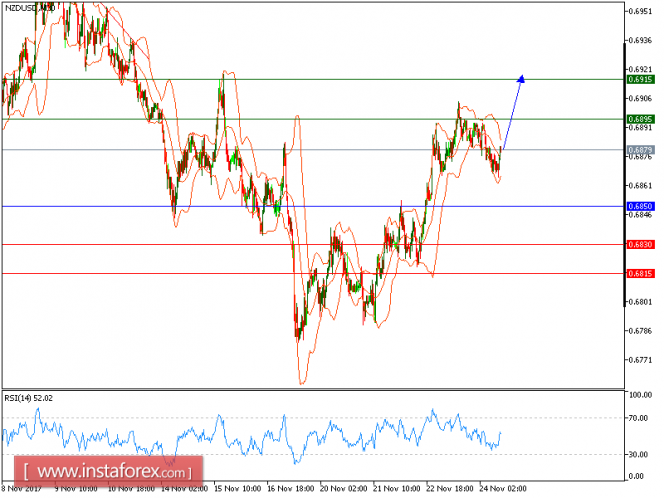
|
|
#80
30-11-2017, 19:29
|
||||
|
||||
|
Overview:
The NZD/USD pair continues to move downwards from the level of 0.6881. Yesterday, the pair dropped from the level of 0.6881 (this level of 0.6881 coincides with the double top) to the bottom around 0.6830. Today, the first resistance level is seen at 0.6881 followed by 0.6909, while daily support 1 is found at 0.6819. Also, the level of 0.6843 represents a daily pivot point for that it is acting as major resistance/support this week. the previous events, the pair is still in a downtrend, because the NZD/USD pair is trading in a bearish trend from the new resistance line of 0.6862 towards the first support level at 0.6819 in order to test it. If the pair succeeds to pass through the level of 0.6819, the market will indicate a bearish opportunity below the level of 0.6819 towards the next targets of 0.6799 and 0.6780. However, if a breakout happens at the resistance level of 0.6909, then this scenario may be invalidated. 
|
|
|
|
 Similar Threads
|
||||
| Thread | Thread Starter | Forum | Replies | Last Post |
| Daily technical analysis of GBP/JPY By INSTAFOREX | InstaForex | Forex Analysis | 79 | 23-01-2018 14:17 |
| Daily technical analysis of EUR/NZD By INSTAFOREX | InstaForex | Forex Analysis | 319 | 19-01-2018 10:37 |
| Daily technical analysis of EUR/JPY By INSTAFOREX | InstaForex | Forex Analysis | 358 | 19-01-2018 10:34 |
| Daily technical analysis of USD/CAD By INSTAFOREX | InstaForex | Forex Analysis | 236 | 09-11-2017 22:58 |
| Daily technical analysis of USD/JPY By INSTAFOREX | InstaForex | Forex Analysis | 0 | 08-10-2015 22:08 |


