Overview:
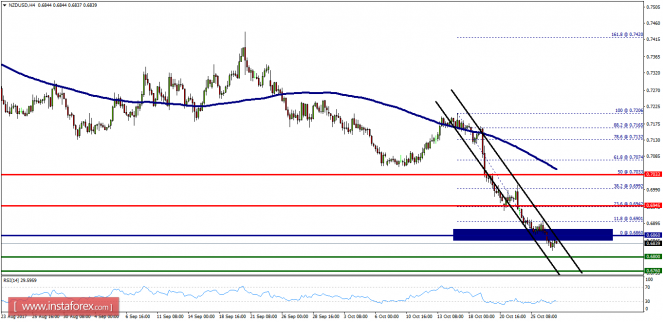
Pivot: 0.6860.
The NZD/USD pair didn't make any significant moves yesterday. There are no changes in my technical outlook. The bias remains bearish in nearest term testing 0.6760 or lower. The NZD/USD pair continues to move downwards from the zone of 0.6942 and 0.7880. Yesterday, the pair dropped from the level of 0.6942 to 0.6942 which coincides with a ratio of 23.6% Fibonacci on the H4 chart. Today, the resistance is seen at the levels of 0.6945 and 0.7033. So, we expect the price to set below the strong resistance at the levels of 0.6945 and 0.7033 because the price is in a bearish channel now. The RSI starts signaling a downward trend.
Consequently, the market is likely to show signs of a bearish trend. So, it will be good to sell below the level of 0.6942/0.6900 with the first target at 0.6800. If the NZD/USD pair is able to break out the daily support at 0.6800, the market will decline further to 0.6760 in order to test the daily support two. However, the price spot of 0.6942 remains a significant resistance zone. Thus, the trend is still bearish as long as the level of 0.6940 is not breached.