Forex Forums | ForexLasers.com |
|
|||||||
 |
|
|
LinkBack | Thread Tools | Search this Thread |
|
#441
 30-07-2025, 02:11
|
||||
|
||||
|
EURUSD H4 Technical and Fundamental Analysis for 07.30.2025
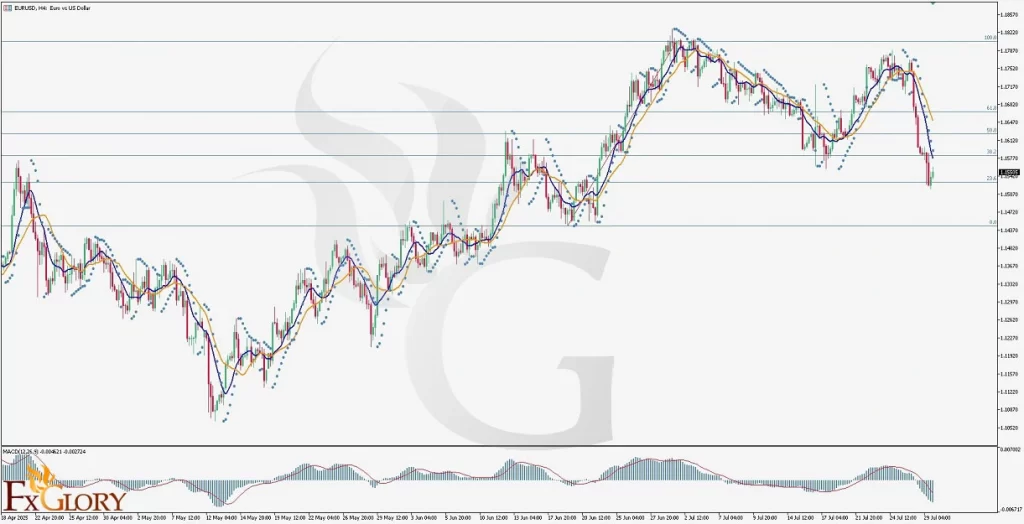 Time Zone: GMT +3 Time Frame: 4 Hours (H4) Fundamental Analysis: Todays EUR/USD analysis is framed by multiple Eurozone macroeconomic indicators due for release. With data on consumer spending, GDP, and retail sales scheduled, traders are closely watching for signs of economic resilience. A stronger-than-forecast reading would typically be bullish for the euro, especially from the INSEE and Destatis GDP reports. Meanwhile, the USD awaits impactful data later in the week, including ADP employment data and crude oil inventories, which may shift the Feds interest rate expectations. For now, mixed macro signals leave EUR/USD highly sensitive to incoming figures and central bank sentiment, particularly in light of persistent inflationary concerns across the Eurozone and potential Fed policy adjustments. Price Action: The EUR/USD pair on the H4 timeframe has initiated a sharp bearish correction from the 1.17300 peak, losing approximately -2.14% since the start of the week. After a strong downward move, price action found temporary support near the 23.6% Fibonacci retracement level at 1.15300. This has led to two green candles forming, suggesting a short-term rebound. However, the current downtrend structure remains dominant, with lower highs and lower lows evident. If the price fails to break through the resistance at the 38.2% (1.15820) or 50.0% (1.16250) retracement levels, a renewed decline could target the 0.0% Fibonacci level around 1.14500. Key Technical Indicators: Moving Averages: The 9-period EMA (blue) has decisively crossed below the 17-period EMA (orange), confirming the bearish shift in momentum on the EUR-USD H4 chart. This crossover early in the week has continued to guide price lower, acting as dynamic resistance during minor pullbacks. Parabolic SAR: The Parabolic SAR dots are firmly positioned above the recent H4 candles, affirming bearish momentum. The indicator has been consistent in signaling downward price action and will remain a key reference point until a reversal signal forms below price. MACD (Moving Average Convergence Divergence): The MACD histogram is strongly negative, with the MACD line at -0.004621 and the signal line at -0.002724. This widening gap suggests persistent downside pressure. However, traders should monitor for potential MACD convergence if upward corrective movement continues in the next few candles. Support and Resistance: Support: The key short-term support lies around the 1.15300 zone, coinciding with the 23.6% Fibonacci level. A break below this level could accelerate the move toward the 0.0% retracement near 1.14500. Resistance: Immediate resistance stands at 1.15820 (38.2% Fib level). A further upside correction could face resistance at 1.16250 (50.0% Fib), with the stronger bearish barrier remaining around the 1.16700 region. Conclusion and Consideration: The EUR/USD H4 chart technical analysis signals a prevailing bearish bias, reinforced by the moving averages crossover, downward MACD momentum, and Parabolic SAR positioning. Although the pair shows a temporary bounce from 1.15300 support, any upward retracement toward the 38.2% or 50.0% Fibonacci levels may encounter renewed selling pressure. From a fundamental standpoint, key EUR economic data today may introduce volatility, but until significant bullish catalysts emerge, bears remain in control. Caution is advised for long positions unless confirmed by reversal signals. Disclaimer: The analysis provided for EUR/USD is for informational purposes only and does not constitute investment advice. Traders are encouraged to perform their own analysis and research before making any trading decisions on EURUSD. Market conditions can change quickly, so staying informed with the latest data is essential. FXGlory 07.30.2025 
|
|
#442
31-07-2025, 08:18
|
||||
|
||||
|
USDJPY Daily Technical and Fundamental Analysis for 07.31.2025
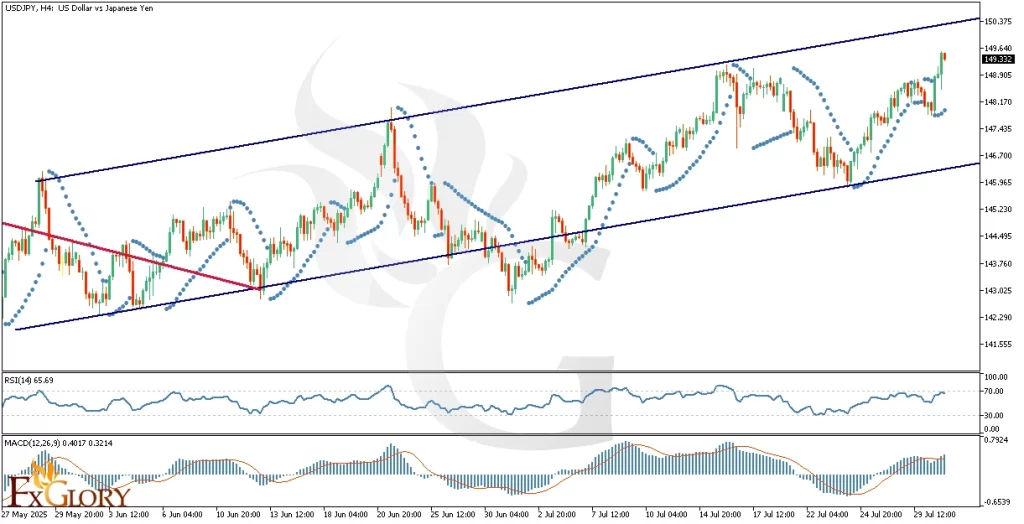 Time Zone: GMT +3 Time Frame: 4 Hours (H4) Fundamental Analysis: The USD-JPY currency pair is likely to experience increased volatility today due to significant economic releases from both Japan and the United States. Japanese Industrial Production, Retail Sales, and Consumer Confidence data are scheduled, which will provide crucial insights into the economic health of Japan. Additionally, market participants will closely monitor the outcomes of the Bank of Japan's monetary policy statements and comments by the BOJ Governor for indications of future policy shifts. From the U.S. side, traders will pay close attention to the Core PCE Price Index and Unemployment Claims, which can significantly influence the USD valuation, as these metrics directly affect the Federal Reserve's monetary policy outlook. Price Action: The USD/JPY pair has transitioned into a bullish phase on the H4 chart, clearly evident after breaking the resistance line of its previous downtrend. Currently, the pair is trading within an ascending channel, consistently respecting its boundaries. After recently bouncing off the channels lower trendline, the price appears headed toward the upper boundary, setting a potential bullish target. The recent bullish candles reinforce the upward momentum, suggesting continued bullish sentiment in the short term. Key Technical Indicators: Parabolic SAR: The Parabolic SAR indicators have consistently formed below the last four candles, indicating a clear bullish momentum in the short-term price action of the USD JPY pair. Traders can interpret this as a potential continuation signal toward the upper channel boundary. RSI (Relative Strength Index): Currently, the RSI stands at 65.69, signaling robust bullish strength but still beneath the overbought threshold of 70. This indicates that while bullish momentum is strong, there is still room for further upside before becoming overextended. MACD (Moving Average Convergence Divergence): The MACD indicator presents values of 0.4017 and 0.3214, with the MACD line positioned above the signal line, supporting the bullish scenario. This positioning suggests continued buying momentum, albeit with caution for potential weakening if the MACD line converges toward the signal line in upcoming sessions. Support and Resistance: Support: Immediate support for the USD-JPY pair is found at approximately 147.435, aligning with the lower boundary of the ascending channel and recent swing lows. Resistance: Key resistance is expected near the upper boundary of the ascending channel around 149.640, coinciding with recent peaks that could challenge bullish momentum. Conclusion and Consideration: The USD-JPY H4 chart currently favors bullish continuation, supported by key technical indicators such as Parabolic SAR, RSI, and MACD, along with constructive price action within the ascending channel. However, market participants should remain cautious given todays significant economic data and monetary policy announcements from both Japan and the United States, potentially increasing volatility. Monitoring key resistance and support levels will be essential to effectively manage trading positions. Disclaimer: The analysis provided for USD/JPY is for informational purposes only and does not constitute investment advice. Traders are encouraged to perform their own analysis and research before making any trading decisions on USDJPY. Market conditions can change quickly, so staying informed with the latest data is essential. FXGlory 07.31.2025
|
|
#443
01-08-2025, 01:24
|
||||
|
||||
|
EURGBP H4 Technical and Fundamental Analysis for 08.01.2025
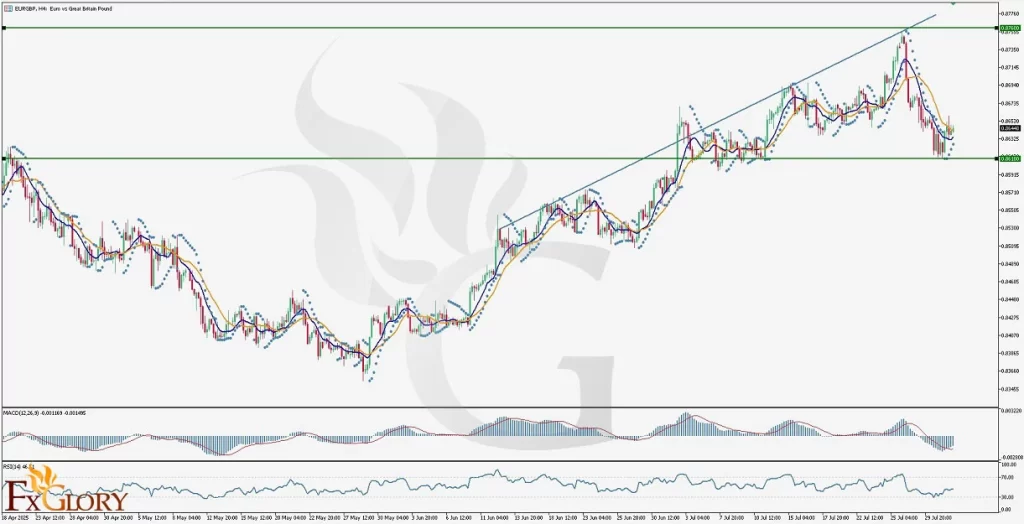 Time Zone: GMT +3 Time Frame: 4 Hours (H4) Fundamental Analysis: Today, the EURGBP pair is likely to see moderate volatility as both the Euro (EUR) and British Pound (GBP) are influenced by several macroeconomic indicators. For the EUR, a flurry of economic releases including the Final and Flash PMIs, CPI (Consumer Price Index), and retail sales are scheduled. These are critical metrics for assessing economic health, particularly inflation and business activity across the Eurozone. Strong PMI or CPI figures could support a bullish case for the Euro if they exceed forecasts. On the GBP side, the focus is on the House Price Index and the S&P Global Manufacturing PMI. Any positive surprise from the UK housing or manufacturing data could boost the Pound, potentially applying downward pressure on EUR/GBP. Overall, the market could be reactive today, with traders adjusting their positions based on real-time data surprises from either side. Price Action: The EURGBP pair on the H4 chart has been moving in a clear bullish trend since early June, following a long-term ascending trendline. Recently, the price entered a short-term corrective phase, pulling back from the resistance area around 0.87600. However, after testing the strong support zone near 0.86100, the price action shows bullish rejection with consecutive green candles forming. Parabolic SAR dots have shifted below the candles, indicating a potential resumption of upward momentum. The EUR GBP price is currently attempting to retake lost ground and approach the resistance at 0.86800, a key barrier to further upside. Key Technical Indicators: Parabolic SAR: The Parabolic SAR has shifted from above to below the price for the past 5 spots, signaling a reversal of momentum back to the bullish side. This is often considered an early signal for a trend continuation, especially when paired with bullish candlestick patterns forming at major support levels. Moving Averages (MA9 Blue / MA17 Orange): Currently, the fast MA (9) is still below the slow MA (17), with both moving slightly downward. However, price action has pierced through the MA9, which is now starting to slope upward. If this short MA crosses above the long MA, it could trigger a bullish crossover, confirming further upside potential toward the 0.87600 resistance. MACD (12,26,9): The MACD histogram shows a bearish trend softening as it begins to rise back toward the zero line. The MACD line is at -0.001169 and the signal line at -0.001495, suggesting decreasing selling pressure. If momentum continues, a bullish crossover could occur in the next few sessions. RSI (14): The Relative Strength Index is at 46.51, recovering from near-oversold levels. This neutral-to-bullish positioning indicates the market has room to rise without being overbought, especially if supported by positive news or a breakout above key resistance. Support and Resistance: Support: The nearest key support level is seen around 0.86100, where the price recently bounced, aligning with historical price rejection zones and the lower bound of the bullish trend. Resistance: The next major resistance lies at 0.86800, a zone that may cap upward movement in the short term. A confirmed breakout above this level could open the path to 0.87600, the previous high. Conclusion and Consideration: In this EURGBP H4 technical and fundamental chart analysis, the pair remains within a broader upward trend, though it recently experienced a healthy pullback. The combination of technical signalssuch as SAR shift, bullish price action at support, and a possible MACD reversalsuggests a potential continuation to the upside, especially if upcoming Eurozone data beats expectations. Caution remains warranted, however, as mixed fundamental results from either the Eurozone or the UK could shift short-term sentiment. Traders should monitor today's key macroeconomic releases closely to confirm price direction. Disclaimer: The analysis provided for EUR/GBP is for informational purposes only and does not constitute investment advice. Traders are encouraged to perform their own analysis and research before making any trading decisions on EURGBP. Market conditions can change quickly, so staying informed with the latest data is essential. FXGlory 08.01.2025
|
|
#444
04-08-2025, 02:00
|
||||
|
||||
|
GOLDUSD H4 Technical and Fundamental Analysis for 08.04.2025
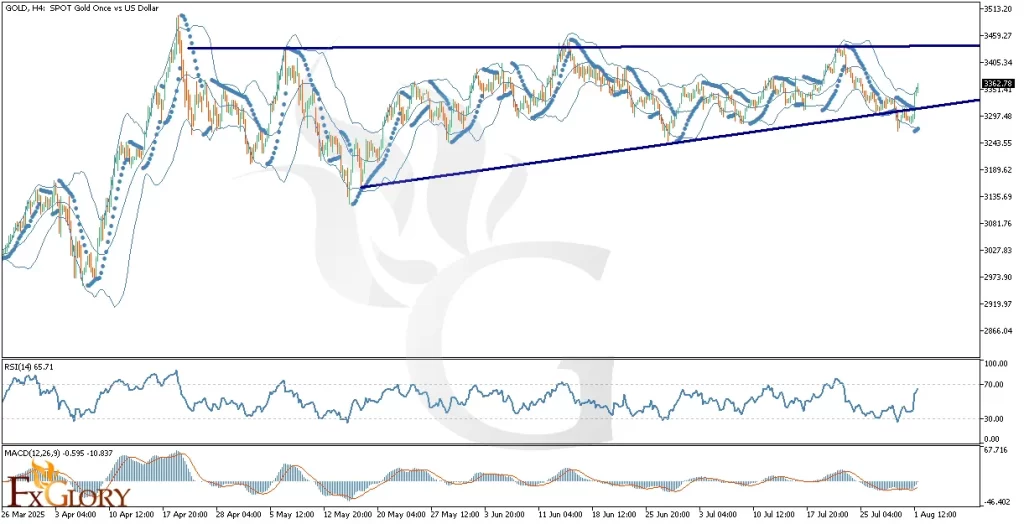 Time Zone: GMT +3 Time Frame: 4 Hours (H4) Fundamental Analysis: Gold prices (XAU/USD) today could experience increased volatility due to important upcoming USD news releases. The Census Bureau will release data on U.S. Factory Orders, a key indicator measuring the total value of new purchase orders placed with manufacturers. An actual value greater than forecasted typically strengthens the USD, putting downward pressure on gold prices. Additionally, insights from the Federal Reserve's quarterly lending report, indicating confidence in lending and spending, could impact USD strength. Traders should closely monitor these releases, as stronger-than-expected data may weigh on gold prices, while weaker data could provide support. Price Action: The GOLDUSD H4 chart indicates a clear ascending triangle pattern, following a strong bullish uptrend. Recently, price action has respected the triangles bottom trendline and is currently moving toward the upper boundary. The presence of strong bullish engulfing candles and positive market momentum suggests a greater probability of an upward breakout, potentially extending the bullish trend. Key Technical Indicators: Parabolic SAR: On the H4 timeframe, Parabolic SAR dots are situated below the price, indicating a bullish momentum and supporting the likelihood of upward movement. Bollinger Bands: Bollinger Bands are widening, indicating increased volatility. The current price has surpassed the upper band, signaling strong bullish momentum. Traders should be cautious of short-term pullbacks, but overall conditions favor continued bullish action. RSI (Relative Strength Index): The RSI stands at 65.71, suggesting bullish strength but still below the overbought threshold of 70. This indicates that gold prices (XAU/USD) have room to continue rising before becoming overextended. MACD (Moving Average Convergence Divergence): The MACD line currently reads -0.595, with the signal line at -10.837, indicating an emerging bullish crossover. Although still negative, upward momentum is strengthening, suggesting a continuation of bullish pressure. Support and Resistance: Support: Immediate support is identified at approximately 3297.50, aligning with the ascending triangles bottom line and recent price consolidation. Resistance: Immediate resistance is located near the upper boundary of the ascending triangle, around 3459.00, representing recent highs and a significant psychological level. Conclusion and Consideration: The XAU/USD H4 technical analysis reveals a predominantly bullish outlook, supported by strong price action, bullish indicators such as the Parabolic SAR and Bollinger Bands, and increasing bullish momentum reflected by MACD and RSI. The ascending triangle pattern suggests a high probability of upward breakout. Traders should closely monitor todays USD economic news, as data strength will significantly influence price volatility and momentum direction. Disclaimer: The analysis provided for XAU/USD is for informational purposes only and does not constitute investment advice. Traders are encouraged to perform their own analysis and research before making any trading decisions on XAUUSD. Market conditions can change quickly, so staying informed with the latest data is essential. FXGlory 08.04.2025
|
|
#445
05-08-2025, 05:22
|
||||
|
||||
|
GBPUSD H4 Technical and Fundamental Analysis for 08.05.2025
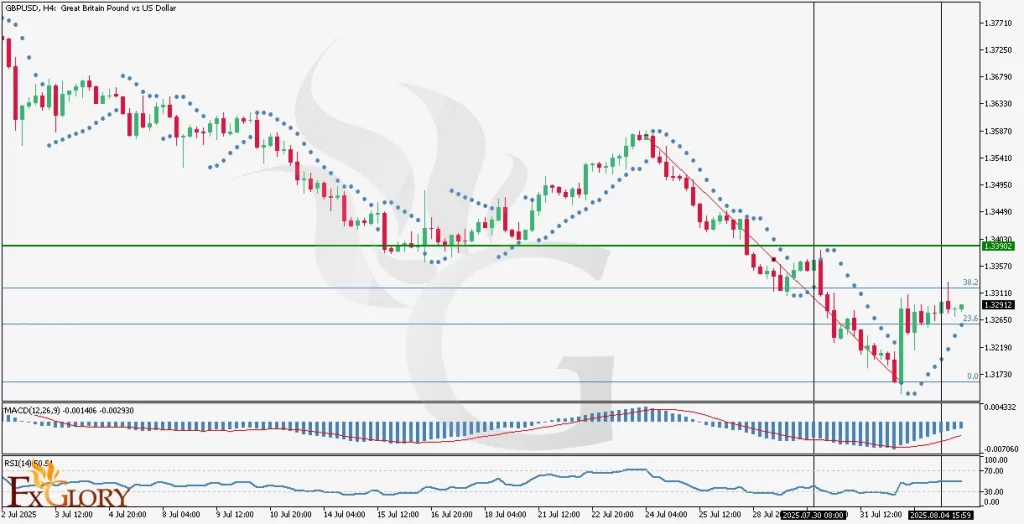 Time Zone: GMT +3 Time Frame: 4 Hours (H4) Fundamental Analysis: The GBPUSD pair is subject to notable volatility today, given the release of key economic indicators for both currencies. For the British Pound (GBP), traders are closely watching the UK's Services PMI from S&P Global and results from the Debt Management Office's 10-year bond auctions. These indicators could heavily influence the GBPs strength, reflecting current market conditions and investors' outlook on UK economic health. For the US Dollar (USD), attention will be drawn towards the trade balance report from the Bureau of Economic Analysis, as well as the Services PMI from both S&P Global and the Institute for Supply Management (ISM). These indicators could lead to volatility in the USD, impacting GBPUSD trading conditions significantly. Price Action: GBPUSD price action on the H4 chart indicates a predominant bearish trend. After a short reversal, bearish momentum resumed with notable strength. Each drop in price has been accompanied by minor and flat corrective phases. The most recent correction is sharper, currently hovering between Fibonacci retracement levels of 23.6% and 38.2%. Should these levels fail to contain the correction, the next critical resistance area lies at 1.33902, historically a zone with significant price reactions. The RSI divergence pattern suggests a likely continuation of the bearish trend. Key Technical Indicators: MACD (Moving Average Convergence Divergence): The MACD line stands at -0.002930, with the histogram level at -0.001413, indicating that bearish momentum persists but is currently weaker. Traders should monitor for potential crossovers signaling either continued bearish momentum or a reversal. RSI (Relative Strength Index): The RSI indicator currently hovers around the 50.36 level, signifying a neutral market sentiment. Given the RSI divergence with higher highs compared to the lower highs in price, traders should anticipate potential bearish continuation. Parabolic SAR: The Parabolic SAR dots are placed below the current candles, signaling the potential continuation of the correction phase. This indicator reinforces the likelihood of upward continuation unless reversed by a clear downward move. Support and Resistance: Support: Immediate support lies at the recent low around the 1.31730 level, serving as a crucial psychological and technical floor. Resistance: Immediate resistance is marked at 1.33902, aligning with significant historical price reactions and the Fibonacci retracement levels. Conclusion and Consideration: The GBPUSD technical and fundamental analysis for the H4 timeframe underscores ongoing bearish sentiment, supported by RSI divergence, MACD weakening bearish momentum, and Parabolic SAR alignment. The upcoming economic news from the UK and the US could significantly affect volatility and market direction. Traders should remain cautious, factoring in these fundamental releases to refine their strategies. Disclaimer: The analysis provided for GBP/USD is for informational purposes only and does not constitute investment advice. Traders are encouraged to perform their own analysis and research before making any trading decisions on GBPUSD. Market conditions can change quickly, so staying informed with the latest data is essential. FXGlory 08.05.2025
|
|
#446
05-08-2025, 23:47
|
||||
|
||||
|
NZDUSD H4 Technical and Fundamental Analysis for 08.06.2025
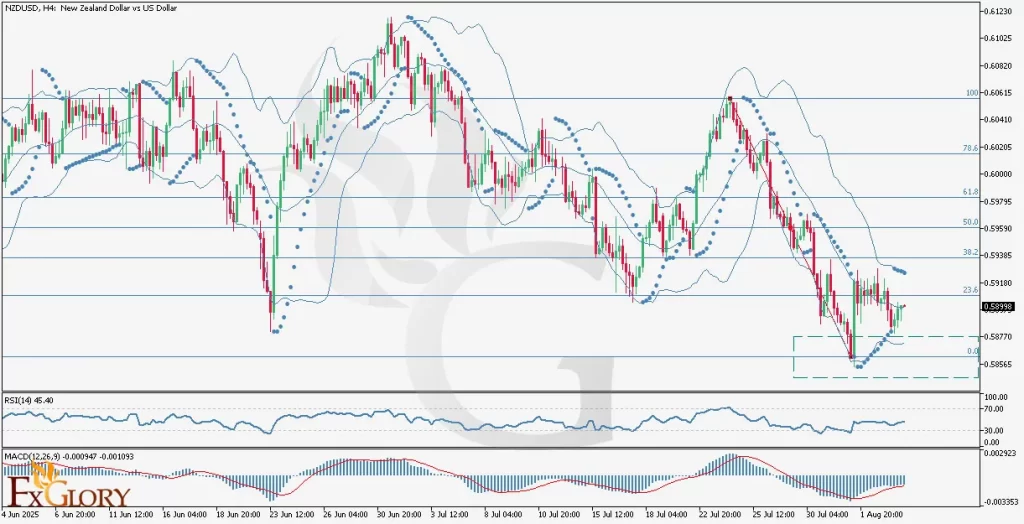 Time Zone: GMT +3 Time Frame: 4 Hours (H4) Fundamental Analysis: Today's NZD/USD H4 technical and fundamental analysis is influenced by a significant wave of economic data from New Zealand and the United States. From the NZD side, market participants are closely watching employment figures, unemployment rates, and labor cost changes. These indicators are essential for understanding the health of New Zealands labor market, a crucial driver of consumer spending and inflation. While no releases are scheduled for today, anticipation builds for the next quarterly labor data in early November, potentially setting the tone for the NZD in the coming weeks. On the USD side, attention shifts to energy-related reports and monetary policy commentary. Crude Oil Inventory levels from the EIA, expected later this week, may impact overall risk sentiment and indirectly influence USD valuation. Moreover, FOMC members Lisa Cook and Susan Collins are scheduled to speak today. Their commentary could offer crucial insights into the Fed's monetary policy direction, influencing USD demand and NZD-USD exchange rates. Price Action: The NZD/USD price action on the H4 chart has shown a predominantly bearish trend. After a significant downward movement, the pair touched the 0.58565 support area, which coincides with the 0.0 Fibonacci retracement level. Following that, the price rebounded toward the 23.6% Fib level, struggling to establish a clear breakout. Despite forming three consecutive bullish (green) candles, the most recent candle has turned red, suggesting hesitation from the bulls at this critical resistance zone. The pair remains range-bound between the 0.58565 support and 0.58990 resistance, consolidating below the 38.2% Fibonacci retracement. Key Technical Indicators: Bollinger Bands: The NZD/USD price has been fluctuating between the lower and middle Bollinger Bands, indicating low volatility and range-bound behavior. After briefly touching the lower band, the price is attempting to break through the middle band, aligning with the 23.6% Fib level. However, the rejection shown by the red candle suggests resistance and potential consolidation unless a clear bullish breakout occurs. Parabolic SAR: The last four Parabolic SAR dots are aligned above the price candles, signaling a continuation of the bearish trend. Until the dots flip below the candles, momentum remains in favor of the bears, and traders may look for selling opportunities near resistance. RSI (Relative Strength Index): The RSI stands at 45.40, which is below the neutral 50 level, indicating slight bearish momentum. It is not in oversold territory, so there is still room for further downside before the market becomes technically oversold. MACD (Moving Average Convergence Divergence): The MACD line is at -0.000947, with the signal line at -0.001093, and the histogram is gradually turning positive. This could suggest that bearish momentum is weakening, and a potential crossover could occur soon. However, confirmation is required for a trend reversal signal. Support and Resistance: Support: Key support lies around 0.58565, which is aligned with the recent low and the 0.0 Fibonacci level, acting as a psychological and technical floor. Resistance: Immediate resistance is found at 0.59000, near the 23.6% Fibonacci retracement level and the middle Bollinger Band, forming a strong confluence area. Conclusion and Consideration: In todays NZD/USD H4 chart forecast, the pair is attempting to recover from its recent lows but faces stiff resistance at the 23.6% Fibonacci retracement level. Technical indicators such as Bollinger Bands and Parabolic SAR suggest consolidation or potential downside continuation, while the RSI and MACD hint at possible bullish momentum buildup. Fundamental factors remain balanced, with upcoming U.S. central bank commentary and crude oil inventory data possibly tilting sentiment in favor of the USD. Traders should remain cautious and watch for a breakout from the current range to determine the next directional bias. Disclaimer: The analysis provided for NZD/USD is for informational purposes only and does not constitute investment advice. Traders are encouraged to perform their own analysis and research before making any trading decisions on NZDUSD. Market conditions can change quickly, so staying informed with the latest data is essential. FXGlory 08.06.2025
|
|
#447
07-08-2025, 06:48
|
||||
|
||||
|
EURUSD H4 Technical and Fundamental Analysis for 08.07.2025
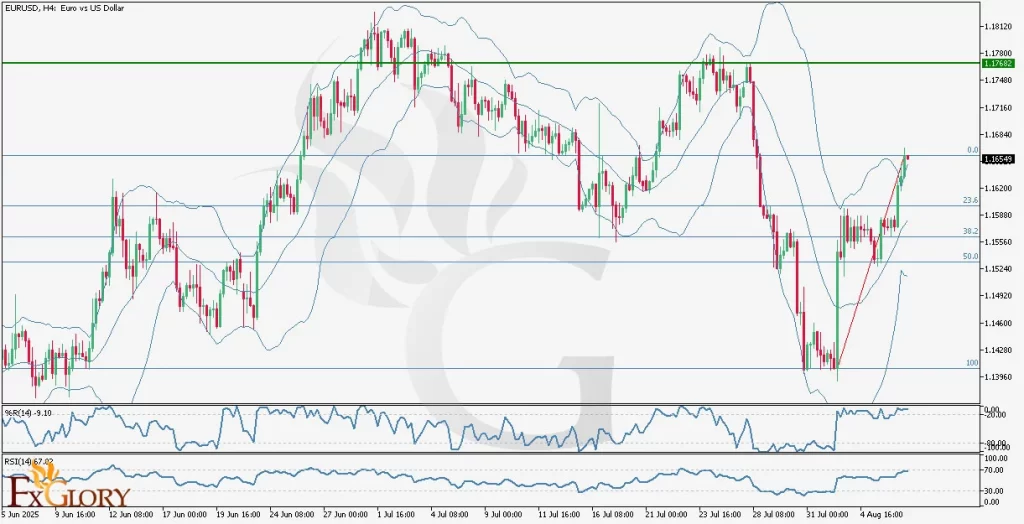 Time Zone: GMT +3 Time Frame: 4 Hours (H4) Fundamental Analysis: Today's EURUSD fundamental outlook shows significant market-moving events primarily from the USD side. Key releases include initial jobless claims from the Department of Labor, labor productivity and unit labor costs from the Bureau of Labor Statistics, and wholesale inventories from the Census Bureau. The market typically reacts positively to lower-than-expected initial jobless claims and labor productivity figures, as these signal economic strength. Additionally, Federal Reserve Bank of Atlanta President Raphael Bostic's fireside chat will draw close attention as investors look for insights into future monetary policy directions. For EUR, attention will focus primarily on upcoming trade balance and industrial output data from Destatis and economic bulletins from the ECB. Price Action: The EURUSD H4 price action demonstrates a strong bullish trend following a sharp reversal from previous bearish momentum. After an earlier consolidation phase, the EURUSD began another notable bullish impulse, breaking decisively above previous resistance levels. The latest candles, however, indicate a possible correction as traders secure profits, but based on Fibonacci retracement analysis, prices are likely to remain above the 23.6% retracement level before resuming bullish momentum. The key target for this bullish run is identified at 1.17682, a previously significant reactionary level. Key Technical Indicators: Williams %R: The indicator is hovering around the -9.10 level, suggesting the EURUSD H4 is currently in an overbought territory. Although this signals potential short-term pullbacks, the strong bullish momentum remains evident, and a slight correction is probable before further bullish moves. RSI (Relative Strength Index): The RSI indicator on the EURUSD H4 chart is currently hovering near 67.02, just below the overbought threshold of 70. This indicates that while bullish momentum remains robust, there's potential for minor consolidation or corrective moves to relieve bullish pressure before continuing upwards. Bollinger Bands: Bollinger Bands on EURUSD H4 have recently expanded, illustrating a strong bullish momentum and heightened volatility. Current price candles have reached the upper band, implying potential short-term retracement or sideways movement as the market consolidates gains before advancing further. Support and Resistance: Support: Immediate support aligns at the Fibonacci retracement level of 23.6% at around 1.15992, serving as a robust floor for potential retracement. Resistance: The primary resistance target stands firmly at 1.17682, reflecting historical price reaction significance. Conclusion and Consideration: EURUSD's H4 timeframe analysis indicates bullish dominance, supported by technical indicators like Williams %R, RSI, and Bollinger Bands. Short-term corrections are expected but likely limited above the 23.6% Fibonacci support. Traders should closely monitor today's USD economic releases and speeches from Fed representatives, as these could introduce volatility. EUR-specific data could provide additional directional cues. Disclaimer: The analysis provided for EUR/USD is for informational purposes only and does not constitute investment advice. Traders are encouraged to perform their own analysis and research before making any trading decisions on EURUSD. Market conditions can change quickly, so staying informed with the latest data is essential. FXGlory 08.07.2025
|
|
#448
07-08-2025, 06:55
|
||||
|
||||
|
EURUSD H4 Technical and Fundamental Analysis for 08.07.2025
Time Zone: GMT +3 Time Frame: 4 Hours (H4) Fundamental Analysis: Today's EURUSD fundamental outlook shows significant market-moving events primarily from the USD side. Key releases include initial jobless claims from the Department of Labor, labor productivity and unit labor costs from the Bureau of Labor Statistics, and wholesale inventories from the Census Bureau. The market typically reacts positively to lower-than-expected initial jobless claims and labor productivity figures, as these signal economic strength. Additionally, Federal Reserve Bank of Atlanta President Raphael Bostic's fireside chat will draw close attention as investors look for insights into future monetary policy directions. For EUR, attention will focus primarily on upcoming trade balance and industrial output data from Destatis and economic bulletins from the ECB. Price Action: The EURUSD H4 price action demonstrates a strong bullish trend following a sharp reversal from previous bearish momentum. After an earlier consolidation phase, the EURUSD began another notable bullish impulse, breaking decisively above previous resistance levels. The latest candles, however, indicate a possible correction as traders secure profits, but based on Fibonacci retracement analysis, prices are likely to remain above the 23.6% retracement level before resuming bullish momentum. The key target for this bullish run is identified at 1.17682, a previously significant reactionary level. Key Technical Indicators: Williams %R: The indicator is hovering around the -9.10 level, suggesting the EURUSD H4 is currently in an overbought territory. Although this signals potential short-term pullbacks, the strong bullish momentum remains evident, and a slight correction is probable before further bullish moves. RSI (Relative Strength Index): The RSI indicator on the EURUSD H4 chart is currently hovering near 67.02, just below the overbought threshold of 70. This indicates that while bullish momentum remains robust, there's potential for minor consolidation or corrective moves to relieve bullish pressure before continuing upwards. Bollinger Bands: Bollinger Bands on EURUSD H4 have recently expanded, illustrating a strong bullish momentum and heightened volatility. Current price candles have reached the upper band, implying potential short-term retracement or sideways movement as the market consolidates gains before advancing further. Support and Resistance: Support: Immediate support aligns at the Fibonacci retracement level of 23.6% at around 1.15992, serving as a robust floor for potential retracement. Resistance: The primary resistance target stands firmly at 1.17682, reflecting historical price reaction significance. Conclusion and Consideration: EURUSD's H4 timeframe analysis indicates bullish dominance, supported by technical indicators like Williams %R, RSI, and Bollinger Bands. Short-term corrections are expected but likely limited above the 23.6% Fibonacci support. Traders should closely monitor today's USD economic releases and speeches from Fed representatives, as these could introduce volatility. EUR-specific data could provide additional directional cues. Disclaimer: The analysis provided for EUR/USD is for informational purposes only and does not constitute investment advice. Traders are encouraged to perform their own analysis and research before making any trading decisions on EURUSD. Market conditions can change quickly, so staying informed with the latest data is essential. FXGlory 08.07.2025
|
|
#449
07-08-2025, 22:32
|
||||
|
||||
|
USDCAD H4 Technical and Fundamental Analysis for 08.08.2025
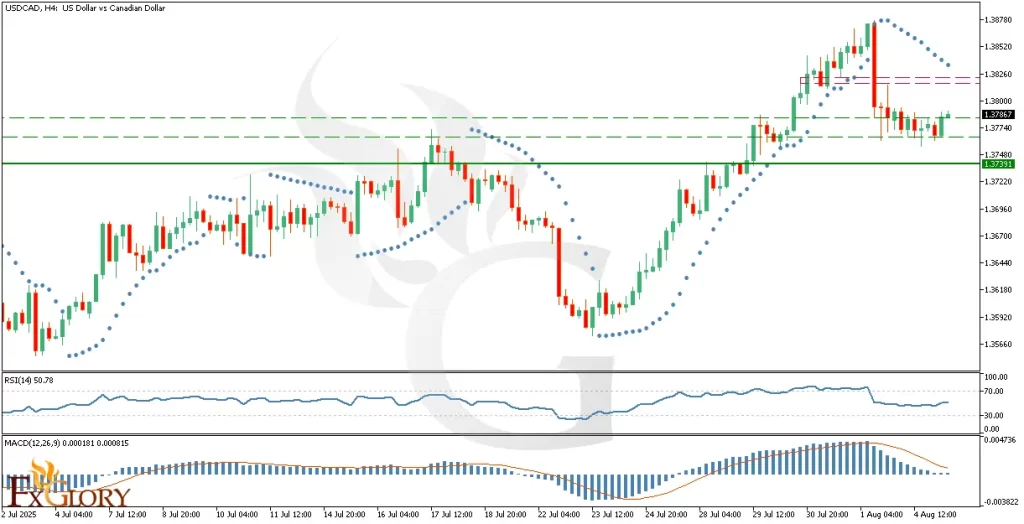 Time Zone: GMT +3 Time Frame: 4 Hours (H4) Fundamental Analysis: The USD/CAD currency pair could see increased volatility today as markets prepare for high-impact USD and CAD news releases. On the USD side, remarks from US President Donald Trump and Federal Reserve Bank of St. Louis President Alberto Musalem may influence expectations for fiscal policy and interest rate direction. Any hawkish language from the Fed could strengthen the USD. From the CAD side, key employment change and unemployment rate data will be released by Statistics Canada. Strong labor market results would likely boost the Canadian Dollar, putting downward pressure on USDCAD. Traders should monitor these events closely, as the combination of US political and monetary commentary with Canadian economic data could spark significant intraday moves. Price Action: After a sharp bullish rally, USDCAD broke its uptrend line with a strong bearish candle, pulling back into the previously broken zone near 1.37646. Price is currently consolidating around this level, signaling indecision between buyers and sellers. Given the recent momentum, the correction phase could be near completion. If buying pressure returns, the next upside target could be 1.38201, while further selling momentum could push the price toward 1.37391 as the next potential reversal point. Key Technical Indicators: Parabolic SAR: Last few dots are above the price, confirming the current bearish bias. However, the flatter alignment of recent dots suggests a slowdown in bearish momentum, which could pave the way for a bullish reversal if supported by fundamentals. RSI (14): The RSI is at 50.78, reflecting neutral conditions. The market is neither overbought nor oversold, leaving room for movement in either direction. MACD (12,26,9): With the MACD line at 0.000181 and the signal line at 0.000815, momentum appears to be weakening. The histogram is edging toward negative territory, aligning with the consolidation phase and hinting at potential bearish continuation unless buying volume increases. Support and Resistance: Support: Immediate support is located at 1.37646, which represents the current consolidation area and a previously broken level now acting as a test zone. Resistance: The nearest resistance level is at 1.38201, which aligns with recent highs and serves as the next upside target if bullish momentum resumes. Conclusion and Consideration: The USD-CAD H4 chart is showing a consolidation phase after breaking its bullish structure. Parabolic SAR remains bearish, RSI is neutral, and MACD indicates fading bullish momentum. With todays US speeches and Canadian employment data ahead, traders should expect volatility spikes. A confirmed break above 1.38201 could signal a bullish continuation, while a drop below 1.37646 might open the way to 1.37391. Caution is advised, and confirmation from both technical and fundamental cues should guide trading decisions. Disclaimer: The analysis provided for USD/CAD is for informational purposes only and does not constitute investment advice. Traders are encouraged to perform their own analysis and research before making any trading decisions on USDCAD. Market conditions can change quickly, so staying informed with the latest data is essential. FXGlory 08.08.2025
|
|
#450
11-08-2025, 02:51
|
||||
|
||||
|
ETH/USD H4 Technical and Fundamental Analysis for 08.11.2025
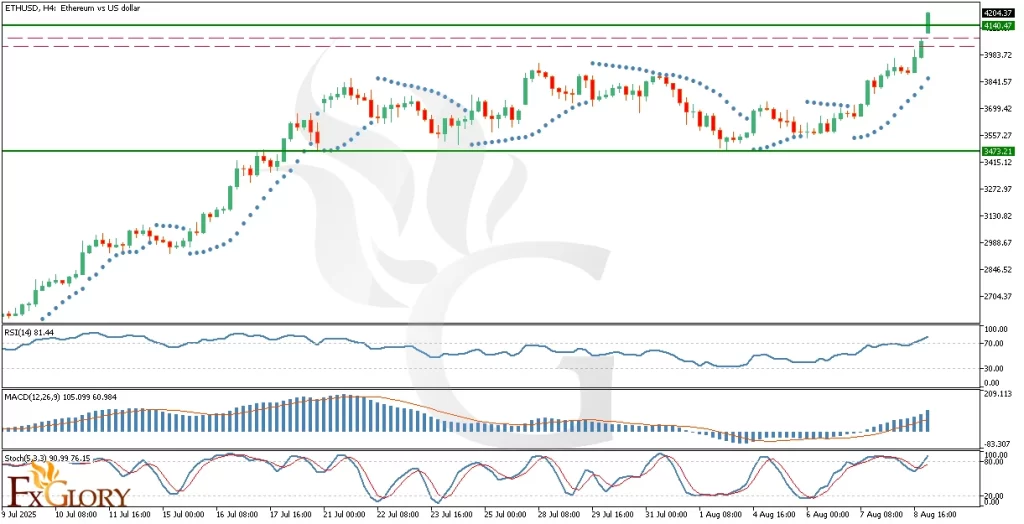 Time Zone: GMT +3 Time Frame: 4 Hours (H4) Fundamental Analysis Ethereum (ETHUSD) continues to show strong bullish sentiment, supported by the broader crypto market recovery and favorable macroeconomic conditions. Today, traders will closely watch the USD inflation expectations release from the Federal Reserve Bank of Cleveland. This quarterly survey gauges business managers' views on price changes over the next 12 months. If the actual figure surpasses forecasts, the US Dollar may strengthen, potentially adding short-term selling pressure on ETHUSD. However, Ethereum’s underlying fundamentals remain robust with sustained demand for decentralized applications (dApps) and Layer-2 scaling solutions, suggesting any dips could attract new buyers. Price Action After a prolonged consolidation phase, ETH-USD has surged aggressively, attacking its recent high near $4,140. The strong bullish impulse broke through previous resistance zones, with the price briefly touching $4,204 before pulling back slightly. This resistance level is significant, and although the first breakout attempt might face profit-taking, the momentum suggests that ETHUSD could eventually break above it and head toward its all-time high (ATH). The recent move is characterized by high volume and acceleration, indicating strong market participation from buyers. Key Technical Indicators Parabolic SAR: The last few Parabolic SAR dots are positioned well below the price, with the gap widening. This reflects strong bullish acceleration and sustained momentum, confirming the current uptrend in ETHUSD. RSI (14): Currently at 81.44, well above the overbought threshold of 70. This indicates strong buying pressure but also warns of a potential short-term correction before continuation. MACD (12,26,9): The MACD line at 105.099 is significantly above the signal line at 60.984, with widening histogram bars. This divergence between the two lines shows increasing bullish momentum and confirms the strength of the ongoing uptrend. Stochastic (5,3,3): With readings of 91 and 76, the Stochastic oscillator is in the overbought zone, signaling that while the bullish trend is strong, the market could be due for a short-term consolidation or minor pullback before another upward push. Support and Resistance: Support: Immediate support is located at 3,473.21, which aligns with the lower consolidation boundary and a previous price reaction zone. Resistance: The nearest resistance level is at 4,140.47, which coincides with the recent breakout point, followed by 4,204.37, marking the latest intraday high. Conclusion and Consideration The ETH-USD H4 chart shows a decisive breakout attempt from its recent consolidation, supported by strong bullish momentum across all major technical indicators. While the RSI and Stochastic suggest overbought conditions, the widening Parabolic SAR and bullish MACD divergence confirm the strength of the move. Traders should watch for a possible retest of $4,140 as support before another rally attempt toward $4,300–$4,400 and eventually the ATH. Given the upcoming USD inflation expectations release, short-term volatility is likely. A stronger USD may create temporary selling pressure, but Ethereum’s current trend and market structure remain bullish. Disclaimer: The analysis provided for ETH/USD is for informational purposes only and does not constitute investment advice. Traders are encouraged to perform their own analysis and research before making any trading decisions on ETHUSD. Market conditions can change quickly, so staying informed with the latest data is essential. FXGlory 08.11.2025 Last edited by FXGLORY; 11-08-2025 at 02:54.
|
|
#451
12-08-2025, 06:43
|
||||
|
||||
|
AUDUSD H4 Technical and Fundamental Analysis 08.12.2025
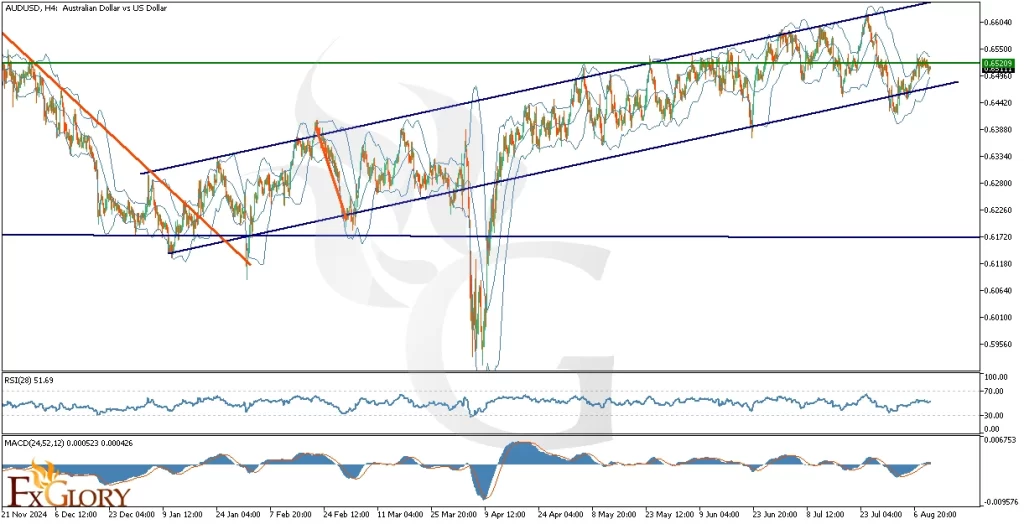 Time Zone: GMT +3 Time Frame: 4 Hours (H4) Fundamental Analysis The AUD-USD currency pair is currently influenced by mixed signals from both the Australian and US economic fronts. Todays key upcoming AUD-related releases include the National Australia Bank (NAB) Business Confidence report, a leading indicator of business sentiment that can foreshadow future economic activity such as hiring and investment. Additionally, traders are awaiting further clarity from the Reserve Bank of Australia (RBA) regarding its interest rate outlook ahead of the September 30 meeting. From the US side, market focus will shift to the NFIB Small Business Index and later this week, the Consumer Price Index (CPI), which remains a major driver for Federal Reserve rate expectations. Speeches from Fed officials Thomas Barkin and Jeffrey Schmid could add volatility to USD pairs as traders seek clues on the next monetary policy steps. Price Action On the H4 chart, AUD USD has been trading within a long-term ascending trend channel following a recovery from its March low. Price is now locked in a sideways daily range within this upward channel, with the current battle occurring around the mid-line of the daily channel. The pair is showing hesitation, with momentum not strong enough to convincingly break above the mid-range resistance. If the bulls fail to secure this breakout, a retracement toward the lower trendline of the channeland potentially the lower boundary of the sideways rangeis likely. Conversely, a successful breakout could open the path toward the upper band of the daily range. Key Technical Indicators Bollinger Bands: The Bollinger Bands are narrowing, signaling a potential volatility squeeze. The price is currently testing the middle line of the Bands, which aligns with the mid-range resistance of the sideways channel. This compression suggests that a breakout moveeither up or downmay occur soon, but given the weaker bullish momentum, the downside risk appears slightly higher. RSI (28): The Relative Strength Index is at 51.69, reflecting a neutral momentum state. This position shows neither overbought nor oversold conditions, which supports the case for potential range-bound trading in the near term. The RSI does not currently show strong bullish divergence, reinforcing the risk of a corrective move. MACD (24,52,12): The MACD main line (0.000523) is marginally above the signal line (0.000426), and the histogram has recently crossed above the zero line. While this suggests a mild bullish bias, the histograms low amplitude indicates that momentum is still weak and susceptible to reversal. A bearish crossover here could accelerate a drop toward support. Support and Resistance: Support: Immediate support is located at 0.6440, which aligns with the lower boundary of the short-term ascending channel and recent price consolidation area. Resistance: The nearest resistance level is at 0.6529, which coincides with the mid-line of the sideways daily channel and recent highs. Conclusion and Consideration The AUD/USD H4 chart shows a market at a critical juncture, trading at the mid-line resistance of a sideways daily channel within an ascending trend structure. While the narrowing Bollinger Bands point toward an upcoming breakout, the combination of a neutral RSI and a weak MACD histogram suggests the upside lacks conviction. This makes a downward correction toward 0.6440 more probable unless strong bullish momentum emerges. Traders should closely monitor todays NAB Business Confidence report and speeches from US Fed officials for potential catalysts. Disclaimer: The analysis provided for AUD/USD is for informational purposes only and does not constitute investment advice. Traders are encouraged to perform their own analysis and research before making any trading decisions on AUDUSD. Market conditions can change quickly, so staying informed with the latest data is essential. FXGlory 08.12.2025
|
|
#452
12-08-2025, 23:08
|
||||
|
||||
|
EURCAD H4 Technical and Fundamental Analysis for 08.13.2025
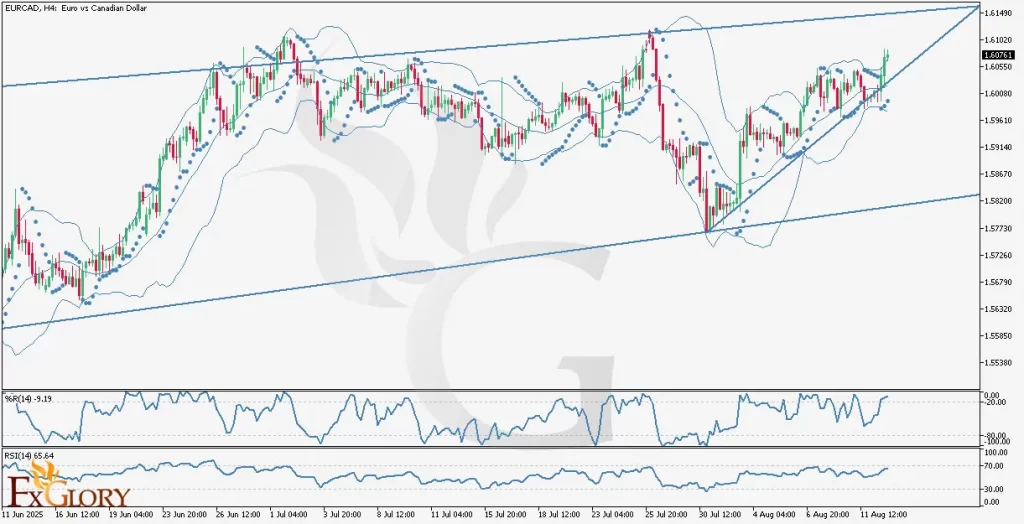 Time Zone: GMT +3 Time Frame: 4 Hours (H4) Fundamental Analysis: The EUR/CAD currency pair reflects the exchange rate between the Euro (EUR) and the Canadian Dollar (CAD). Today, the Euros performance is influenced by key German economic releases, including the Consumer Price Index (CPI) and Wholesale Price Index (WPI), which serve as leading inflation indicators. Higher-than-expected results could strengthen the Euro by reinforcing expectations for tighter European Central Bank policy. Additionally, the Bund Auction provides insight into investor sentiment toward Eurozone bonds. On the Canadian side, the market awaits the Bank of Canada (BOC) Minutes, which could reveal the central banks economic outlook and potential shifts in interest rate policy. Any hawkish tone may boost the CAD, creating increased volatility in EURCAD price action. Price Action: On the H4 chart, EURCAD is in a clear bullish trend, trading within a rising wedge pattern. The pair recently broke above short-term resistance, approaching the upper boundary near 1.61100. Price action shows strong upward momentum with the last three Parabolic SAR dots positioned below the candles, supporting the bullish bias. The short-term ascending trendline is acting as immediate support, while the longer-term trendline remains intact below the candles, confirming a broader bullish structure. Candles are riding along the upper Bollinger Band, which has started to expand, signaling increasing volatility and strong buying pressure. Key Technical Indicators: Bollinger Bands: EUR-CAD price is moving along the upper Bollinger Band, with bands widening, indicating rising volatility and a potential continuation of the bullish move. Sustained trading above the midline suggests ongoing buying interest. Parabolic SAR: The last three Parabolic SAR dots are positioned below the candles, confirming the current bullish trend. As long as price remains above these dots, upward momentum is expected to hold. Williams %R: The Williams %R is at -9.19, placing the market in overbought territory. This reflects strong bullish pressure but also signals that a short-term pullback or consolidation could occur. RSI (Relative Strength Index): The RSI stands at 65.64, below the overbought level of 70, indicating there is still room for further upward movement before market exhaustion. The RSI supports continued bullish price action but warrants caution for potential overextension. Support and Resistance: Support: Immediate support is seen at 1.60000, aligned with the short-term ascending trendline. Resistance: Key resistance is at 1.61100, with long-term resistance projected near 1.61490 at the wedges upper boundary. Conclusion and Consideration: The EUR CAD H4 analysis shows strong bullish momentum supported by technical indicators such as the Bollinger Bands, Parabolic SAR, Williams %R, and RSI. While the overall trend remains upward, overbought conditions suggest the potential for short-term retracement before any continued rally. Traders should closely monitor todays Eurozone CPI, WPI, Bund Auction results, and the Bank of Canada Minutes for possible volatility spikes. Disclaimer: The analysis provided for EUR/CAD is for informational purposes only and does not constitute investment advice. Traders are encouraged to perform their own analysis and research before making any trading decisions on EURCAD. Market conditions can change quickly, so staying informed with the latest data is essential. FXGlory 08.13.2025
|
|
#453
14-08-2025, 06:21
|
||||
|
||||
|
GBPUSD H4 Technical and Fundamental Analysis for 14.08.2025
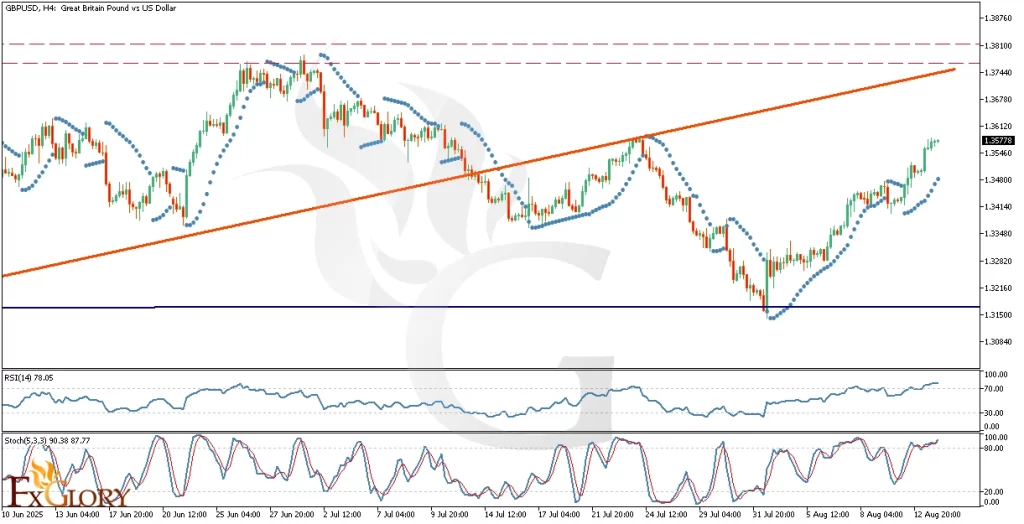 Time Zone: GMT +3 Time Frame: 4 Hours (H4) Fundamental Analysis The GBPUSD currency pair is currently driven by anticipation of key economic data from both the UK and the US. For the Pound, traders are awaiting the RICS Housing Price Balance, a leading indicator of housing market trends, which could influence GBP sentiment if it beats or misses expectations. Later this week, UK GDP, Trade Balance, Industrial Production, and Manufacturing Production will be released, all of which could shape medium-term price direction. On the US side, the focus is on PPI inflation data and weekly jobless claims. Hawkish FOMC commentary could lift the USD, while softer data may encourage further GBP strength. Given the economic calendar, volatility in GBPUSD is expected to rise. Price Action The GBPUSD H4 chart shows a strong rebound from the broken support level at 1.31726, with price action trending higher toward the long-term uptrend line. If buyers succeed in breaking above this trendline, the next target is the 1.37820 resistance level. The Parabolic SAR remains firmly bullish, showing widening gaps below the price, which indicates accelerating buying pressure. However, with momentum oscillators in extreme overbought conditions, there is potential for a short-term pause before the next rally attempt. Key Technical Indicators Parabolic SAR: The dots are positioned below the current price and the gap between the dots and the candles has widened. This indicates that the bullish momentum is strengthening, supporting the possibility of further upside if resistance levels are broken. RSI (Relative Strength Index): The RSI is at 78.05, above the overbought threshold of 70. While this highlights strong bullish momentum, it also signals that the market could be overextended, increasing the likelihood of a pullback or consolidation. Stochastic Oscillator (5,3,3): The %K and %D readings are at 90.38 and 87.77, respectively, confirming extreme overbought conditions. This aligns with RSI warnings and suggests that while buyers are in control, short-term corrective moves cannot be ruled out. Support and Resistance Support: Immediate support is at 1.31726, which was previously a resistance zone and aligns with a recent price breakout area. Resistance: The nearest resistance is at 1.37820, which coincides with a key swing high and projected upside target if the uptrend line breaks. Conclusion and Consideration The GBPUSD H4 analysis suggests sustained bullish momentum, backed by strong price action and supportive technical indicators. However, with both RSI and Stochastic in overbought territory, the probability of short-term consolidation or retracement before testing 1.37820 is high. Traders should monitor todays UK housing data and US inflation numbers closely, as these releases could be the catalysts for either a breakout continuation or a pullback toward support. Disclaimer: The analysis provided for GBP/USD is for informational purposes only and does not constitute investment advice. Traders are encouraged to perform their own analysis and research before making any trading decisions on GBPUSD. Market conditions can change quickly, so staying informed with the latest data is essential. FXGlory 08.14.2025
|
|
#454
14-08-2025, 23:37
|
||||
|
||||
|
USDJPY H4 Technical and Fundamental Analysis for 08.15.2025
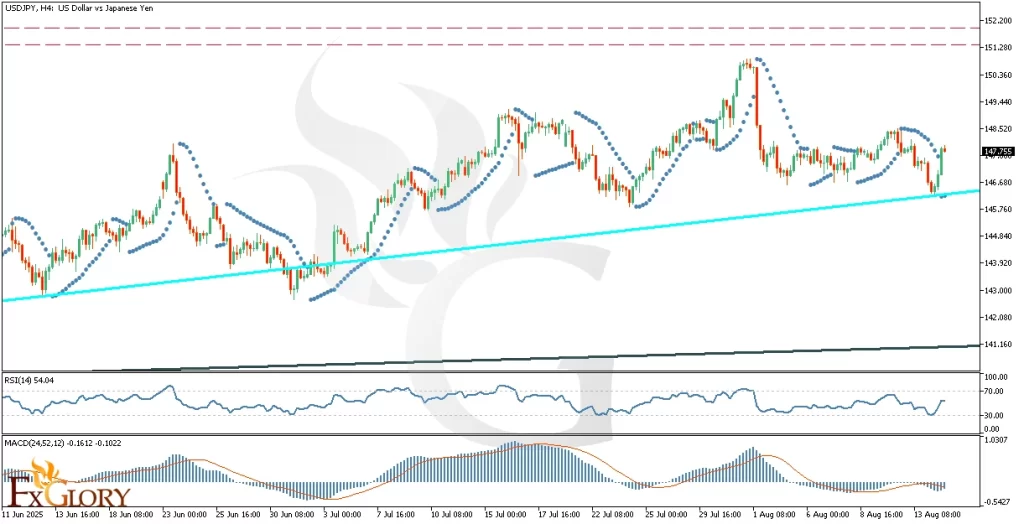 Time Zone: GMT +3 Time Frame: 4 Hours (H4) Fundamental Analysis The USD/JPY currency pair is currently influenced by a packed economic calendar for both the United States and Japan. For the JPY, traders are watching todays GDP Deflator, Real GDP, and Industrial Production data from the Cabinet Office and METI. Stronger-than-expected Japanese growth or production figures may bolster the Yen by raising the prospect of tighter Bank of Japan policy. On the USD side, key data releases include Retail Sales, Core Retail Sales, Empire State Manufacturing Index, Import Price Index, Capacity Utilization, Industrial Production, and University of Michigan Consumer Sentiment. Positive results across these indicators would strengthen the USD by supporting a hawkish Federal Reserve stance, while weaker outcomes could dampen dollar demand. Given the heavy data flow, volatility in USDJPY is likely to remain elevated throughout the session. Price Action On the H4 timeframe, USD-JPY has been trending upward since mid-June 2025, respecting a strong ascending trendline. The pair recently tested this dynamic support at 146.70 and bounced higher, signaling renewed bullish pressure. This rebound keeps the sequence of higher highs and higher lows intact, pointing toward a possible move toward 151.60 in the medium term. The recent pullback appears corrective in nature, and the recovery suggests bullish continuation remains the dominant scenario. Key Technical Indicators Parabolic SAR: The most recent Parabolic SAR dots have flipped above the price and are widening, indicating that the prior bearish momentum is losing steam and that a bullish reversal is taking shape as the market reclaims the trendline. RSI (14): Currently at 54.04, the RSI has broken above the neutral 50 level from below, reflecting improving bullish momentum. This position still leaves room before reaching the overbought threshold (70), which supports the potential for further upside. MACD (24,52,12): The MACD line at -0.1612 and the signal line at -0.1022 remain in negative territory but are converging. This narrowing gap suggests weakening bearish momentum, and a bullish crossover could confirm the next leg higher toward the 151.60 resistance. Support and Resistance Support: Immediate support is located at 146.700, which aligns with the ascending trendline and a recent price rebound zone. A deeper correction could find the next support at 145.750, matching a previous consolidation area. Resistance: The nearest resistance level is at 149.450, which coincides with the last swing high before the recent retracement. A sustained breakout above this level could open the way toward 151.600, a key long-term resistance zone and previous peak. Conclusion and Consideration The USDJPY H4 chart remains structurally bullish, with price respecting the ascending trendline and indicators signaling potential momentum recovery. RSIs move above 50, the Parabolic SAR shift, and MACDs potential bullish crossover all align with the possibility of an advance toward 149.45 and, if broken, the 151.60 resistance. However, todays multiple high-impact data releases from both the US and Japan could trigger sharp intraday swings. Traders should manage positions carefully and consider volatility when setting stop-loss and take-profit levels. Disclaimer: The analysis provided for USD/JPY is for informational purposes only and does not constitute investment advice. Traders are encouraged to perform their own analysis and research before making any trading decisions on USDJPY. Market conditions can change quickly, so staying informed with the latest data is essential. FXGlory 08.15.2025
|
|
#455
18-08-2025, 02:53
|
||||
|
||||
|
EURUSD H4 Technical and Fundamental Analysis for 08.18.2025
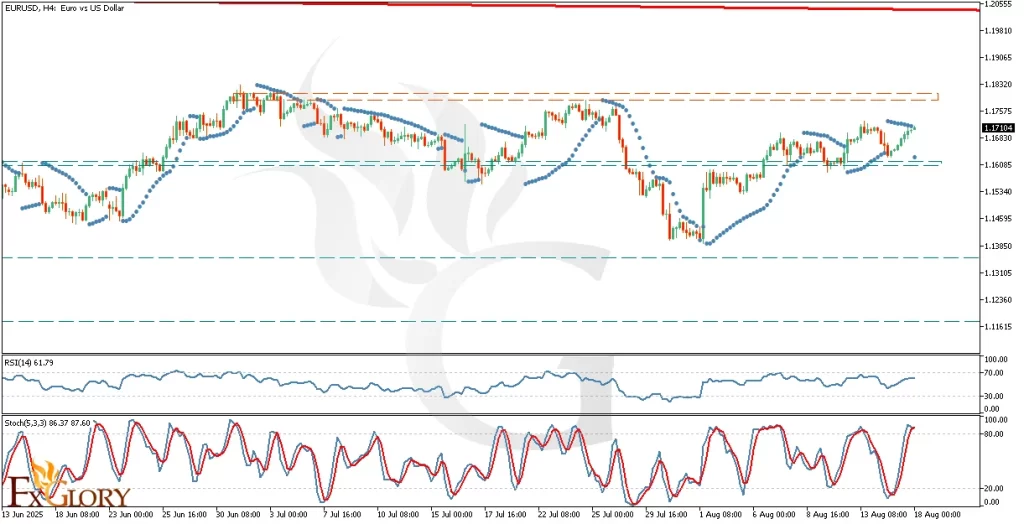 Time Zone: GMT +3 Time Frame: 4 Hours (H4) Fundamental Analysis The EUR-USD exchange rate remains sensitive to macroeconomic releases for both the Euro and the US. Todays calendar shows the Eurostat Trade Balance for the eurozone and the NAHB Housing Market Index for the US as the closest scheduled items Eurostats trade balance printed stronger-than-expected would be bullish for EURUSD, while a surprise upside in the NAHB index would favor the USD and could weigh on EURUSD. Overall, absent large surprises, these releases usually generate muted moves on the H4 timeframe, but an outsized surprise can amplify intraday volatility. Traders using fundamental analysis EURUSD should monitor these prints alongside market positioning and rate-expectation commentary to judge the next directional impulse. Price Action The EURUSD H4 price action shows a renewed bullish structure after a deep correction: the pair has formed higher lows and is now approaching the prior double-top area around 1.18000. Recent candles demonstrate controlled bullish pressure rather than explosive breakouts, suggesting accumulation and a tactical long bias while respecting resistance. The key short-term battle is at the double-top: a clean rejection increases the chance of a retracement to 1.16116, whereas a decisive breakout above 1.1800 with follow-through would validate continuation toward the longer-term monthly resistance near 1.20400. This price action EURUSD H4 view supports selective long entries on pullbacks into proven support, with stops placed beyond the H4 invalidation levels. Key Technical Indicators Parabolic SAR: The latest Parabolic SAR dot is below the price, indicating the current H4 trend is bullish. The PSAR confirms upside momentum and can be used as a trailing stop; a flip of the dots above price would be an early sign of trend exhaustion or a deeper pullback. RSI (14): RSI sits at ~61.8, showing bullish bias with room before classical overbought (70). The upward slope supports continuation, but traders should watch for RSI stalling or bearish divergence as a warning of weakening momentum in the EURUSD H4 technical analysis. Stochastic (5,3,3): Stochastic readings are ~86.37 / 87.60, clearly in overbought territory. This increases the likelihood of a near-term consolidation or pullback even in an uptrend. A bearish %K/%D crossover on the H4 stochastic would be a useful timing signal for short-term sellers or for traders to scale out of longs. Support and Resistance Support: Immediate support is located at 1.16116, which aligns with the recent H4 consolidation area and short-term swing lows; secondary support sits near 1.13850, corresponding to the lower H4 swing and deeper correction zone. Resistance: The nearest resistance level is at 1.18000, which coincides with the prior double-top zone and the last two highs; the next major resistance / monthly target is around 1.20400, aligning with the longer-term monthly resistance line. Conclusion and Consideration EUR/USD on the H4 chart shows a bullish structural trend supported by Parabolic SAR and RSI, while Stochastics overbought reading cautions about short-term retracements. The immediate tactical plan: favor buy-on-dip entries toward the 1.16116 support with targets into 1.18000; if price breaks and holds above 1.18000, consider the path open toward the 1.20400 monthly resistance. Conversely, a decisive break below 1.16116 would signal a deeper correction and shift the bias lower toward the 1.13850 zone. Always combine this technical and fundamental chart daily analysis with the incoming Eurostat and NAHB headlines, watch for order flow confirmation, and size positions conservatively given potential news-driven spikes. Disclaimer: The analysis provided for EUR/USD is for informational purposes only and does not constitute investment advice. Traders are encouraged to perform their own analysis and research before making any trading decisions on EURUSD. Market conditions can change quickly, so staying informed with the latest data is essential. FXGlory 08.18.2025
|
|
#456
19-08-2025, 06:19
|
||||
|
||||
|
NZDUSD H4 Technical and Fundamental Analysis for 08.19.2025
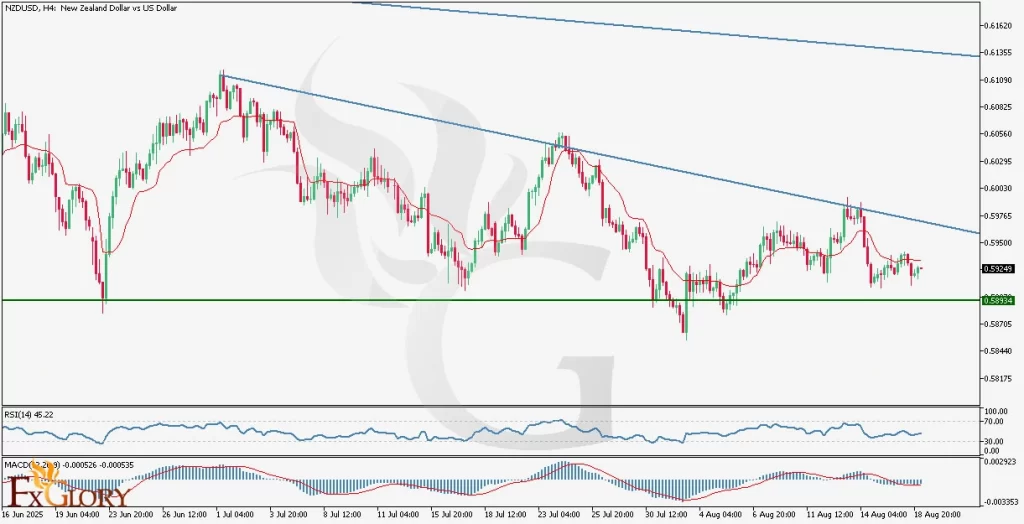 Time Zone: GMT +3 Time Frame: 4 Hours (H4) Fundamental Analysis The NZDUSD pair remains sensitive to both New Zealand domestic data and US macro/newsflow. On the NZD side, upcoming Producer Price Index (PPI) releases and the twice-monthly GlobalDairyTrade (GDT) auction are relevant stronger-than-expected PPI or higher dairy auction prices would support the NZD via inflation and export-income channels. For the USD, headline events this week include monthly Residential Building Permits and Housing Starts (Census Bureau), Federal Reserve Governor Michelle Bowman speaking (possible hawkish cues), and weekly API/EIA energy reports; stronger housing or hawkish Fed commentary typically strengthens the USD and can push NZD-USD lower. Overall, the macro backdrop currently favours risk-off/skittish flows into the USD if US prints surprise to the upside, while NZD remains vulnerable to commodity and PPI surprises. Price Action The H4 price action shows the pair entrenched in a long-term downtrend with a clear sequence of lower highs and lower lows. Recently the market has been consolidating between the nearest support area around 0.58934 and short-term resistance near 0.59547, forming a shallow range after a bearish impulse. Candles are trading below the moving average line, which is acting as dynamic resistance; failed attempts to close above 0.59547 point to sellers defending the earlier resistance line. Given the structure, any upward retracement would first test 0.59547 and then the long-term descending resistance near 0.61180, while renewed selling pressure risks a drop back to 0.58934 and ultimately the historical support zone around 0.56602. Key Technical Indicators Moving Average (9): Price is trading below the H4 moving average, which is sloping downward and acting as dynamic resistance, rallies have been capped at the MA. Until price closes convincingly above the MA, expect sellers to remain in control and treat rallies as shorting opportunities. RSI (14): Momentum is mildly bearish but not extreme, sitting around 43.78, which is below the 50 midpoint yet far from oversold. This leaves room for further downside while still allowing for a retracement if RSI moves back above 50. MACD (12,26,9): Momentum is weak with the MACD and signal lines nearly overlapping (MACD ≈ -0.000558, Signal ≈ -0.000541), yielding a small negative histogram. Wait for a clear crossover or histogram expansion aligned with price structure before taking directional trades. Support and Resistance Support: Near-term support sits at 0.58934, the recent swing low and short-term demand zone where buyers previously defended prices, with a deeper structural floor at 0.56602 that would act as the next major support if selling intensifies. Resistance: Immediate resistance is at 0.59547, a congestion zone and the first upside hurdle for any retracement, while the long-term descending trendline around 0.61180 represents the larger supply area that must be cleared to shift the bearish bias. Conclusion and Consideration NZD/USD on the H4 timeframe remains in a structural downtrend; technical indicators (MA, RSI, MACD) all lean mildly bearish to neutral and the pair is consolidating under the moving average. Shorter intraday traders can look for reliable setups near the 0.58934 support for counter-trend scalps with tight stops, but trend-following traders should favour short opportunities on rallies toward 0.59547 or the dynamic MA, targeting a move back toward 0.58934 and, if momentum accelerates, 0.56602. Fundamental catalysts (US Building Permits/Housing Starts, Fed Gov. Bowman remarks, NZ PPI and GDT dairy results) could spark volatility plan entries around confirmed price action signals and prioritize risk management. Disclaimer: The analysis provided for NZD/USD is for informational purposes only and does not constitute investment advice. Traders are encouraged to perform their own analysis and research before making any trading decisions on NZDUSD. Market conditions can change quickly, so staying informed with the latest data is essential. FXGlory 08.19.2025
|
|
#457
20-08-2025, 07:40
|
||||
|
||||
|
EURGBP H4 Technical and Fundamental Analysis for 08.20.2025
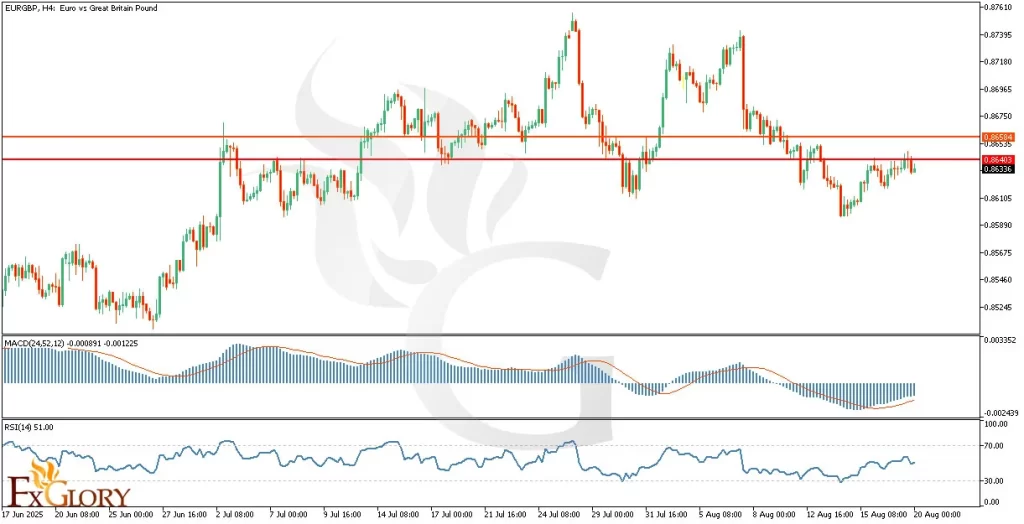 Time Zone: GMT +3 Time Frame: 4 Hours (H4) Fundamental Analysis: The EUR-GBP exchange rate remains highly reactive to inflation prints and central bank communication on both sides. Todays focus is on the UK Consumer Price Index release from the Office for National Statistics and the scheduled speech by ECB President Christine Lagarde. A stronger-than-expected CPI reading would be bullish for the pound, potentially weighing on EURGBP, while any hawkish tone from Lagarde regarding Eurozone inflation and rates could support the euro and lift the cross. Historically, UK CPI tends to generate more immediate volatility than ECB speeches on the H4 timeframe, though sharp policy hints from Lagarde can create outsized swings. Traders analyzing EURGBP through fundamentals should watch these events closely, as they may shape near-term rate expectations and directional momentum. Price Action The EURGBP H4 chart shows signs of a completed bullish phase, with price failing to sustain the prior highs near 0.87200 and instead breaking lower into the 0.862000.86500 support zone. Recent candles reflect sideways consolidation with limited upside momentum, suggesting exhaustion of the earlier bullish trend. The immediate structure indicates that 0.86540 acts as key resistance, where repeated rejections highlight sellers defending the level. A sustained rejection here could reinforce downside continuation toward 0.86200, while only a decisive breakout above 0.86540 with follow-through would reopen the path toward 0.87200. Overall, this H4 price action favors cautious short setups below resistance, with stops placed above the recent rejection zone. Key Technical Indicators MACD (24,52,12): The MACD histogram is still in negative territory, though showing early signs of contraction as the bars turn less negative. This suggests bearish momentum is slowing but not yet reversed. A bullish crossover of the signal line would confirm momentum shifting, while continued weakness would reinforce downside bias. RSI (14): RSI currently sits near 50.5, reflecting neutral momentum after the prior down-leg. This midpoint reading signals indecision, with neither buyers nor sellers in control. A break above 60 would tilt bias bullish toward recovery, while a drop under 40 would favor continuation of the bearish structure. Support and Resistance Support: Immediate support is at 0.86230, aligning with the recent H4 swing low; secondary support lies near 0.85830, marking the lower correction zone. Resistance: The nearest resistance is 0.86540, defined by multiple recent rejections; the next level is 0.86760, coinciding with the upper H4 range. Conclusion and Consideration In summary, EURGBP on the H4 timeframe is currently caught between key fundamental catalysts and a technically vulnerable structure. With the pair consolidating below 0.86540 resistance and showing signs of bullish exhaustion, the bias leans slightly bearish unless buyers can force a decisive breakout above this level. The upcoming UK CPI release and ECB President Lagardes speech will likely provide the volatility needed for a clearer directional move. Until then, traders may favor cautious short positions below resistance while monitoring fundamental developments for potential momentum shifts. Overall, the balance of risks suggests a watchful stance, with downside continuation more probable unless strong Euro-driven catalysts emerge. Disclaimer: The analysis provided for EUR/GBP is for informational purposes only and does not constitute investment advice. Traders are encouraged to perform their own analysis and research before making any trading decisions on EURGBP. Market conditions can change quickly, so staying informed with the latest data is essential. FXGlory 08.20.2025
|
|
#458
21-08-2025, 05:30
|
||||
|
||||
|
GBPUSD Technical and Fundamental Analysis for 08.21.2025
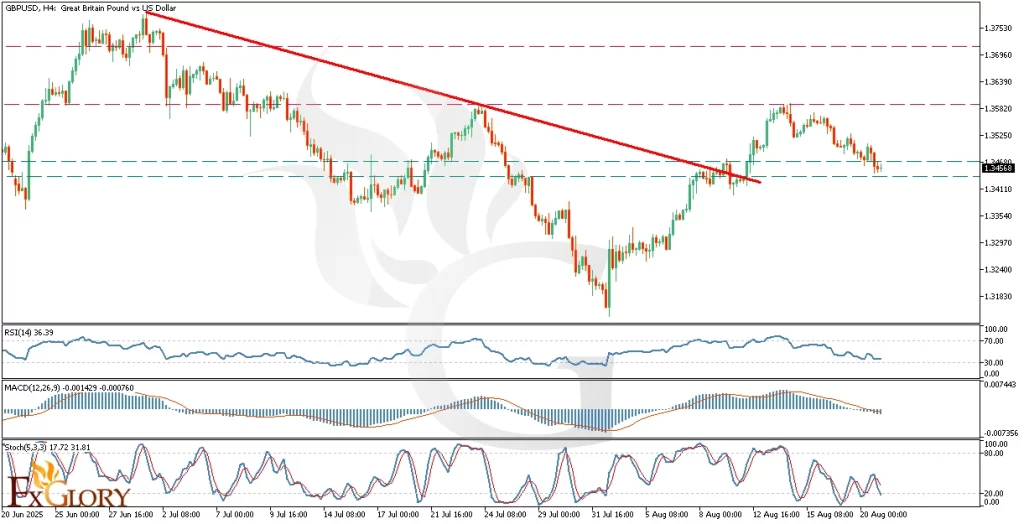 Time Zone: GMT +3 Time Frame: 4 Hours (H4) Fundamental Analysis The GBPUSD currency pair is anticipating significant volatility due to today's scheduled economic events. For GBP, investors will closely monitor the public sector net borrowing data from the Office for National Statistics, which will indicate fiscal stability. Furthermore, the manufacturing and services PMI figures from S&P Global and the CBI Industrial Trends Survey are critical for assessing the UK's economic outlook. For the USD, traders will focus on Federal Reserve Bank of Atlanta President Raphael Bostic's speech and key economic indicators such as Initial Jobless Claims, Manufacturing and Services PMI, Philadelphia Fed Manufacturing Index, and Existing Home Sales. These events collectively could induce notable volatility in GBPUSD, guiding future monetary policy expectations. Price Action Analyzing GBPUSD in the H4 timeframe reveals a persistent bullish trend since 2022. Recently, the price successfully breached the resistance line of the most recent correction and is currently testing a significant support zone around 1.34568. The price action indicates potential bullish momentum towards the recent high at 1.37600. The proximity of RSI to oversold levels (near 30) further supports expectations for a reversal and continuation of the bullish trend. Key Technical Indicators RSI (14): Currently at 36.39, RSI is approaching oversold territory, suggesting that GBPUSD may soon experience a bullish reversal. Traders should be prepared for potential buying opportunities as the RSI crosses upward from the 30 level. MACD: The MACD is currently showing readings of -0.001429 and -0.000760. Although still negative, the narrowing gap between the MACD line and the signal line suggests weakening bearish momentum, setting the stage for a potential bullish crossover. Stochastic Oscillator: Stochastic values at 17.72 and 31.81 indicate the currency pair is significantly oversold. Such conditions typically precede a bullish reversal, highlighting favorable conditions for GBPUSD longs. Support and Resistance Levels Support: Immediate strong support is observed at the current price level of approximately 1.34568. Below this, the next critical support lies around the 1.34100 zone. Resistance: The nearest resistance levels are found at 1.35820, followed by the significant psychological barrier at 1.37600, representing the recent major high. Conclusion and Consideration The technical analysis of GBPUSD in the H4 timeframe indicates favorable conditions for a bullish reversal from the current support zone. Key technical indicators like RSI, MACD, and Stochastics reinforce the bullish outlook, especially as price nears oversold conditions. However, traders must remain cautious given the potential market volatility from today's key economic data releases affecting both GBP and USD. It's advisable to await confirmed bullish signals before committing to long positions. Disclaimer: The analysis provided for GBP/USD is for informational purposes only and does not constitute investment advice. Traders are encouraged to perform their own analysis and research before making any trading decisions on GBPUSD. Market conditions can change quickly, so staying informed with the latest data is essential. FXGlory 08.21.2025
|
|
#459
21-08-2025, 23:29
|
||||
|
||||
|
GOLDUSD H4 Technical and Fundamental Analysis for 08.22.2025
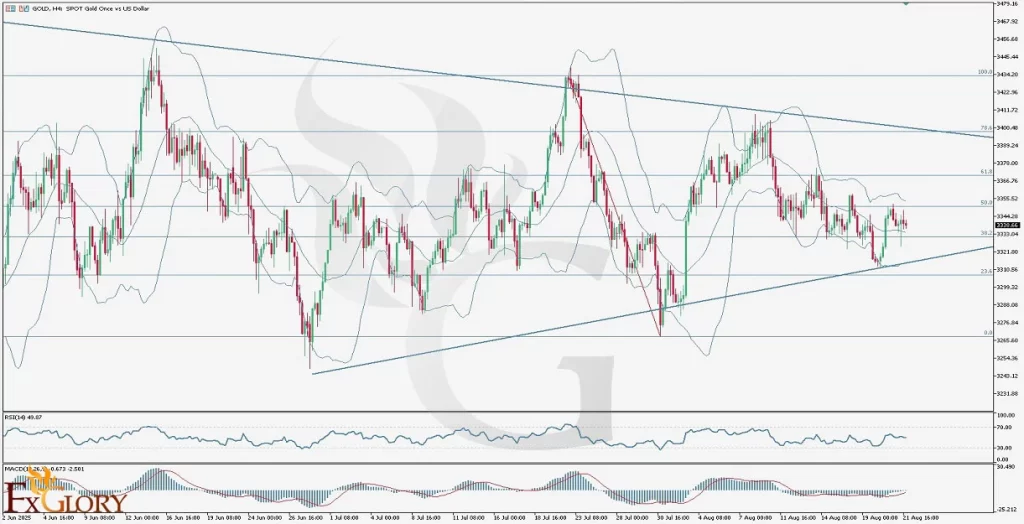 Time Zone: GMT +3 Time Frame: 4 Hours (H4) Fundamental Analysis: The gold market is currently influenced by ongoing USD strength expectations, driven by scheduled speeches from key Federal Reserve officials including Jerome Powell, Susan Collins, and Beth Hammack. Hawkish statements on monetary policy and economic outlook from these FOMC members could support USD appreciation, placing downward pressure on gold prices in the short term. Moreover, global inflation concerns and safe-haven demand for gold continue to influence the XAU/USD market, making it sensitive to both USD fluctuations and geopolitical risks. Traders should closely monitor these speeches for indications of interest rate changes that may impact golds price action on H4 and daily charts. Price Action: On the H4 chart, gold is showing a short-term bearish trend after testing the upper Bollinger Band and the 50% Fibonacci retracement level, which acted as strong resistance. The price has since moved toward the middle Bollinger Band and the 38.2% Fibonacci retracement level, indicating consolidation within the current range. The market is forming a symmetrical triangle pattern, with higher lows and lower highs, suggesting that a breakout from these trendlines could define the next directional move. Currently, gold is reacting to established support and resistance levels, and traders should observe whether the upper or lower trendline breaks. Key Technical Indicators: Bollinger Bands: Golds price recently reached the upper Bollinger Band and retraced toward the middle band, signaling short-term bearish momentum. The bands are moderately wide, indicating average volatility in the H4 timeframe. The price respecting both the upper and middle bands confirms the relevance of these levels in guiding intraday trades. MACD (Moving Average Convergence Divergence): The MACD line is at -0.673 and the signal line at -2.501, indicating bearish momentum in the short term. The histogram suggests a slight recovery but the overall trend remains negative, supporting a cautious approach for potential short trades. RSI (Relative Strength Index): The RSI is currently at 49.87, moving horizontally near the neutral zone. This indicates neither overbought nor oversold conditions, suggesting the market is consolidating and could respond sharply once a breakout from the triangle pattern occurs. Support and Resistance Support: Immediate support is near 3333.00, aligning with the 38.2% Fibonacci retracement level, with secondary support around 3330.00, marking a key area of prior consolidation. Resistance: The nearest resistance zone is between 3350.00 and 3355.00, coinciding with the 50% Fibonacci retracement level and the upper Bollinger Band, providing strong potential selling pressure. Conclusion and Consideration: Gold on the H4 chart is currently in a consolidation phase within a symmetrical triangle pattern. Short-term bearish momentum is observed, supported by the retracement from the upper Bollinger Band and MACD readings. Traders should watch key trendline breaks and upcoming USD-related news for directional confirmation. A break above 3355 could signal bullish momentum, while a drop below 3320 could accelerate the bearish trend. Market participants must remain cautious given the high volatility potential from upcoming speeches by Federal Reserve officials. Disclaimer: The analysis provided for GOLD/USD is for informational purposes only and does not constitute investment advice. Traders are encouraged to perform their own analysis and research before making any trading decisions on GOLDUSD. Market conditions can change quickly, so staying informed with the latest data is essential. FXGlory 08.22.2025
|
|
#460
26-08-2025, 06:57
|
||||
|
||||
|
USDCAD Daily Technical and Fundamental Analysis for 08.26.2025
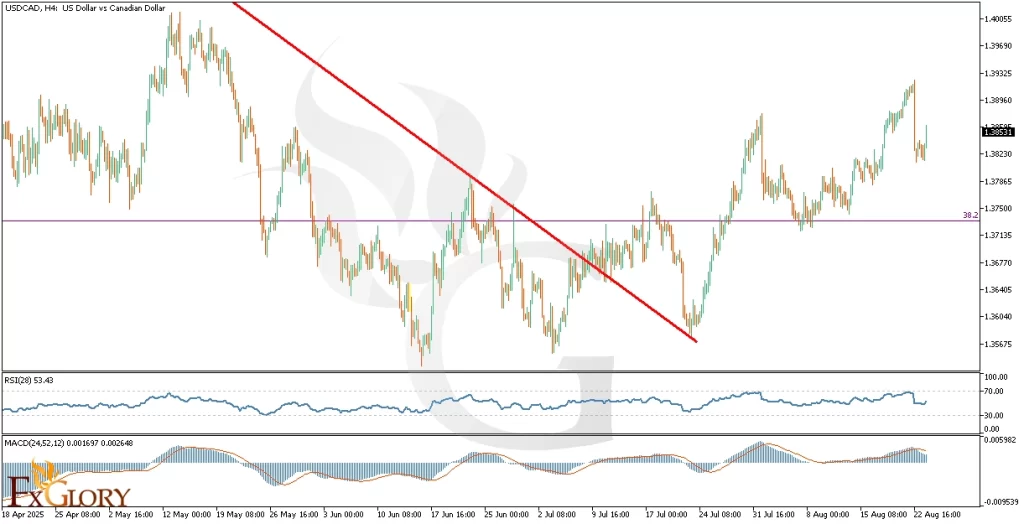 Time Zone: GMT +3 Time Frame: 4 Hours (H4) Fundamental Analysis The USD-CAD pair reflects the exchange rate between the US Dollar (USD) and the Canadian Dollar (CAD). Today, significant volatility can be expected in USD-related pairs due to multiple key events. Federal Reserve Bank of New York President John Williams and Richmond President Thomas Barkin are scheduled to speak, potentially impacting monetary policy sentiment. Data on Durable Goods Orders excluding transportation items will be closely watched as they serve as leading indicators for manufacturing activity. Additionally, Bank of Canada Governor Tiff Macklem's speech on flexible inflation targeting at the Bank of Mexico Centennial Conference could induce CAD volatility. Traders should remain cautious and alert to sudden market moves. Price Action The USD/CAD pair has shown a clear bullish price action on the H4 timeframe. After maintaining an overall uptrend since mid-2021, the recent correction to Fibonacci retracement levels between 38.2% and 50% appears to have completed. Price has rebounded decisively, signaling a continuation of the bullish momentum. The market is currently aiming at the 23.6% Fibonacci retracement level, but the psychological resistance zone at 1.40000 remains a critical test ahead. Traders should closely monitor candlestick patterns around this key resistance for potential reversals or continuations. Key Technical Indicators RSI (28): Currently at 53.4, the RSI indicates balanced market conditions, with neither overbought nor oversold levels present. This mid-level position allows ample room for the price to move higher, supporting the potential continuation of the bullish trend in USD CAD. MACD (24,52,12): With values of 0.001697 and 0.002648, the MACD indicator shows bullish momentum, as the MACD line remains above the signal line. The positive histogram further confirms sustained bullish pressure. Traders should monitor the MACD closely for any divergence signs that might indicate a weakening trend. Support and Resistance Support: Immediate support stands at the 1.3750 Fibonacci level, aligned with recent swing lows and the previous correction bottom. Resistance: Key resistance is located at the psychological 1.4000 level, a major barrier that could potentially halt or slow down bullish momentum before price reaches the Fibonacci 23.6% retracement. Conclusion and Consideration The USD VS. CAD H4 chart analysis suggests a bullish outlook supported by current fundamental factors, recent price action, and technical indicators. Price action has returned to its broader uptrend after a healthy Fibonacci correction, with indicators pointing towards further bullish potential. However, traders must exercise caution due to today's high-impact speeches and durable goods data, potentially introducing market volatility. Disclaimer: The analysis provided for USD/CAD is for informational purposes only and does not constitute investment advice. Traders are encouraged to perform their own analysis and research before making any trading decisions on USDCAD. Market conditions can change quickly, so staying informed with the latest data is essential. FXGlory 08.26.2025
|
|
#461
27-08-2025, 06:00
|
||||
|
||||
|
GBPUSD H4 Technical and Fundamental Analysis for 08.27.2025
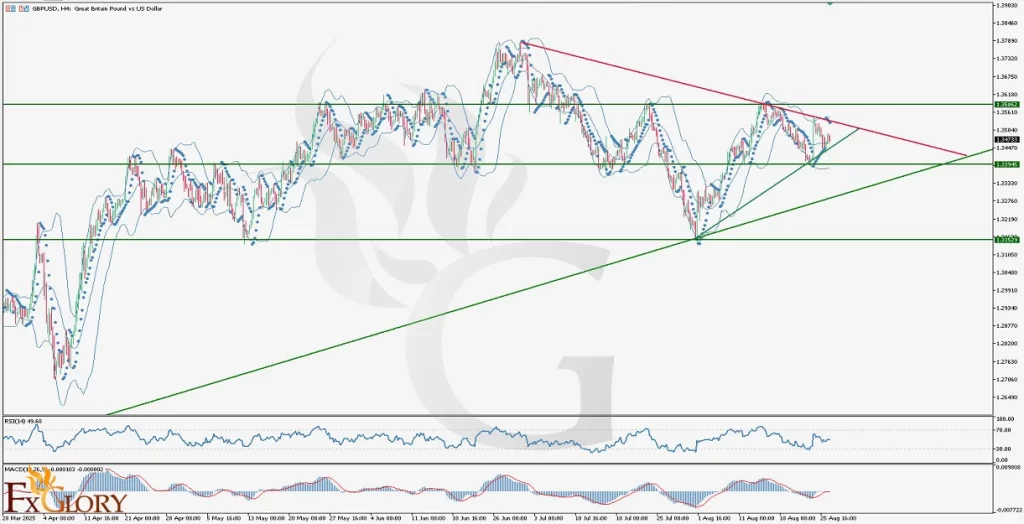 Time Zone: GMT +3 Time Frame: 4 Hours (H4) Fundamental Analysis: The GBP/USD pair today is influenced by key upcoming economic news on both the US Dollar (USD) and the British Pound (GBP). From the US side, traders will be closely monitoring the API and EIA crude oil inventory data, which usually impacts USD indirectly through energy-related price volatility, as well as a speech from Richmond Fed President Thomas Barkin that could provide further signals on Federal Reserve monetary policy. Hawkish commentary from FOMC members tends to support the USD, while dovish signals may weaken it. On the UK side, the Confederation of British Industry (CBI) Distributive Trades Survey will be released, reflecting consumer spending patterns. A stronger-than-expected CBI reading would support the GBP, while weaker results may exert downward pressure. Overall, mixed fundamentals suggest that GBP USD could remain volatile throughout todays trading session. Price Action: On the H4 chart, GBP/USD price action shows that the pair is currently consolidating within a rectangle pattern, trapped between major support and resistance. The price has been respecting a long-term bullish trendline while at the same time struggling with a descending bearish trendline drawn from the mid-July highs. Since the beginning of August, the price has corrected upward from 1.3150 lows but is now facing resistance near the 1.3586 level. Currently, GBP/USD trades near the Bollinger Bands middle line, reflecting indecision and potential breakout conditions in either direction. Key Technical Indicators: Bollinger Bands: GBP/USD is moving around the middle Bollinger Band, with the last candles showing compression. This indicates reduced volatility and the possibility of an upcoming breakout. The upper band aligns closely with resistance near 1.3586, while the lower band supports the 1.3394 zone. Parabolic SAR: The last four Parabolic SAR dots are positioned above the candles, signaling bearish pressure. As long as SAR remains above price action, short-term sentiment may lean bearish, but a flip below candles would indicate renewed bullish momentum. RSI (Relative Strength Index): The RSI currently stands at 49.68, reflecting a neutral stance. This midpoint suggests that GBPUSD has not entered overbought or oversold territory, supporting the idea of consolidation before a potential breakout. MACD (Moving Average Convergence Divergence): The MACD line at -0.000103 and the signal line at -0.000002 show weak bearish momentum. The histogram remains flat, indicating a lack of strong directional bias. Traders should monitor for a potential crossover to confirm momentum shifts. Support and Resistance: Support: Strong support lies near 1.3394, followed by deeper support at 1.3153. These levels align with trendline confluence and recent swing lows. Resistance: The nearest resistance is at 1.3586, where the descending trendline and previous highs converge, acting as a strong barrier for buyers. Conclusion and Consideration: The GBP/USD H4 technical and fundamental analysis suggests that the pair is currently consolidating within a critical range, supported by a long-term bullish trendline but capped by a strong descending resistance line. Key technical indicators, including Bollinger Bands, RSI, MACD, and Parabolic SAR, point to indecision, with a potential breakout likely as volatility compresses. Traders should closely monitor todays fundamental news from both the US and UK, as the combination of API/EIA crude data, FOMC commentary, and CBI survey results could trigger sharp moves. Disclaimer: The analysis provided for GBP/USD is for informational purposes only and does not constitute investment advice. Traders are encouraged to perform their own analysis and research before making any trading decisions on GBPUSD. Market conditions can change quickly, so staying informed with the latest data is essential. FXGlory 08.27.2025
|
|
#462
29-08-2025, 02:02
|
||||
|
||||
|
USDJPY Technical and Fundamental Analysis for 08.29.2025
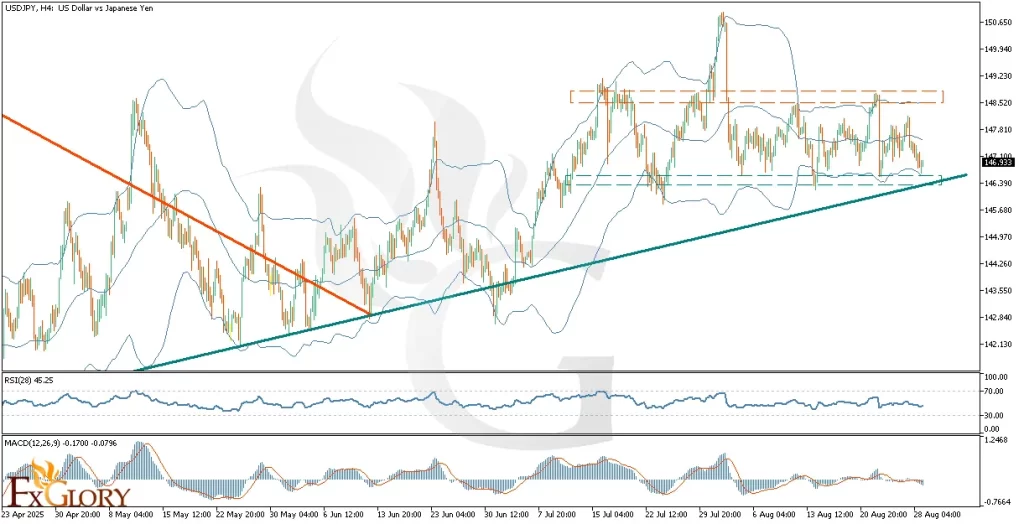 Time Zone: GMT +3 Time Frame: 4 Hours (H4) Fundamental Analysis The USD-JPY pair is currently influenced by significant economic news from both the US and Japan. Today, traders will closely monitor the US Federal Reserve Governor Christopher Wallers speech regarding monetary policy and inflation, potentially driving volatility for the USD. Additionally, US Personal Consumption Expenditures (PCE) data, income, and consumer spending reports are anticipated, each critically influencing USD valuation. On the JPY side, key indicators like Tokyo CPI, Jobless Rate, Industrial Production, Retail Trade, and Consumer Confidence are expected to shape trading sentiment and currency fluctuations significantly, possibly providing directional momentum to the pair. Price Action The USD/JPY pair on the H4 timeframe displays a transition from a previous downtrend, clearly broken by an upward momentum, evolving now into a sideways movement. Currently, the price is positioned at a critical horizontal support zone and an ascending support trendline, forming a hammer candlestick pattern signaling potential reversal. If bullish momentum confirms, the price may initially target the Bollinger Bands' midline around 147.48, with a potential continuation toward the upper band coinciding with the horizontal resistance zone. Key Technical Indicators Bollinger Bands: The Bollinger Bands have flattened significantly, indicating a consolidation phase with low volatility. The price is currently at the lower band, suggesting it could rebound toward the mid-band, implying potential bullish movement in the short term. RSI (28): The RSI currently stands at 45.25, showing neutral market sentiment. This moderate reading suggests the USDJPY has ample room to rise without immediate risk of becoming overbought, reinforcing the possibility of bullish momentum continuation. MACD (12,26,9): The MACD indicator shows a slightly negative histogram and a MACD line closely hugging the signal line, implying indecision and weak bearish momentum. Traders should watch for a bullish crossover as a signal to confirm a bullish scenario. Support and Resistance Support: Immediate support at 146.93, aligning with the horizontal support zone and ascending trendline. Further support observed at the psychological level of 146.39. Resistance: Key resistance levels are identified at 147.48 (mid Bollinger Band) and stronger resistance at 148.52 (horizontal resistance and upper Bollinger Band). Conclusion and Consideration In conclusion, the USD-JPY H4 technical and fundamental chart analysis indicates a potential bullish reversal scenario supported by price action, Bollinger Bands, and neutral RSI. However, MACD suggests caution until clearer bullish signals emerge. Traders must carefully monitor today's high-impact economic news from the US and Japan, which could introduce significant volatility and impact the USD Vs. JPY currency pair's directional bias. Disclaimer: The analysis provided for USD/JPY is for informational purposes only and does not constitute investment advice. Traders are encouraged to perform their own analysis and research before making any trading decisions on USDJPY. Market conditions can change quickly, so staying informed with the latest data is essential. FXGlory 08.29.2025
|
|
#463
01-09-2025, 00:23
|
||||
|
||||
|
EURGBP H4 Technical and Fundamental Analysis for 09.01.2025
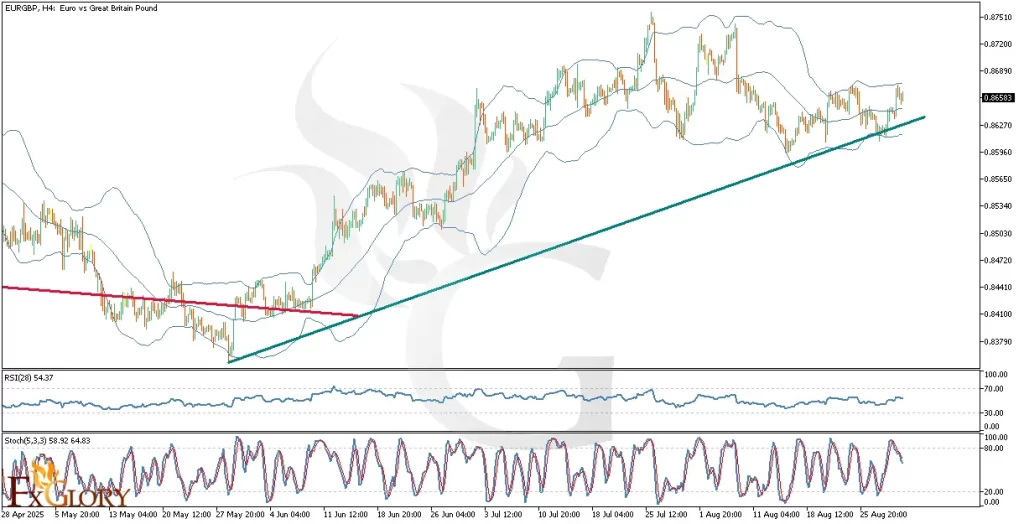 Time Zone: GMT +3 Time Frame: 4 Hours (H4) Fundamental Analysis The EUR-GBP currency pair is influenced today by crucial economic indicators. For the Euro, traders await the S&P Global Manufacturing PMI release, which signals the health of the manufacturing industry across the Eurozone. An actual result exceeding forecasts typically strengthens the Euro by indicating economic expansion. Additionally, unemployment data from Eurostat will offer insights into labor-market conditions, affecting consumer spending. For GBP, significant data includes Nationwide Building Society’s House Price Index (HPI), reflecting housing sector health, and the S&P Global Manufacturing PMI. Traders should closely monitor these releases as stronger-than-expected figures generally bolster respective currencies. Price Action Analyzing EUR/GBP price action on the H4 chart shows an established uptrend. The pair recently touched the lower Bollinger Band and ascending trendline support, effectively bouncing upwards, reflecting continued bullish momentum. Price is now retreating from the upper Bollinger Band towards the middle line, suggesting a short-term correction. Given current dynamics, EURGBP may consolidate near the middle line before potentially resuming its upward trend. Key Technical Indicators Bollinger Bands: EURGBP's price has rebounded from the lower Bollinger Band, currently correcting after reaching the upper band. The narrowing bands imply potential consolidation, but sustained closeness to the upper half supports bullish continuation. RSI (28): The RSI stands at 54.37, indicating neutral momentum. There remains sufficient room for upward movement before approaching overbought territory, reinforcing potential bullish prospects after this correction. Stochastic Oscillator (5,3,3): The Stochastic indicator reads 56 and 65, demonstrating bullish crossover momentum. Although pointing downward temporarily, the indicator is within neutral territory, signaling potential bullish continuation following minor corrections. Support and Resistance Support: Immediate support is located at 0.8627, aligning with the recent ascending trendline and lower Bollinger Band. Resistance: The nearest resistance level is at 0.8689, coinciding with the recent swing high and the upper Bollinger Band. Conclusion and Consideration The EUR-GBP H4 analysis reveals an ongoing bullish bias, validated by supportive Bollinger Bands and neutral RSI and Stochastic indicators, which suggest potential bullish momentum continuation post-correction. Traders should pay close attention to today's economic releases from the Eurozone and the UK, as favorable data could reinforce bullish sentiment, potentially driving EURGBP higher. Key support and resistance levels identified will help manage risk and optimize trade entries and exits. Disclaimer: The analysis provided for EUR/GBP is for informational purposes only and does not constitute investment advice. Traders are encouraged to perform their own analysis and research before making any trading decisions on EURGBP. Market conditions can change quickly, so staying informed with the latest data is essential. FXGlory 09.01.2025
|
|
#464
02-09-2025, 05:42
|
||||
|
||||
|
EURJPY H4 Technical and Fundamental Analysis for 09.02.2025
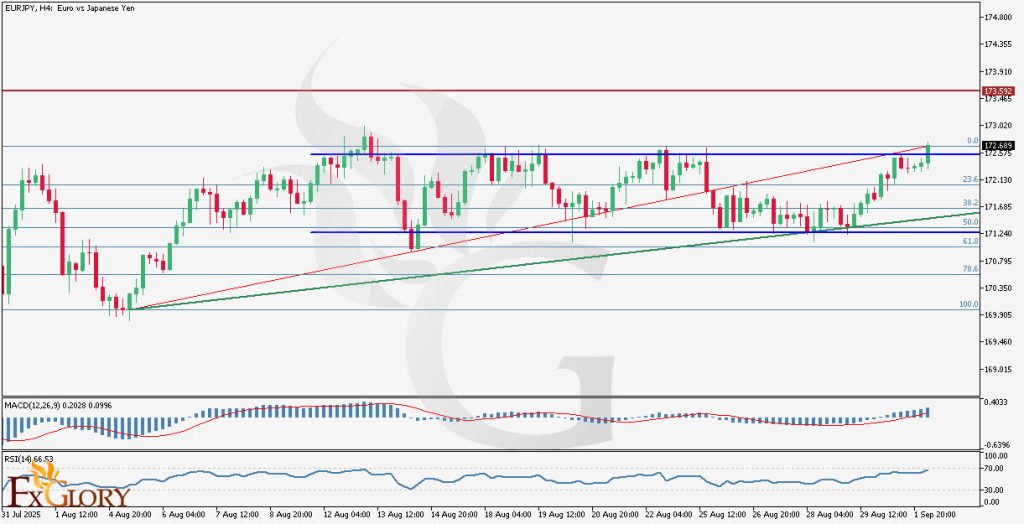 Time Zone: GMT +3 Time Frame: 4 Hours (H4) Fundamental Analysis The EURJPY currency pair represents the valuation between the Euro (EUR) and the Japanese Yen (JPY). Today, Eurozone data highlights include the release of key inflation indicators (CPI and Core CPI) by Eurostat, potentially causing significant volatility in EUR pairs. Traders will closely monitor remarks from Deutsche Bundesbank President Joachim Nagel for insights on future ECB monetary policy directions. Concurrently, JPY traders await updates on the Bank of Japan's monetary base and the Japanese Government Bond auction, essential indicators that may impact the Yen significantly. Price Action The EURJPY H4 chart illustrates a clear bullish momentum, recently breaking above a horizontal consolidation channel. Despite the consistent bullish price action, traders should prepare for potential corrective moves towards Fibonacci retracement levels of 23.6%, 38.2%, or even 50.0%. Immediate bullish targets are set around the previous high at 172.826 or the subsequent resistance at 173.592. Traders are advised to confirm a sustained breakout for further bullish continuation. Key Technical Indicators MACD (Moving Average Convergence Divergence): The MACD indicator shows bullish momentum, with a signal line currently at 0.0996 and the histogram positively positioned at 0.2028. This indicates ongoing buyer dominance but suggests vigilance for signs of momentum exhaustion or reversal signals. RSI (Relative Strength Index): The RSI level is currently at 66.53, approaching the overbought threshold. Although bullish momentum persists, RSI readings near overbought conditions highlight the possibility of a short-term retracement or consolidation phase. Support and Resistance Support: Immediate support levels lie at Fibonacci retracement levels, notably at 172.130 (23.6%) and further down at 171.685 (38.2%). Resistance: Primary resistance targets include the recent high at 172.826 and the more significant resistance level at 173.592. Conclusion and Consideration The EURJPY pair maintains bullish momentum on the H4 timeframe, supported by favorable MACD and RSI indications. However, price actions near resistance zones and potential overbought signals suggest caution. Upcoming economic news from both the Eurozone and Japan could introduce substantial volatility, emphasizing the importance of risk management and close monitoring of key technical levels. Disclaimer: The analysis provided for EUR/JPY is for informational purposes only and does not constitute investment advice. Traders are encouraged to perform their own analysis and research before making any trading decisions on EURJPY. Market conditions can change quickly, so staying informed with the latest data is essential. FXGlory 09.02.2025
|
|
#465
03-09-2025, 00:02
|
||||
|
||||
|
AUDUSD H4 Technical and Fundamental Analysis for 09.03.2025
 Time Zone: GMT +3 Time Frame: 4 Hours (H4) Fundamental Analysis: The AUD/USD pair is influenced today by key macroeconomic drivers from both the US Dollar and the Australian Dollar. For the USD, traders will be closely monitoring speeches from Federal Reserve officials, including St. Louis Fed President Alberto Musalem and Minneapolis Fed President Neel Kashkari, with expectations of hawkish comments that may strengthen the dollar. Additionally, the JOLTS job openings, factory orders, and auto sales data are due for release, providing fresh insights into US labor market strength and manufacturing activity. For the AUD, Australias quarterly GDP release and a scheduled speech by RBA Governor Michele Bullock could bring significant volatility, especially if the outlook on growth or interest rate guidance diverges from expectations. Overall, todays AUD/USD forecast depends heavily on central bank commentary and labor market data, which could drive short-term volatility in the H4 chart. Price Action: On the AUD-USD H4 chart, the price recently rejected the 0.6530 resistance area near the 78.6% Fibonacci retracement level. A sharp bearish candle took the pair lower, breaking the middle Bollinger Band and testing the 50% retracement support near 0.6480, before bouncing back to trade above the 61.8% retracement at 0.6518. This indicates strong intraday volatility with buyers defending lower supports but sellers still active around the 0.65300.6550 zone. The overall price action suggests short-term consolidation with a bearish tilt unless the pair can close firmly above the 0.6550 resistance area. Key Technical Indicators: Bollinger Bands: The price has moved from the upper Bollinger Band toward the lower band, breaking the middle line, and recently rebounded after touching the lower band and the 50% Fibonacci retracement. A corrective bullish candle has lifted the price back above the 61.8% retracement level. The Bollinger Bands have expanded, with the upper band moving horizontally and the lower band sloping downward, signaling increased volatility and potential bearish continuation if support fails. Parabolic SAR: The last six dots of the Parabolic SAR are positioned above the recent candles, confirming the ongoing bearish sentiment. The recent downward alignment supports the bearish outlook unless the price can break above 0.6550 to flip the signal to bullish. RSI (Relative Strength Index): The RSI is currently at 48.46, hovering just below the neutral 50 level, indicating neither overbought nor oversold conditions. This suggests consolidation with a slight bearish bias, as momentum remains weak. MACD (Moving Average Convergence Divergence): The MACD line is currently at 0.000274, while the signal line is at 0.001029, showing a narrowing spread. The histogram reflects decreasing bullish momentum, raising the possibility of a bearish crossover if selling pressure increases. Williams %R (%R): The %R is at -53.00, sitting in the mid-range zone, suggesting a lack of clear directional momentum. This neutral reading implies potential sideways trading before a breakout. Support and Resistance: Support: The immediate support is located near 0.6480, aligning with the 50% Fibonacci retracement and the lower Bollinger Band. Resistance: The nearest resistance is seen at 0.65300.6550, close to the 78.6% Fibonacci retracement and recent swing highs. Conclusion and Consideration: The AUD/USD pair on the H4 timeframe is showing mixed signals, with bearish momentum indicated by the Parabolic SAR and MACD, while a rebound from key Fibonacci support suggests buyers are still active. Traders should closely watch the 0.6480 support level, as a break below could extend losses toward 0.6440, while a sustained move above 0.6550 would shift momentum back to the bulls. Given todays fundamental drivers, including speeches from Federal Reserve and RBA officials as well as major US data releases, heightened volatility in AUD/USD is expected. Traders should exercise caution and manage risk carefully, as both currencies may react sharply to monetary policy signals. Disclaimer: The analysis provided for AUD/USD is for informational purposes only and does not constitute investment advice. Traders are encouraged to perform their own analysis and research before making any trading decisions on AUDUSD. Market conditions can change quickly, so staying informed with the latest data is essential. FXGlory 09.03.2025
|
|
#466
04-09-2025, 06:18
|
||||
|
||||
|
EURUSD H4 Technical and Fundamental Analysis for 09.04.2025
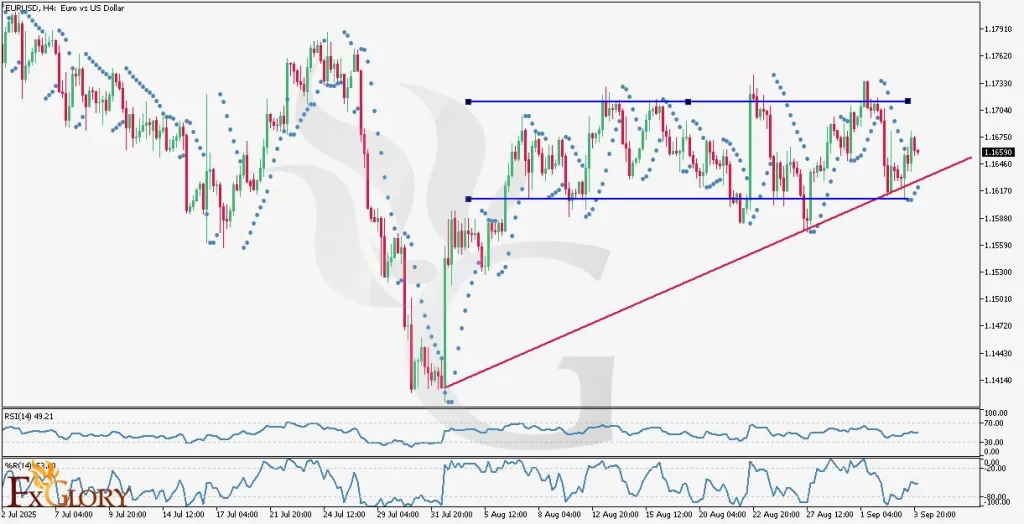 Time Zone: GMT +3 Time Frame: 4 Hours (H4) Fundamental Analysis The EUR/USD currency pair faces potential volatility today driven by key economic data releases. Eurozone retail sales data will provide insights into consumer spending strength, reflecting overall economic health. Positive retail sales, exceeding forecasts, could bolster the EUR. Simultaneously, the USD faces volatility from multiple critical announcements, including ADP employment change, Challenger job cuts, and initial jobless claims data. Better-than-expected employment figures and reduced jobless claims could strengthen the USD, introducing volatility and potential fluctuations in EURUSD. Price Action EURUSD's H4 price action indicates a long-term bullish trend despite recent sideways consolidation. Recently, candlesticks formed lower lows but have consistently rebounded from the ascending trendline support, suggesting renewed bullish momentum. If bulls maintain control, prices could target the resistance level around 1.17290, the previous high. Conversely, if bearish momentum emerges, the price may retest support at approximately 1.16390. Key Technical Indicators Parabolic SAR: The dots are currently positioned below the candlesticks, supporting continued bullish momentum. This alignment suggests the potential for upward price movements. RSI (Relative Strength Index): RSI is hovering around the 49.21 mark, reflecting market neutrality and indecision. A sustained move above this level could indicate strengthening bullish sentiment. Williams %R: This indicator is hovering around -53.16, indicating market equilibrium. A decisive upward movement could confirm the continuation of bullish price momentum. Support and Resistance Support: Immediate support is evident near 1.16390, aligned with the ascending trendline. Resistance: The nearest resistance level is around 1.17290, the recent high-level point. Conclusion and Consideration EURUSDs H4 analysis demonstrates sustained bullish momentum reinforced by technical indicators such as Parabolic SAR, RSI, and Williams %R. Given the potential volatility from Eurozone and U.S. economic data releases today, traders should remain vigilant. Confirmation of bullish sentiment above the current consolidation range could provide clear signals for trading opportunities. Disclaimer: The analysis provided for EUR/USD is for informational purposes only and does not constitute investment advice. Traders are encouraged to perform their own analysis and research before making any trading decisions on EURUSD. Market conditions can change quickly, so staying informed with the latest data is essential. FXGlory 09.04.2025
|
|
#467
05-09-2025, 01:44
|
||||
|
||||
|
USDCHF H4 Technical and Fundamental Analysis for 09.05.2025
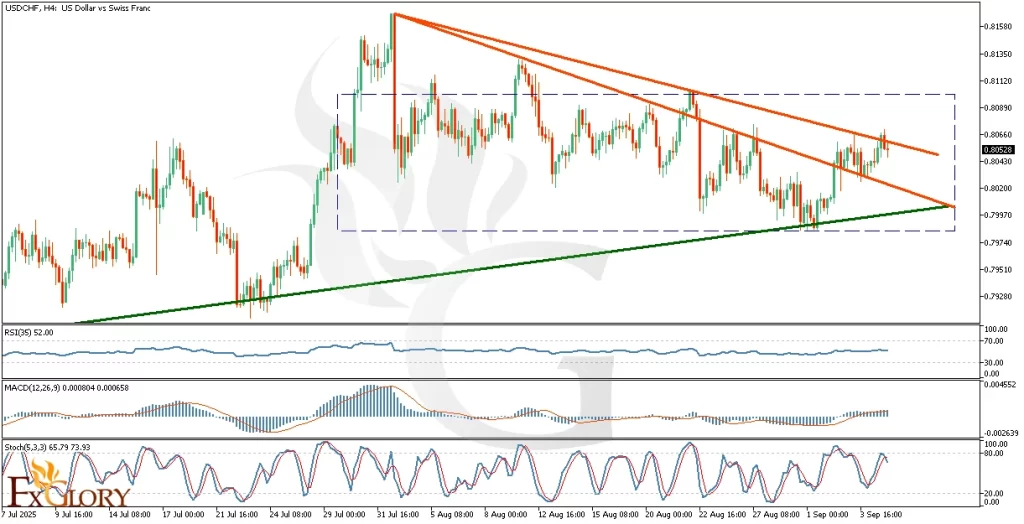 Time Zone: GMT +3 Time Frame: 4 Hours (H4) Fundamental Analysis: The USDCHF currency pair today faces significant fundamental factors from both currencies. The USD is influenced by Federal Reserve Bank of Chicago President Austan Goolsbees speech at mHUBs Industry Disruptor Series, expected to hint at future monetary policies. Additionally, key economic indicators like Non-Farm Payrolls, Unemployment Rate, and changes in labor costs could generate substantial volatility, particularly if actual figures deviate from forecasts. For CHF, traders will closely monitor Switzerlands foreign currency reserves data from the Swiss National Bank (SNB), alongside consumer sentiment released by SECO, providing insight into Switzerland's economic strength and central bank policy adjustments. Price Action: USD-CHF on the H4 chart currently exhibits sideways price movement within a well-defined rectangle pattern. After a recent bounce from the channel's lower support line, prices are now testing a descending resistance line. This technical scenario, combined with divergence observed in recent downtrend movements, suggests weakening bearish momentum, potentially setting the stage for bullish action targeting the channels upper boundary and subsequently the upper band of the rectangular consolidation range. Key Technical Indicators: RSI (35): The Relative Strength Index stands at 52, indicating neutral market sentiment. Currently, there's no immediate overbought or oversold condition, providing room for price to move upwards towards resistance levels. MACD (12,26,9): MACD is at 0.000804, slightly above its signal line at 0.000658. This crossover signals a mildly bullish momentum which supports a potential rise towards upper resistance. Stochastic Oscillator (5,3,3): Stochastic is at 65.8 and 73.9, reflecting bullish sentiment but approaching overbought territory. Traders should cautiously watch for potential short-term pullbacks once overbought levels are reached. Support and Resistance: Support: Immediate support is found at the lower trend line at approximately 0.7997. A break below this could lead prices towards deeper support near 0.7970. Resistance: Current resistance lies at the descending trend line around 0.8060, with significant resistance at the upper rectangle boundary around 0.8090. Conclusion and Consideration: The USD/CHF technical and fundamental analysis on the H4 chart shows a sideways movement with potential bullish tendencies supported by RSI, MACD, and Stochastic indicators. Given todays substantial fundamental data releases for both USD and CHF, heightened volatility is expected. Traders are advised to manage risk carefully, paying close attention to breakout confirmations above resistance levels or breakdowns below support levels. Disclaimer: The analysis provided for USD/CHF is for informational purposes only and does not constitute investment advice. Traders are encouraged to perform their own analysis and research before making any trading decisions on USDCHF. Market conditions can change quickly, so staying informed with the latest data is essential. FXGlory 09.05.2025
|
|
#468
10-09-2025, 06:04
|
||||
|
||||
|
BTCUSD H4 Technical and Fundamental Analysis for 09.10.2025
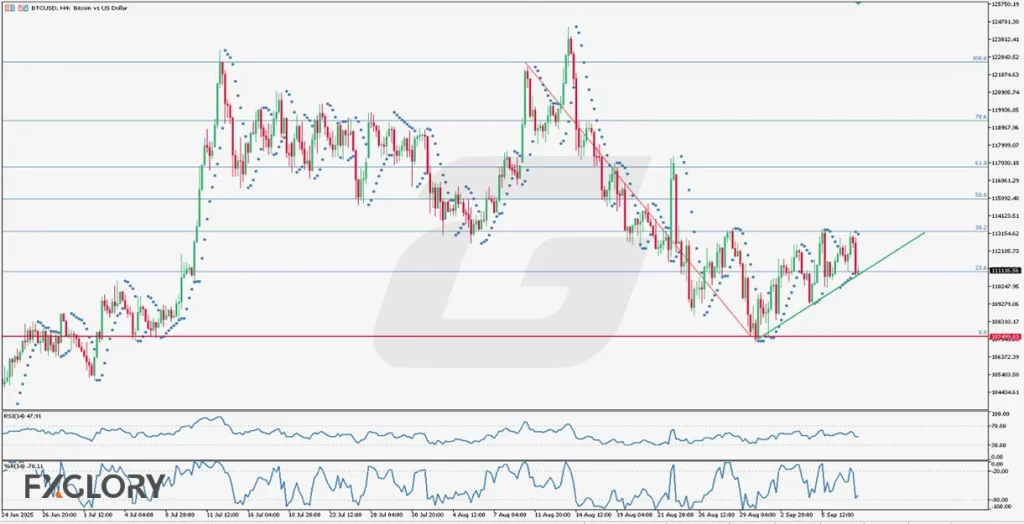 Time Zone: GMT +3 Time Frame: 4 Hours (H4) Fundamental Analysis: Bitcoin (BTC) against the US Dollar (USD) remains highly sensitive to global macroeconomic news and upcoming US data releases. Today, traders will be watching the US API Weekly Statistical Bulletin along with upcoming EIA crude oil inventories and wholesale inventories reports, which can influence USD liquidity and risk sentiment. Additionally, the Producer Price Index (PPI) scheduled for release in October remains a key inflation measure, affecting Federal Reserve policy expectations. Given the strong correlation between USD strength and Bitcoins volatility, any deviation from forecasts in these indicators could lead to sharp intraday price movements. Price Action: After recording a new all-time high at 124,508 USD on August 14th, BTC/USD entered a corrective downtrend, touching the 0% Fibonacci retracement at 107,250 USD. Since then, the pair has rebounded and broken above the 23.6% retracement level, before testing resistance at the 38.2% Fibonacci zone near 113,400 USD. However, price failed twice to break above this level, pulling back towards 23.6%. A new ascending trendline has formed, showing a gradual bullish recovery with the latest candle bouncing off support. Traders should closely monitor whether Bitcoin can sustain above the trendline and attempt another retest of the 38.2% retracement level. Key Technical Indicators: Parabolic SAR: The last two Parabolic SAR dots appeared above the candles, signaling ongoing bearish pressure. A new SAR dot forming below the candles would be an early confirmation of a potential bullish continuation in BTC/USD on the H4 timeframe. RSI (14): The Relative Strength Index is currently at 47.91, indicating a neutral zone slightly below the 50 level. This suggests that BTC/USD is neither overbought nor oversold, and momentum remains balanced but fragile. Williams %R (14): Currently at -70.11, the Williams %R suggests that Bitcoin is leaning towards oversold conditions but not yet fully extended. This could indicate a potential bounce if buyers defend the trendline and 23.6% Fibonacci support. Support and Resistance: Support: Key support rests near 110,300 USD, aligned with the 23.6% Fibonacci level and ascending trendline. Resistance: Immediate resistance is at 113,400 USD, the 38.2% Fibonacci retracement zone, followed by stronger resistance at 115,600 USD. Conclusion and Consideration: The BTC/USD H4 technical analysis suggests that Bitcoin is currently consolidating between the 23.6% and 38.2% Fibonacci retracement levels after rebounding from its local low at 107,250 USD. The neutral RSI, oversold Williams %R, and Parabolic SAR positioning highlight indecision, but the ascending trendline supports a short-term bullish bias. Traders should monitor whether Bitcoin can sustain above the 110,300 USD support to retest 113,400 USD resistance. A breakout above this level could extend gains towards 115,600 USD, while a break below the trendline may trigger another downside test near 107,250 USD. Disclaimer: The analysis provided for BTC/USD is for informational purposes only and does not constitute investment advice. Traders are encouraged to perform their own analysis and research before making any trading decisions on BTCUSD. Market conditions can change quickly, so staying informed with the latest data is essential. FXGlory 09.10.2025
|
|
#469
11-09-2025, 08:26
|
||||
|
||||
|
EURUSD H4 Technical and Fundamental Analysis for 09.11.2025
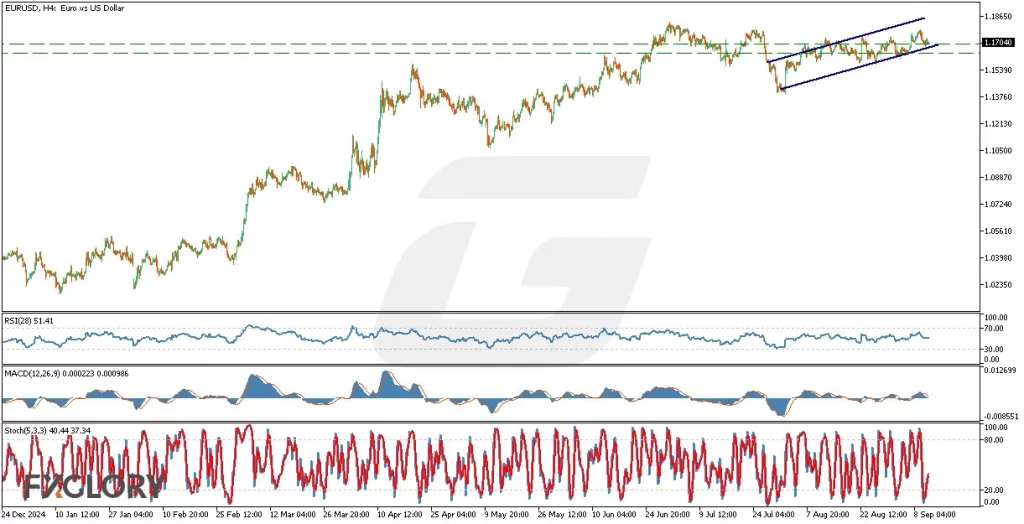 Time Zone: GMT +3 Time Frame: 4 Hours (H4) Fundamental Analysis: Today, significant volatility may influence the EUR/USD pair due to multiple economic releases. For the USD, traders await crucial CPI (Consumer Price Index) data excluding food and energy from the Bureau of Labor Statistics. Higher-than-expected inflation typically strengthens the USD, leading markets to anticipate tighter monetary policy from the Federal Reserve. Additionally, initial jobless claims and natural gas storage data could further affect USD strength. Conversely, the EUR faces potential volatility from the European Central Bank's (ECB) upcoming announcements, including the interest rate decision and the subsequent press conference, where any hawkish stance could bolster the Euro. Price Action: EUR-USD analysis on the H4 timeframe indicates a bullish trend with current prices encountering significant resistance from a historical zone dating back to early 2023. Recently, price action showed indecision marked by Doji and Pin bar candlesticks, suggesting a potential reversal from current levels. However, the price is presently supported strongly by this historical zone, indicating that if the bullish sentiment prevails, the next logical target is the upper boundary of the existing ascending channel. Key Technical Indicators: RSI (28): The Relative Strength Index (RSI) is currently at 51.41, reflecting neutral market conditions. This suggests that the pair has significant room for movement in either direction before reaching overbought or oversold conditions, supporting potential bullish continuation. MACD (12,26,9): The MACD histogram shows a positive value (0.000223) with the MACD line above the signal line (0.000986), indicating bullish momentum. However, the small magnitude implies caution, as bullish strength may not be very robust. Stochastic (5,3,3): The Stochastic indicator, with current readings at 40.44 and 37.34, recently experienced a cross under the 20-level, signaling a previous oversold scenario that might lead to renewed bullish interest if momentum continues upward. Support and Resistance: Support: Immediate support is noted clearly at 1.15930, aligning with historical significance and recent consolidation. Resistance: Key resistance stands at 1.18650, coinciding with the upper boundary of the ascending channel and previous swing highs, making it a significant upside target. Conclusion and Consideration: EUR/USD on the H4 chart shows ongoing bullish sentiment underpinned by historical support and key technical indicators such as RSI, MACD, and Stochastic. Traders should closely monitor the upcoming US CPI data and ECB's interest rate decision for potential triggers of significant market moves. Caution is advised due to recent price indecision indicated by Doji and Pin bar formations, suggesting a potential reversal or increased volatility. Always employ proper risk management strategies. Disclaimer: The analysis provided for EUR/USD is for informational purposes only and does not constitute investment advice. Traders are encouraged to perform their own analysis and research before making any trading decisions on EURUSD. Market conditions can change quickly, so staying informed with the latest data is essential. FXGlory 09.11.2025
|
|
#470
12-09-2025, 01:42
|
||||
|
||||
|
GBPUSD H4 Technical and Fundamental Analysis for 09.12.2025
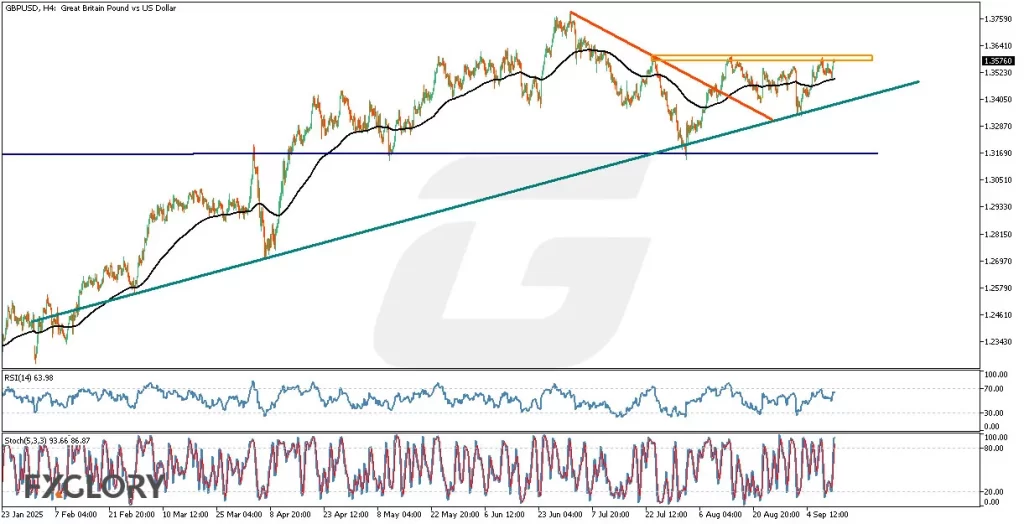 Time Zone: GMT +3 Time Frame: 4 Hours (H4) Fundamental Analysis: The GBP-USD pair today faces significant volatility potential stemming from major economic releases. From the UK, traders eagerly await key data from the Office for National Statistics, including Gross Domestic Product (GDP), Construction Output, Trade Balance, Gross Value Added (GVA), and both Industrial and Manufacturing Production figures. Positive readings compared to forecasts can significantly strengthen GBP, indicating robust economic health and potentially increasing bullish momentum. Conversely, the US Dollar (USD) eyes the University of Michigan's consumer sentiment and inflation expectation reports. Stronger-than-expected data could boost USD, exerting bearish pressure on GBP/USD. Price Action: The GBPUSD pair on the H4 timeframe exhibits a classic ascending triangle formation, indicative of bullish pressure. Price action has repeatedly tested the clearly defined horizontal resistance (supply zone) around 1.2576 (orange zone). Concurrently, the pair demonstrates consistently rising higher lows along the ascending teal trendline. The previous downtrend (red line) has been decisively broken, suggesting a bullish shift. Traders should closely monitor a confirmed breakout via a solid H4 close above resistance or below rising support to identify directional bias. Key Technical Indicators: EMA (90): The EMA (90) has consistently supported GBPUSD's price, reinforcing bullish sentiment. It currently acts as dynamic support, underpinning recent higher lows and guiding price upward. RSI (14): At 64, the RSI indicator on GBPUSD indicates solid bullish momentum without entering overbought territory. This signals room for further upside potential before exhaustion sets in, supporting bullish continuation. Stoch (5,3,3): The Stochastic Oscillator registers values of 94 and 87, suggesting immediate short-term overbought conditions. This indicates caution for potential short-term corrections, despite broader bullish momentum. Support and Resistance: Support: Immediate support lies along the ascending trendline around 1.2480. Secondary support is significantly lower, near the prior demand zone and breakout base at approximately 1.2300. Resistance: Immediate resistance is established at the flat supply zone around 1.2576. A decisive break above this level opens potential bullish targets near 1.2700-1.2750 based on measured moves. Conclusion and Consideration: The GBP-USD pair's current H4 analysis signals bullish potential supported by ascending triangle price action, reinforced by EMA (90), RSI, and Stochastic indicators. However, the overbought Stochastic signals potential short-term volatility and pullbacks. Upcoming key economic data releases from both GBP and USD can significantly influence market dynamics and catalyze the breakout direction. Traders should wait for a clear H4 candle close outside the triangle to confirm entry, using prudent stop-loss placements and volatility buffers to manage breakout risks effectively. Disclaimer: The analysis provided for GBP/USD is for informational purposes only and does not constitute investment advice. Traders are encouraged to perform their own analysis and research before making any trading decisions on GBPUSD. Market conditions can change quickly, so staying informed with the latest data is essential. FXGlory 09.12.2025
|
|
#471
15-09-2025, 00:15
|
||||
|
||||
|
XAGUSD H4 Technical and Fundamental Analysis for 09.15.2025
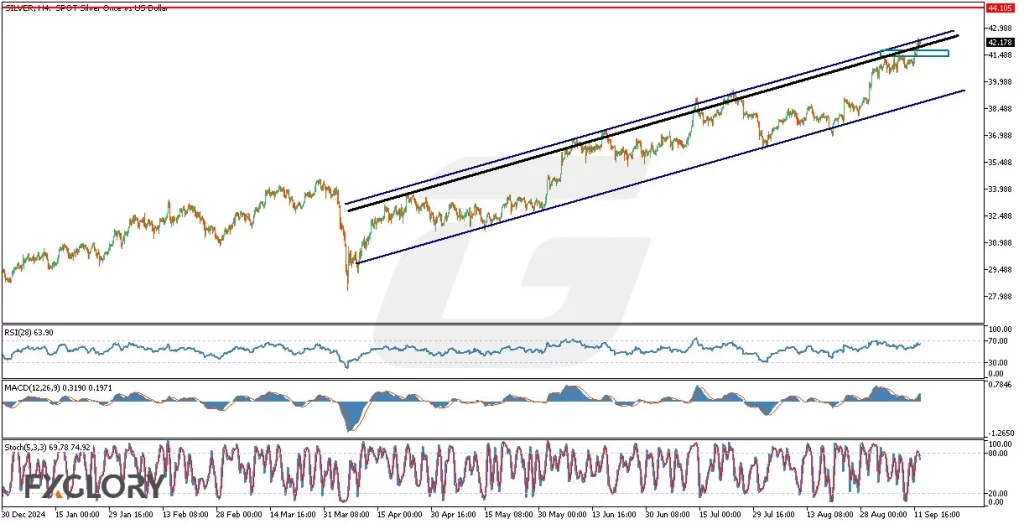 Time Zone: GMT +3 Time Frame: 4 Hours (H4) Fundamental Analysis: The XAGUSD (Silver/US Dollar) pair is influenced by today's significant economic event, the New York Manufacturing Index release from the Federal Reserve Bank of New York. Traders closely monitor this index as an important indicator of economic health in the U.S., where a higher-than-expected figure generally strengthens the USD, potentially adding pressure to commodities priced in USD, such as silver. Consequently, market volatility may increase around the time of this news release. Price Action: Analyzing the price action on the H4 timeframe, XAG/USD has been consistently trading within an ascending channel. Currently, the price is testing the upper boundary of the channel, displaying difficulty in breaking above this resistance. If the bulls fail to maintain momentum, a corrective move toward the lower support zone is likely. However, a decisive breakout above the upper channel boundary could extend the bullish move, potentially targeting around 44.200, a level unseen since 2011. Key Technical Indicators: RSI (28): The RSI is currently at 64, suggesting moderate bullish momentum. However, it remains below the overbought threshold (70), indicating potential room for further upward movement before encountering significant resistance. MACD (12,26,9): The MACD histogram is positive (0.32), positioned above the signal line (0.2), indicating prevailing bullish momentum. Traders should remain vigilant for signs of declining momentum, which could precede a correction. Stochastic Oscillator (5,3,3): Stochastic values are presently at 70 and 75, indicating the asset is nearing overbought territory. Traders should monitor this closely, as a stochastic cross below the 80 level could suggest an impending bearish reversal or correction. Support and Resistance: Support: Immediate support is located near the 41.200-41.500 area, which aligns with the lower boundary of the ascending channel and previous consolidation zones. Resistance: The critical resistance lies at the channels upper band around 42.200, followed by the key psychological target of 44.200 if bullish momentum persists. Conclusion and Consideration: XAG-USDs price action on the H4 chart indicates continued bullish sentiment within the ascending channel. However, key indicators such as RSI, MACD, and Stochastic hint at potential short-term exhaustion or correction. Traders should carefully watch for price reactions at current resistance levels and the forthcoming U.S. economic release. Due to potential volatility around the New York Manufacturing Index, prudent risk management and vigilance are advised. Disclaimer: The analysis provided for XAG/USD is for informational purposes only and does not constitute investment advice. Traders are encouraged to perform their own analysis and research before making any trading decisions on XAGUSD. Market conditions can change quickly, so staying informed with the latest data is essential. FXGlory 09.15.2025
|
|
#472
16-09-2025, 08:02
|
||||
|
||||
|
USDCAD H4 Technical and Fundamental Analysis for 09.16.2025
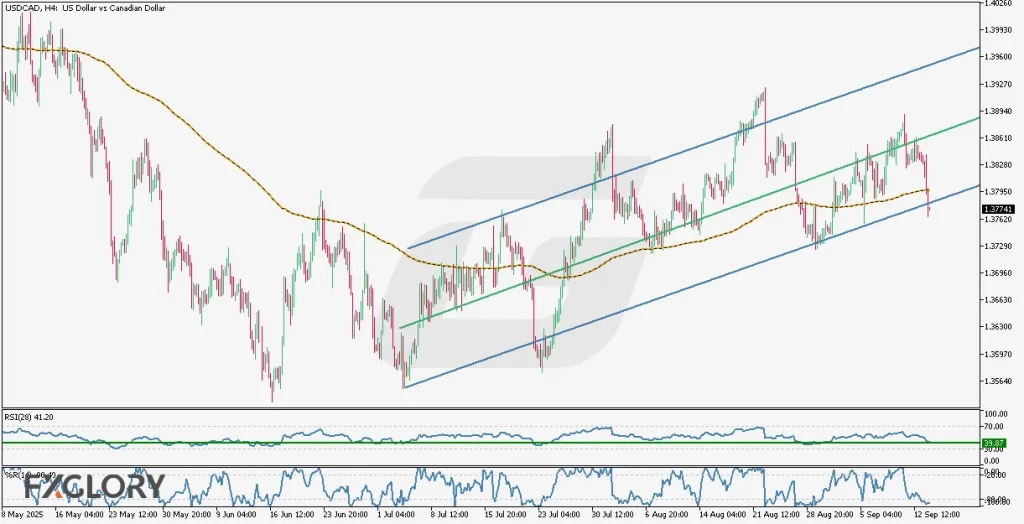 Time Zone: GMT +3 Time Frame: 4 Hours (H4) Fundamental Analysis The USD/CAD currency pair's volatility today will significantly depend on the scheduled economic releases. Key USD data such as Retail Sales Ex Autos, Import Price Index, Industrial Production, Capacity Utilization Rate, and NAHB Housing Market Index could considerably influence the pair. A stronger-than-expected result in these indicators could propel the US dollar higher against its Canadian counterpart. Conversely, Canada's economic data remains relatively quiet today, placing the focus squarely on USD-driven market dynamics. Price Action Analyzing USD/CAD on the H4 timeframe, after a period of bearish movement, price action transitioned into a bullish trend, forming a clear ascending channel. Price movements have predominantly reacted to the channel's midline, illustrating it as a significant level of dynamic support and resistance. Recently, price candles breached the channel's lower trend line; however, current momentum suggests this break might be short-lived. A bullish re-entry back into the channel is highly probable, targeting the midline resistance around the 1.3885 level. Key Technical Indicators RSI (28): The Relative Strength Index indicator stands at 41.20, indicating proximity to the crucial 39.87 level. Historically, reaching this RSI level has consistently triggered bullish reversals, reinforcing the probability of an upward price correction shortly. Williams %R: The Williams %R indicator currently sits around -90.69, indicating severely oversold conditions. Such levels generally precede bullish recoveries, aligning with the potential price reversal back within the bullish channel. Moving Average (200): Price candles are trading slightly below the 200-period moving average, signifying short-term bearishness. However, as candles frequently oscillate around this line, the current positioning might indicate an overshoot rather than a genuine bearish breakout. Support and Resistance Support: Immediate and strong support is visible at the recent breakout level near 1.3725, followed by further support at the lower boundary of the ascending channel. Resistance: The most immediate resistance is positioned at the channel's midline around 1.3885, with further resistance at the channel's upper boundary. Conclusion and Consideration The technical analysis of the USD/CAD pair indicates a likely bullish reversal from the current oversold conditions, as supported by RSI, Williams %R, and historical price action patterns. Traders should pay close attention to today's USD economic data releases, which may significantly influence price volatility. Given the currency pairs current dynamics, traders should be cautious and look for confirmations before taking bullish positions targeting the midline resistance at 1.3885. Disclaimer: The analysis provided for USD/CAD is for informational purposes only and does not constitute investment advice. Traders are encouraged to perform their own analysis and research before making any trading decisions on USDCAD. Market conditions can change quickly, so staying informed with the latest data is essential. FXGlory 09.16.2025
|
|
#473
17-09-2025, 00:27
|
||||
|
||||
|
EURGBP H4 Technical and Fundamental Analysis for 09.17.2025
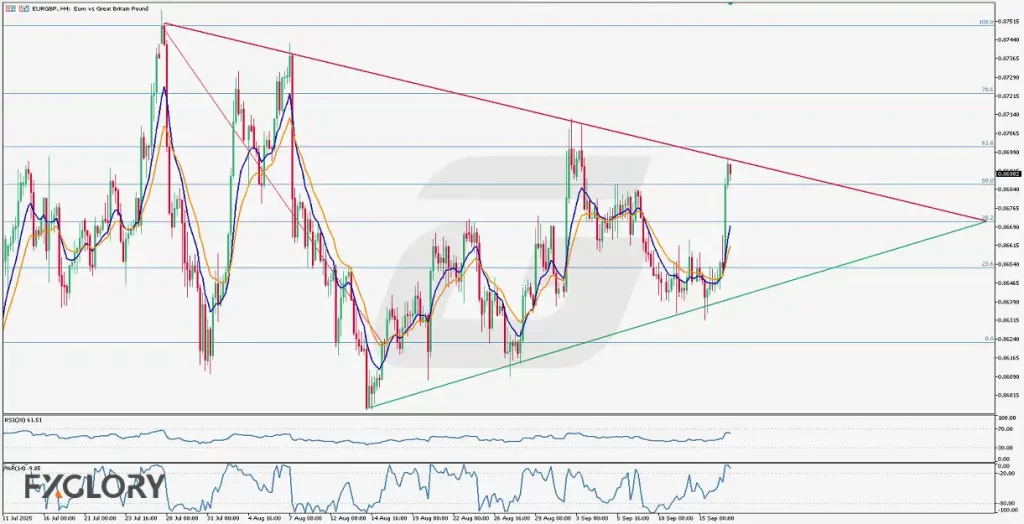 Time Zone: GMT +3 Time Frame: 4 Hours (H4) Fundamental Analysis: The EURGBP currency pair reflects the exchange rate between the Euro (EUR) and the British Pound (GBP). Today, the Euro is expected to face notable volatility with ECB President Christine Lagarde delivering opening remarks at the 10th Annual ECB Research Conference, alongside a speech from Bundesbank President Joachim Nagel. Both events could provide forward guidance on Eurozone monetary policy. Additionally, CPI data for the Eurozone remains a crucial focus as inflation pressures continue to influence ECB rate expectations. On the UK side, attention is on inflation-linked releases such as the Consumer Price Index (CPI), Core CPI, Retail Price Index (RPI), and Housing Price Index (HPI), all of which will provide important insights into the Bank of Englands policy path. Traders should anticipate sharp price movements in EURGBP due to overlapping high-impact events from both economies. Price Action: The EUR/GBP H4 chart shows that the pair has been consolidating within a large symmetrical triangle pattern for nearly two months, with multiple tests of both bullish and bearish long-term trendlines. Recently, the price surged with two strong bullish candles but reversed into a red candle after touching the long-term descending bearish trendline between the 50.0% and 61.8% Fibonacci retracement levels, halting further bullish extension. This highlights the significance of the triangle structure as a battle zone between bulls and bears. The price has tested both trendlines at least three times without a breakout, and the apex of the triangle aligns near the 38.2% Fibonacci level, suggesting a decisive breakout may occur soon. Key Technical Indicators: Moving Averages (MA 9 and MA 17): The short-term moving average (MA 9 blue) has crossed above the long-term moving average (MA 17 orange), signaling short-term bullish momentum. Both averages are sloping upward, supporting the possibility of continued bullish attempts unless rejected strongly at resistance. Relative Strength Index (RSI): The RSI is currently at 61.51, leaning toward bullish territory but not yet overbought. This indicates that while momentum is on the upside, the pair still has room for further gains before hitting extreme levels. Williams %R (14): The Williams %R indicator stands at -9.85, placing it in overbought territory. This suggests that despite bullish momentum, a near-term pullback or consolidation is likely as the market has already priced in strong buying pressure. Support and Resistance: Support: Strong support lies at 0.8654, where the bullish trendline and the 23.6% Fibonacci level converge, offering a solid base for buyers. Resistance: Key resistance is positioned at 0.8696, corresponding to the long-term descending bearish trendline and just below the 61.8% Fibonacci retracement. Conclusion and Consideration: The EUR-GBP H4 technical analysis highlights a pair locked within a tightening triangle structure, with both bulls and bears defending critical Fibonacci levels. Short-term indicators such as the MA crossover support bullish continuation, while the Williams %R warns of possible consolidation or correction. Given todays high-impact ECB speeches and Eurozone CPI outlook, as well as upcoming UK inflation figures, traders should remain cautious for breakout opportunities near the triangle apex around 38.2% Fib. The price action suggests that whichever side breaks first will likely define the medium-term trend for EUR GBP. Disclaimer: The analysis provided for EUR/GBP is for informational purposes only and does not constitute investment advice. Traders are encouraged to perform their own analysis and research before making any trading decisions on EURGBP. Market conditions can change quickly, so staying informed with the latest data is essential. FXGlory 09.17.2025
|
|
#474
18-09-2025, 04:59
|
||||
|
||||
|
AUDUSD H4 Technical and Fundamental Analysis for 09.18.2025
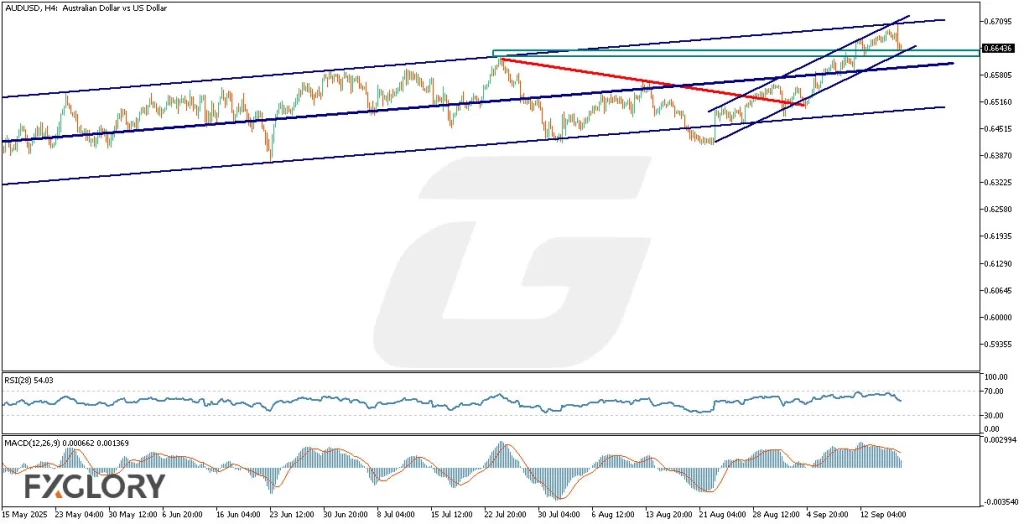 Time Zone: GMT +3 Time Frame: 4 Hours (H4) Fundamental Analysis: The AUD/USD currency pair today is anticipated to exhibit significant volatility due to crucial economic data releases from both Australia and the US. The Australian Bureau of Statistics is set to release employment data, which significantly impacts the Australian Dollar (AUD). Positive employment figures exceeding forecasts would strengthen AUD as employment growth directly correlates with higher consumer spending and economic confidence. Concurrently, the USD may experience volatility due to the release of initial jobless claims and Philadelphia Fed Manufacturing Index. Lower-than-expected jobless claims and higher manufacturing index figures would enhance USD strength. Price Action: Technical analysis of AUDUSD on the H4 timeframe indicates a bullish sentiment within an ascending channel, with price currently testing the upper boundary. Additionally, price action reveals a smaller ascending channel formation indicating short-term bullish strength. Currently, AUD-USD has encountered resistance at the previous high area, which may now act as a crucial support zone. The recent formation of three consecutive bearish candles, resembling a "Three Black Crows" pattern, signals potential short-term bearish correction toward the midpoint of the larger ascending channel, before a possible bullish resumption. Key Technical Indicators: RSI (28): The RSI indicator at 54 suggests neutral momentum. The current RSI level implies that AUDUSD has ample room for price movements in either direction without immediate overbought or oversold conditions. This aligns with the possibility of corrective moves towards channel midpoint support before resuming an upward trajectory. MACD (12,26,9): MACD readings currently stand at 0.000662 (MACD line) and 0.001369 (signal line), indicating slight bearish momentum due to the MACD line being below the signal line. This condition points towards potential short-term bearishness or a corrective pullback within the ongoing bullish channel. Support and Resistance: Support: Immediate key support is found at the recent high zone, approximately at 0.7420, which coincides with the midpoint of the larger ascending channel. Additional support is visible near 0.7380, the lower boundary of the smaller channel. Resistance: Current resistance lies around the top boundary of the ascending channel at approximately 0.7485, with further resistance anticipated near psychological level 0.7500. Conclusion and Consideration: Technical indicators and price action analysis for AUD-USD on the H4 chart suggest a potential short-term corrective move downwards, aligning with RSI neutrality and MACD bearish signals. However, the broader bullish channel remains intact, suggesting eventual bullish continuation towards the channel's upper boundaries. Traders must closely monitor today's economic news releases from Australia and the US, as these fundamental factors may significantly impact market volatility and direction. Disclaimer: The analysis provided for AUD/USD is for informational purposes only and does not constitute investment advice. Traders are encouraged to perform their own analysis and research before making any trading decisions on AUDUSD. Market conditions can change quickly, so staying informed with the latest data is essential. FXGlory 09.18.2025
|
|
#475
Yesterday, 07:26
|
||||
|
||||
|
BTCUSD H4 Technical and Fundamental Analysis for 10.08.2025
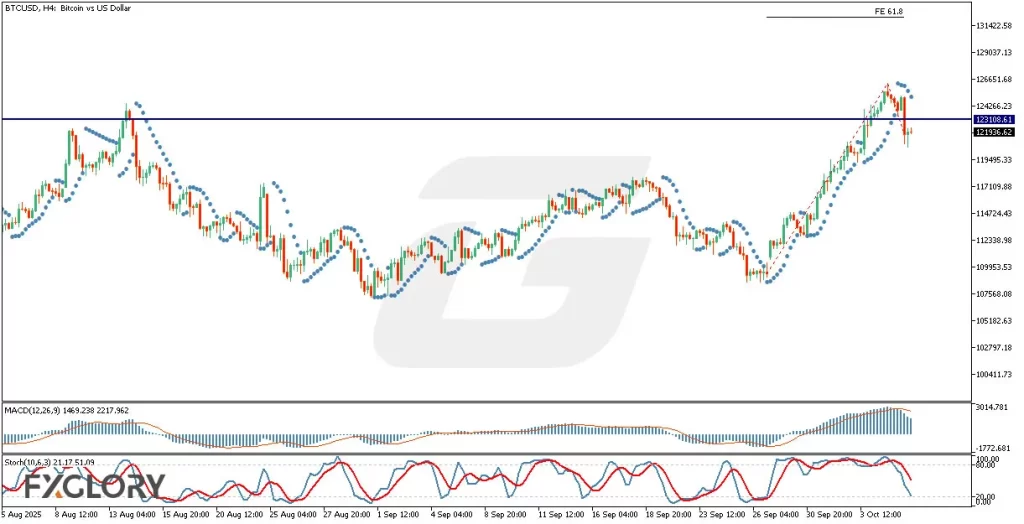 Time Zone: GMT +3 Time Frame: 4 Hours (H4) Fundamental Analysis The BTCUSD pair currently demonstrates sensitivity to ongoing financial market conditions. Today, substantial volatility might be expected given the scheduled speeches from several Federal Reserve officials, including Federal Reserve Bank Presidents Alberto Musalem, Austan Goolsbee, Lorie Logan, and Neel Kashkari, alongside Governor Michael Barr. Their statements often provide critical insights into the US monetary policy direction, directly influencing investor sentiment and, consequently, risk assets such as Bitcoin. Traders will closely monitor these speeches for hawkish or dovish signals, significantly impacting BTCUSD price movements. Price Action BTCUSD price action analysis in the H4 timeframe indicates a pronounced bullish movement, recently completing a sharp upward trajectory toward the key resistance zone around level 123108.61. Previously, the candles struggled and failed to break this significant price zone. However, the recent retracement below this level may be temporary, as the robust bullish sentiment from the preceding candles signals potential upward momentum. Should the price decisively break above the resistance at 123108.61, the Fibonacci expansion level 61.8 could serve as the next target. Key Technical Indicators MACD: The MACD histogram currently registers a level of 1469.238, while the signal line remains at 2217.962. This divergence suggests diminishing bullish momentum and cautions traders of potential short-term corrective movements, yet overall bullish bias remains intact. A bullish crossover above the signal line could reaffirm the bullish trend. Stochastic Oscillator: The Stochastic indicator demonstrates the K% line at 21.17 and the D% line at 51.09, indicating an oversold scenario in the short term. Given these levels, traders may anticipate a potential bullish reversal soon, reinforcing the possibility of price recovery and another bullish attempt. Parabolic SAR: The Parabolic SAR dots are positioned above the candles, highlighting short-term bearish pressure. However, considering the preceding bullish strength, the bearish move may be limited, and traders should watch for the dots shifting below the candles to confirm renewed bullish momentum. Support and Resistance Support: Immediate technical support is visible around the psychological level of 121396.62, aligning with recent pullback lows. Resistance: The primary resistance remains firmly set at 123108.61, a critical pivot point where the previous bullish advances faced rejection. Conclusion and Consideration Technical indicators and recent price action in BTCUSD on the H4 chart suggest a cautiously bullish outlook. While short-term corrective pressure persists, especially as indicated by MACD and Parabolic SAR, stochastic conditions and recent bullish dominance imply the potential for a renewed upward move. Traders must remain alert to the upcoming Federal Reserve speeches, which could significantly impact market volatility and investor sentiment. Adjustments in risk management strategies are recommended during these high-impact news events. Disclaimer: The analysis provided for BTC/USD is for informational purposes only and does not constitute investment advice. Traders are encouraged to perform their own analysis and research before making any trading decisions on BTCUSD. Market conditions can change quickly, so staying informed with the latest data is essential. FXGlory 10.08.2025
|
|
|
|
 Similar Threads
|
||||
| Thread | Thread Starter | Forum | Replies | Last Post |
| [Sharing] Forex Technical Analysis | fxinvestindo | Forex Analysis | 8 | 07-02-2013 05:12 |
| Daily Technical Analysis for Majors | FxTT | Forex Analysis | 0 | 01-03-2012 06:50 |
| Technical analysis of FXCBS | fxcbsar | Trading Journals | 78 | 04-05-2010 09:41 |
| IGTFX technical analysis | igtfxnews | Trading Journals | 25 | 14-04-2010 11:26 |
| FX SCHOOL (4i) : What is Technical Analysis? | ForexLasers | Forex School & Education | 0 | 14-08-2009 04:14 |


