GOLD: RESULTS OF 2013 AND A FORECAST FOR 2014
GOLD MARKET REVIEW
By Analyst: Yuriy Maevskiy
2014 is here, which means that the trading results of 2013 for the precious metals market, and Gold in particular, can be summed up.
2013 appeared to be the worst in the last 30 years: Gold lost over 30% of its value. At the time this article was written, a troy ounce of Gold cost 1220 US Dollars.
A large-scale decrease of Golds prices triggered a massive outflow of investors from ETFs that are mostly investing in physical metal. ETFs have decreased their stock by more than 700 tons, and losses have exceeded 73 billion Dollars.
Experts link the decrease of Golds prices with the cut of the QE3 program by the US FED. It was decided on the last FED meeting on December the 18, 2013, that asset buyout would be decreased by 10 billion Dollars, i.e. to $75 B. Improvement of the US economy, a decrease of the unemployment to 7%, and slow inflation allowed FED to cut QE3 at the end of the year.
According to most analysts, low inflation is the main reason of Golds price decrease. Gold was always used as a store of value during inflation or hyperinflation periods. If there is no inflation, then there is no need to use Gold as a protective asset.
FED has been printing Dollars for a few years now, which increases the stock of money, but inflation stays within 2%, according to the US state bodies. However, methods of inflation, GDP, and unemployment calculation were changed quite a few times in the US in the last 30 years in order to get correct numbers. Mr. John Williams, a famous economist, provides more realistic data on his website than the numbers presented by state officials. According to Mr. Williams, CPI stayed above 4% for a long time now, which is much higher than the numbers used by the FED (1-2%).
The real economy doesnt see a spurt of inflation, but the virtual economy shows that supply of surplus funds has led to the growth of financial assets, such as stocks and bonds. Luxury property and goods are in high demand all over the world.
The worlds financial elite heavily depend on the inflow by the Central Banks that conduct soft monetary policy by printing new money that is not secured by anything. Increase of the money stock leads to the appearance of bubbles on the markets and inflation growth, and Gold can become a secure asset and a so-called Safe Haven for the investors and common people.
However, the US FED decreases the value of Gold on purpose, so it cannot replace paper money that is not secured by anything.
The decrease of Golds price from April 12 to April 16, 2013 was very notable. Market participants conducted a short sale of Gold contracts with the total volume exceeding annual ore output by 12%, which caused the price to plummet by 200 US Dollars in 3 days.
Recently, an investigation about the manipulation of Gold and Silver prices was initiated. Deutsche Bank, one of the largest world banks, is in the limelight. Deutsche Bank is a member of the London Gold Market Fixing; Scotia Mocatta, HSBC, Societe Generale and Barclays Capital are also members of the Gold Market Fixing. Results of the fixing are reflected in the worlds supply price of physical Gold, and are used as an example for most of these contracts.
While stock funds were decreasing their positions, the Worlds Central Banks were increasing stock of physical Gold. According to the data by IMF, various Central Banks bought over 884 tons of Gold in 2013. A decrease in the price of Gold didnt scare off investors, but attracted major importers, such as China and India.
China, which has gold and foreign -exchange reserves worth 3500 B Dollars, keeps increasing its Gold stock. It imported over 1000 tons over a 10-month period in 2013, and over 2300 tons since 2011. As Golds price becomes lower, more Gold is purchased by China.
India keeps up with China in terms of import of physical Gold. According to analysts estimations, India imported around 1000 tons in 2013. The import of Gold caused deterioration of the trade balance, and authorities introduced a 10% import tax for Gold and 15% import tax for Golden jewelry. However, new taxes didnt help change the situation, and Gold found its way to the Indian market, this time illegally. According to the authorities, gold trafficking increased 7 times and left drug-trafficking trailing far behind.
Demand for physical Gold was expressed not only by Central Banks, but also by common people. American Eagle Gold coin sales set new records: 629 000 ounces of Gold were sold in the first half of 2013 (compared to only 344 500 ounces in 2012). Sales of the American Buffalo coins have almost doubled. Over 232 000 ounces were sold since the beginning of 2013, which is higher than 2012s number by 132 000 ounces.
People were also buying Golden jewelry. Demand has increased not only in China and India, but also in Middle Eastern countries. In Saudi Arabia and the UAE, demand for jewelry has increased by 25% compared to the previous year (which ended on September 31), and got to 225,8 tons. The worlds average increase is 20%.
FORECAST FOR 2014
I believe that Golds prices will be going up in 2014 and will reach $1560 by the end of the year.
Golds price can be corrected, and $1180-$1130 can become new sales targets. Certain factors have allowed me to assume that Gold has every chance to grow this year, these factors being:
1. The correlation between supply and demand.
2013 showed that the decrease of Golds price didnt scare off investors but attracted major importers of the physical metal, and included not only the metal itself, but also coins and jewelry.
However, the worlds gold-workers cannot keep up with the increasing demand for their product. Rapid decrease of prices in the II quarter of 2013 forced companies to close wasteful production, and caused downward revision of the 2014 mining plans.Gold is still very rare and the decrease of mining combined with a higher demand could drive growth of the price in upcoming years.
2. Uncertainty with the US national debt.
US congress increased the debt ceiling in October 2013 after many debates and the government temporary shutdown. There were 78 revisions of the state debt limits since 1960. 2 years ago, the debt limit and the US government debt itself became higher than 100% of the GDP. At the moment, the relative level of the US debt is at 106% of GDP, and state debt has crossed the mark of 17 trillion Dollars and keeps growing.
Meanwhile, state debt is just the tip of the iceberg. There is also joint debt, which consists of:
1) Government debt;
2) State debt;
3) Local debt;
4) Personal debt;
5) Business debt
6) Financial sectors debt.
Information about the US joint debt is officially published in each quarter by the Federal Reserve System. According to the data published in the middle of 2013, US joint debt is equal to 41.04 trillion Dollars. The total size of the US joint debt is 2.4 times higher than the government US debt. According to the US FED, joint debt is higher than 250% of the GDP.
It is obvious that this debt cannot be paid in the near future, which means that there are just a few ways to resolve this situation: default of hyperinflation, i.e. depreciation of the Dollars value, and debt obligations. In both cases, it leads to an increase of the demand for Gold, which can be used as a protective asset.
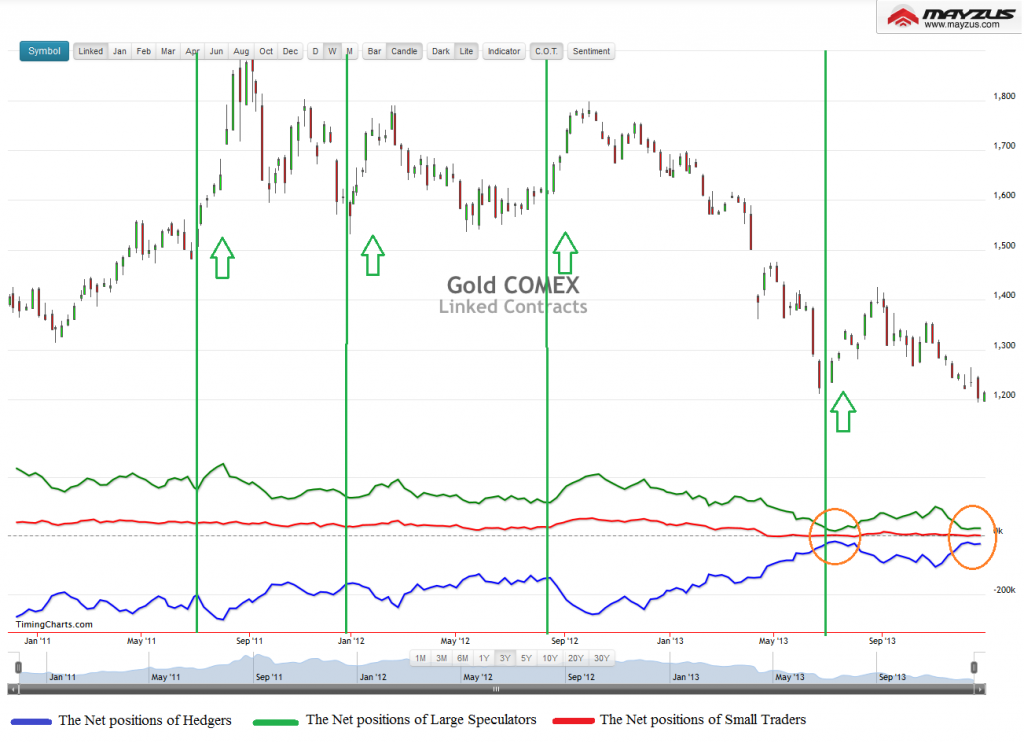
3. U.S Commodity Futures Trading Commission reports (COMMITMENTS OF TRADERS) also show bullish signals for the Gold market.
Hedgers joint position (blue) has been on the maximum for many months, which means an increase in the price of Gold in the near future. At the same time, a joint position of the major speculators (green) has been on the minimum for many months, which is also a positive sign for Gold.
Copyright: MAYZUS Investment Company Ltd
Make profit in Forex with MAYZUS.COM http://www.MAYZUS.com