Forex Forums | ForexLasers.com |
|
|||||||
 |
|
|
LinkBack | Thread Tools | Search this Thread |
|
#361
 04-02-2019, 10:56
|
||||
|
||||
|
AUD/USD: RBA will keep current interest rate. Trading scenarios
04/02/2019 The US dollar is trading higher on Monday, and the DXY dollar index futures at the beginning of the European session is at 95.46, 12 points higher than the opening price of the trading day. As reported last Friday by the US Department of Labor, the number of non-agricultural jobs increased by 304,000 in January, while the average hourly wage in the private sector increased by 3.2% from the previous year. The forecast was +170,000 jobs. Despite the fact that unemployment rose to 4% from 3.9%, it still remains at its lowest level in the last 10 years. Investors considered the report to be generally positive, which gave the US dollar an impetus for further growth. At the same time, the AUD / USD is falling from the opening of the trading day on Monday and at the beginning of the European trading session, trading near the 0.7230 mark. On Tuesday, the attention of traders will be directed to the publication at 03:30 (GMT) of the decision on the RBA interest rate. It is expected that the central bank of Australia will leave its key interest rate unchanged, at a record low of 1.5%. Market participants will closely monitor the rhetoric of the RBA's accompanying statement. The fall in housing prices, the slowdown in consumer spending, weak wage growth, the trade conflict between the United States and China, and the uncertain prospects for the global economy have become factors in the slowdown in GDP growth in 2019. Any concerns of the RBA leadership regarding the growth of the country's economy can be considered by investors as a signal to resume sales of the Australian dollar. *)An advanced fundamental analysis is available on the Tifia Forex Broker website at tifia.com/analytics Meanwhile, AUD / USD is declining, attempting to consolidate below the support level of 0.7245 (EMA144 on the daily chart). In the event of a breakdown of short-term support levels of 0.7204 (EMA200 on the 1-hour chart), 0.7172 (EMA200 on the 4-hour chart, EMA50 on the daily chart) AUD / USD will move towards the support levels of 0.7085, 0.7025 with the prospect of further decline with long-term goals at the levels support 0.6910 (lows of September 2015), 0.6830 (lows of 2016). An alternative scenario assumes the resumption of upward correction. In case of a breakdown of the key resistance level of 0.7295 AUD / USD, it will go to resistance levels of 0.7385, 0.7460 (Fibonacci 23.6% of the correction to the wave of decline in the pair from July 2017 and the level of 0.9500. The minimum of this wave is near the level of 0.6830). Further growth is unlikely due to a number of fundamental factors. Support Levels: 0.7204, 0.7172, 0.7085, 0.7025 Resistance Levels: 0.7245, 0.7295, 0.7385, 0.7460 Trading scenarios Sell in the market. Stop Loss 0.7280. Take-Profit 0.7204, 0.7172, 0.7085, 0.7025, 0.6910, 0.6830 Buy Stop 0.7305. Stop Loss 0.7240. Take-Profit 0.7385, 0.7460 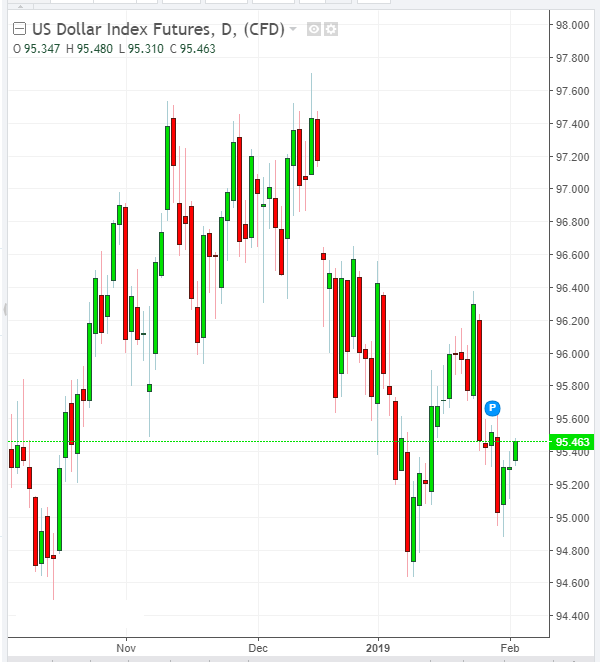 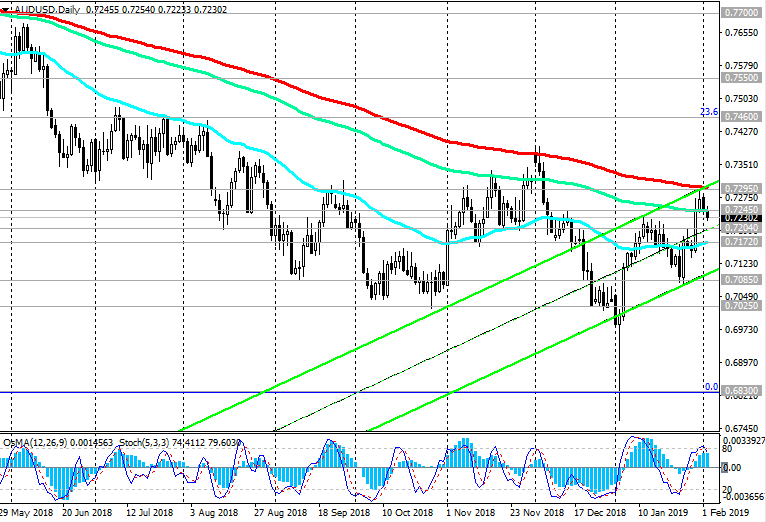 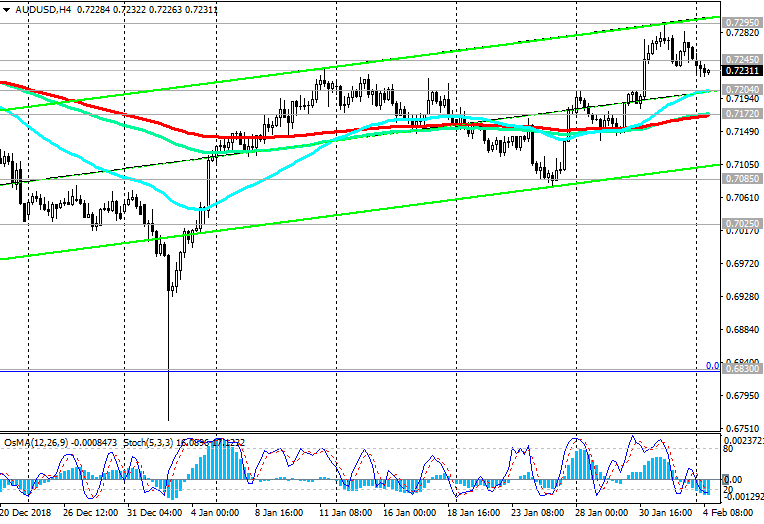 *) For up-to-date and detailed analytics and news on the forex market visit Tifia Forex Broker website tifia.com 
|
|
#362
05-02-2019, 10:20
|
||||
|
||||
|
GBP/USD: Dollar lacks positive momentum
05/02/2019 After, on Tuesday morning, the RB of Australia expectedly kept the interest rate unchanged, the volatility of trading on the foreign exchange market at the beginning of the European session decreased significantly. Major dollar currency pairs, with the exception of AUD / USD, are traded on Tuesday in a narrow range. The US dollar and the market as a whole do not have enough drivers for further movement. Probably, such a driver will be the publication in the first half of the US trading session (15:00 GMT) of the report of the Institute for Supply Management (ISM) on activity in the non-manufacturing sector of the United States. Economists expect the non-production composite index from the Institute for Supply Management (ISM) in January to fall to 57.1 from 58.0 in December. Although an index value above 50 indicates an increase in activity, a relative decline in the indicator may have a short-term negative impact on the dollar. Market participants will also closely monitor the performance of the US President Donald Trump in Congress later on Tuesday with an annual message on the state of the country. Any signals from Trump about a positive change in the sides' positions in the negotiations between the US and China will support the dollar, which needs a strong positive impetus for further growth after the Fed meeting last week. As you know, on Wednesday the Fed kept its current monetary policy unchanged and signaled its intentions to be more restrained in regard to further rate increases. Fed Chairman Jerome Powell said at a press conference that "there was a little less reason to raise rates". According to the central bank executives, the current level of inflationary pressure does not force the Fed to take any action. Many investors do not expect further increases in the Federal Reserve rates this year. Moreover, futures on the Fed rates on Monday indicated an 11% chance of lowering the Fed rates by the end of the year. Last week, this probability was 21%, according to the CME Group. The dollar index DXY, reflecting its value against a basket of 6 currencies, is moderately rising from the opening of the trading day on Tuesday. At the beginning of the European session, futures for the DXY dollar index traded near the 95.68 mark, 10 points higher than the opening price of the trading day. *)An advanced fundamental analysis is available on the Tifia Forex Broker website at tifia.com/analytics GBP / USD has fallen on Tuesday for 4 days in a row. Weak macro data, unresolved situation with the UK exit from the EU, as well as worsening situation in the world, volatility in financial markets and restraint of the Federal Reserve System can force the Bank of England to take a softer stance with regard to its monetary policy. Any hints of the bank towards a softer policy will cause a sharp decline in the pound. Indicators OsMA and Stochastic on the 1-hour, 4-hour, daily charts switched to the short positions. After GBP / USD is fixed in the zone below the support level of 1.2920 (ЕМА50 on the daily chart, ЕМА200 on the 4-hour chart) short positions will again become relevant. The main trend is still bearish. The objectives of the decline are support levels of 1.2600 (lows of June 2017), 1.2485, 1.2365. Support Levels: 1.2975, 1.2920, 1.2860, 1.2785, 1.2700, 1.2670, 1.2600, 1.2485, 1.2365, 1.2110, 1.2000 Resistance Levels: 1.3040, 1.3065, 1.3125, 1.3210, 1.3300, 1.3470, 1.3690 Trading scenarios Sell in the market. Stop Loss 1.3070. Take-Profit 1.2975, 1.2920, 1.2860, 1.2785, 1.2700, 1.2670, 1.2600, 1.2485, 1.2365 Buy Stop 1.3070. Stop Loss 1.2990. Take-Profit 1.3125, 1.3210, 1.3300, 1.3470, 1.3690 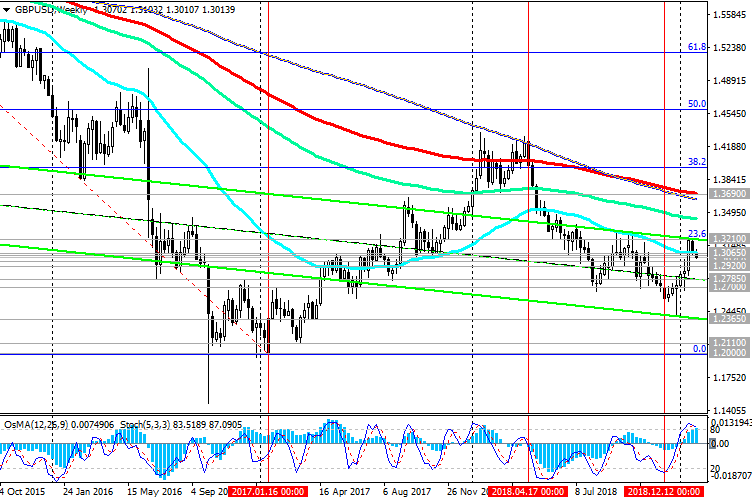 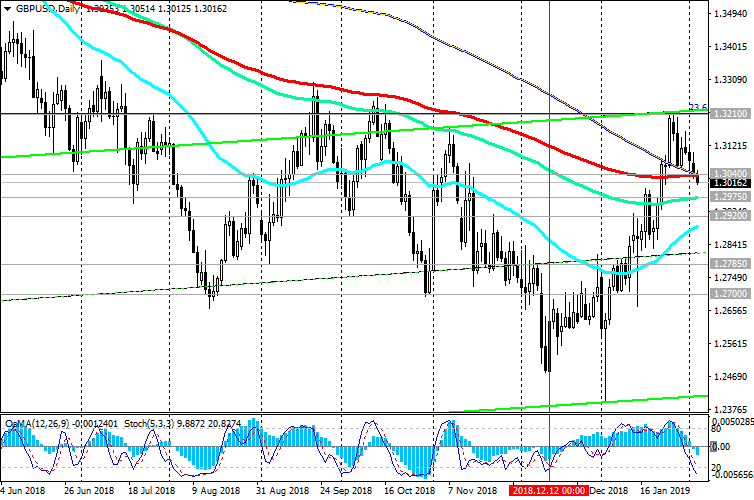 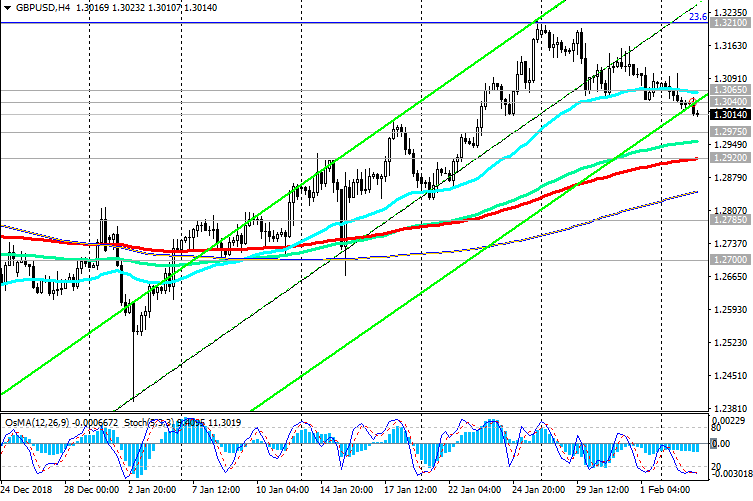 *) For up-to-date and detailed analytics and news on the forex market visit Tifia Forex Broker website tifia.com
|
|
#363
06-02-2019, 11:01
|
||||
|
||||
|
AUD/USD: Trading recommendations
06/02/2019 On Wednesday, AUD / USD broke through important short-term support levels of 0.7210 (EMA200 on the 1-hour chart), 0.7172 (EMA200 on the 4-hour chart, EMA50 on the daily chart) and continues to decline towards support levels of 0.7085, 0.7025. On Friday (00:30 GMT), the RBA will comment on the prospects for its monetary policy. There will also be given forecasts regarding the further growth of the Australian economy, labor market, inflation. If forecasts turn out to be negative, then the Australian dollar and AUD / USD will continue to decline. Long-term reduction targets are at support levels of 0.6910 (lows of September 2015), 0.6830 (lows of 2016). Negative dynamics prevails; below the resistance level 0.7172 short positions are preferable. Support Levels: 0.7100, 0.7085, 0.7025 Resistance Levels: 0.7172, 0.7210, 0.7245, 0.7295, 0.7385, 0.7460 Trading recommendations Sell in the market. Stop Loss 0.7190. Take-Profit 0.7100, 0.7085, 0.7025, 0.6910, 0.6830 Buy Stop 0.7215. Stop Loss 0.7160. Take-Profit 0.7245, 0.7295, 0.7385, 0.7460 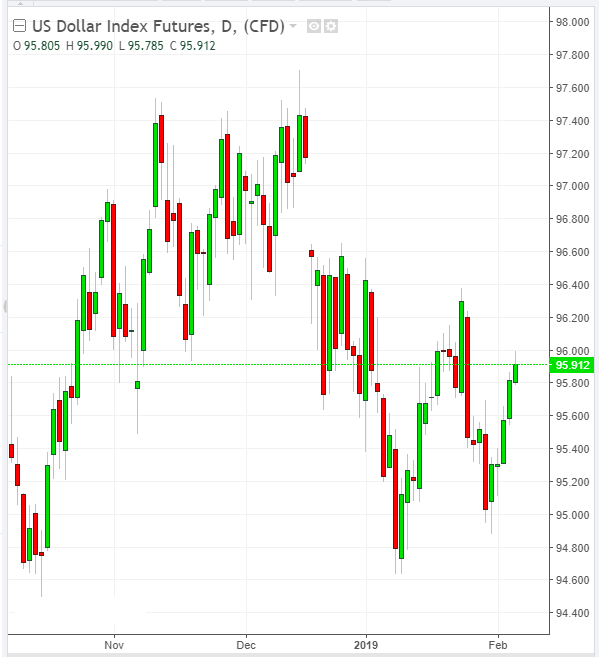 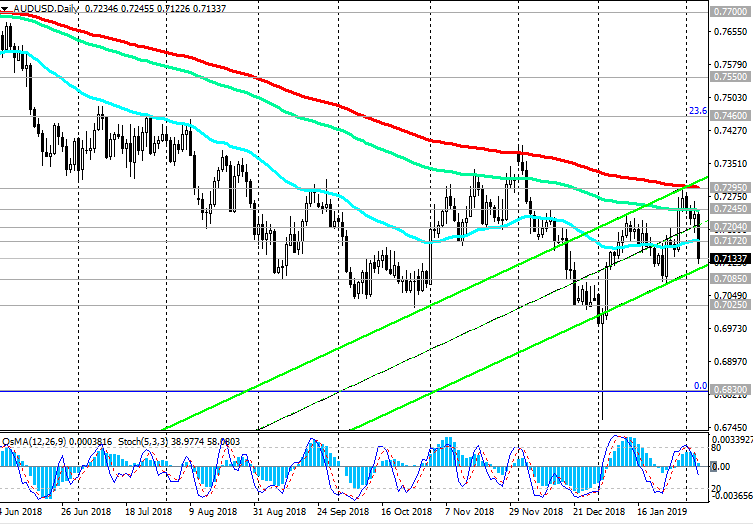 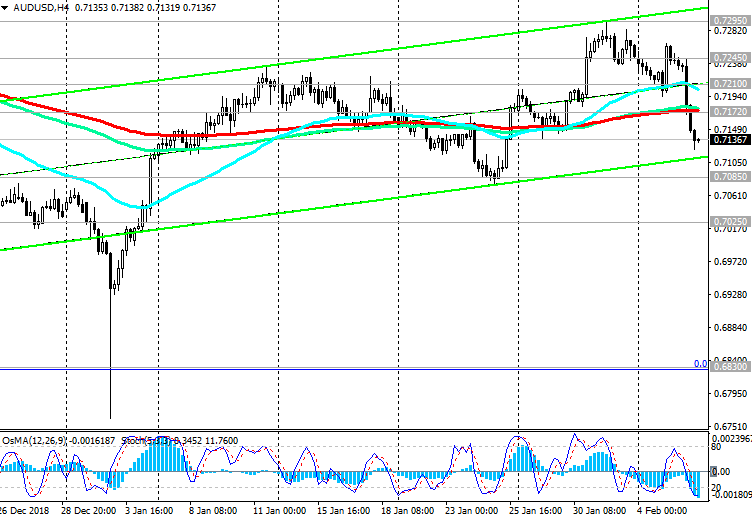 *) For up-to-date and detailed analytics and news on the forex market visit Tifia Forex Broker website tifia.com
|
|
#364
07-02-2019, 11:43
|
||||
|
||||
|
NZD/USD: external negative background may intensify
07/02/2019 Randal Quarles, deputy chairman of the US Federal Reserve System for Supervision of the Banking Sector, said Wednesday that he was worried about the negative impact of events taking place abroad. Global risks are probably the most significant, said Quarles, pointing in particular to the slowdown in Chinas GDP growth. Chinese imports occupy the lions share of New Zealand exports. The slowdown of the world and Chinese economies have the most negative impact on commodity prices, as well as on commodity currencies, including the New Zealand dollar. On Thursday, the NZD declines after the publication on the eve of the weaker-than-expected data from the New Zealand labor market. According to the Statistics Bureau of New Zealand, unemployment in the country increased in the 4th quarter of 2018 (4.3% versus 4.0% in the 3rd quarter and 4.1%, as expected, according to the forecast). *)An advanced fundamental analysis is available on the Tifia Forex Broker website at tifia.com/analytics At the beginning of the US trading session, NZD / USD is trading below key levels of 0.6805 (ЕМА200 on the daily chart), 0.6775 (ЕМА144 on the daily chart), near 0.6745, through which the bottom line of the ascending channel passes on the 4-hour chart. In the event of a breakdown of the support level of 0.6745, NZD / USD will go to the nearest local support level of 0.6710, a breakdown of which will mean the return of NZD / USD to a bearish trend. Only after NZD / USD returns to the zone above the resistance level of 0.6805, will it be possible to return to NZD / USD purchases again. Probably, before the RBNZ meeting on monetary policy, which will take place on February 12, the New Zealand dollar will remain under pressure, given the overall negative external macroeconomic background. If the RBNZ signals a propensity to reduce the rate, the New Zealand dollar may decline significantly. If the Fed again announces the possibility of a rate hike this year, the negative fundamental background for the New Zealand dollar in its dynamics against the US dollar will increase significantly. Resistance Levels: 0.6745, 0.6710, 0.6655, 0.6515, 0.6430 Support Levels: 0.6775, 0.6805, 0.6860, 0.6970, 0.7080 Trading recommendations Sell Stop 0.6735. Stop Loss 0.6785. Take-Profit 0.6710, 0.6655, 0.6515, 0.6430 Buy Stop 0.6785. Stop Loss 0.6735. Take-Profit 0.6805, 0.6860, 0.6970, 0.7080 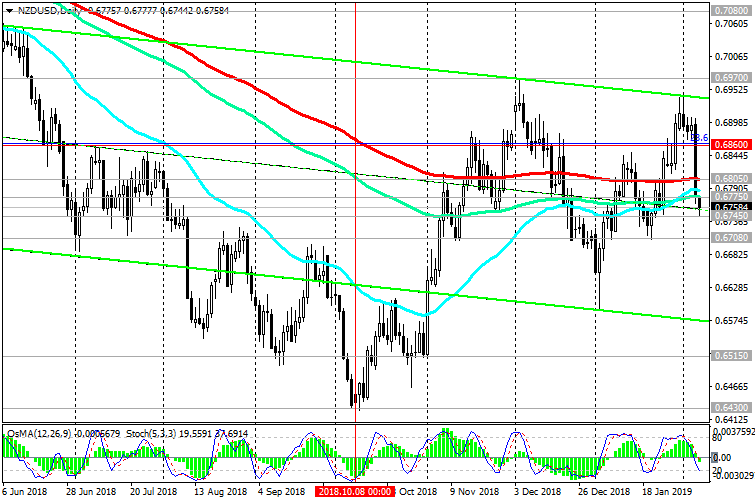 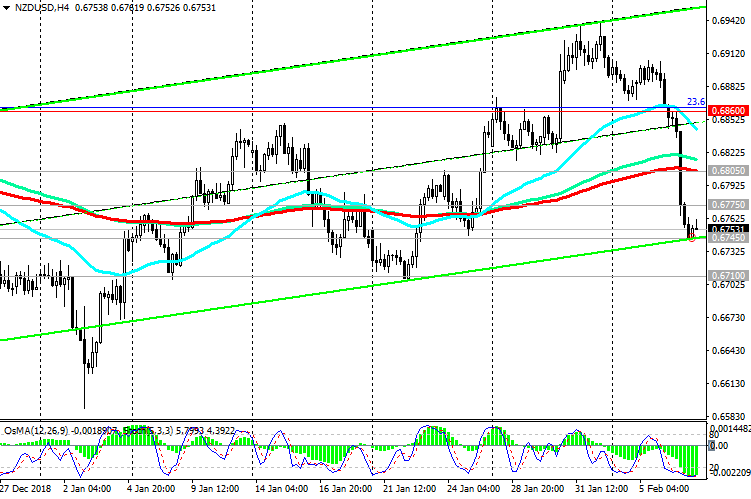 *) For up-to-date and detailed analytics and news on the forex market visit Tifia Forex Broker website tifia.com
|
|
#365
08-02-2019, 11:09
|
||||
|
||||
|
USD/CAD: the dollar is rising amid investor concerns. Trading scenarios
08/02/2019 Commodity currencies, such as New Zealand, Australian, Canadian dollars, fell on Thursday and continue to decline on Friday amid investor concerns about the global economy. The USD / CAD pair is trading before the start of the US trading session near the 1.3317 mark, above the important short-term support level of 1.3275 (ЕМА50 on the daily chart, ЕМА200 on the 4-hour chart). Investors are once again concerned about the state of the global economy, which causes the purchase of defensive assets and the dollar. At the beginning of the European session on Friday, DXY dollar index futures traded at 96.46, 12 points higher than the opening price of the trading day. White House economic adviser Larry Cudlow told the Fox Business Network that China and the United States are still far from a deal in trade. Hopes for a new trade agreement between the countries weakened after Cudlow's statements. If a trade truce is not concluded, then on March 2, the United States will raise duties on imports of goods from China by another $ 200 billion to 25% from 10%. This can have a very negative impact on stock markets and commodity prices, as well as causing investors to withdraw into defensive assets and the dollar. Declining prices are also putting pressure on CAD quotes. On Thursday, WTI crude oil prices closed at a low from January 28 at $52.64 per barrel. *)An advanced fundamental analysis is available on the Tifia Forex Broker website at tifia.com/analytics Above key support levels of 1.3185 (ЕМА144 on the daily chart), 1.3135 (ЕМА200 on the daily chart), 1.3100 (ЕМА50 on the weekly chart) positive dynamics of USD / CAD prevails. Long positions are preferred. Growth targets - resistance levels of 1.3450 (Fibonacci level 23.6% of the downward correction to the pair's growth in the global uptrend since September 2012 and 0.9700), 1.3665 (2018 highs), 1.3790 (2017 highs). The breakdown of the important short-term support level of 1.3275 will be the beginning of the development of an alternative scenario for reducing USD / CAD with targets at the support levels of 1.3135, 1.3100. Support Levels: 1.3275, 1.3185, 1.3135, 1.3100 Resistance Levels: 1.3370, 1.3450, 1.3600, 1.3665, 1.3790 Trading scenarios Sell Stop 1.3290. Stop Loss 1.3330. Take-Profit 1.3185, 1.3135, 1.3100 Buy Stop 1.3330. Stop-Loss 1.3270. Take-Profit 1.3370, 1.3450, 1.3600, 1.3665, 1.3790 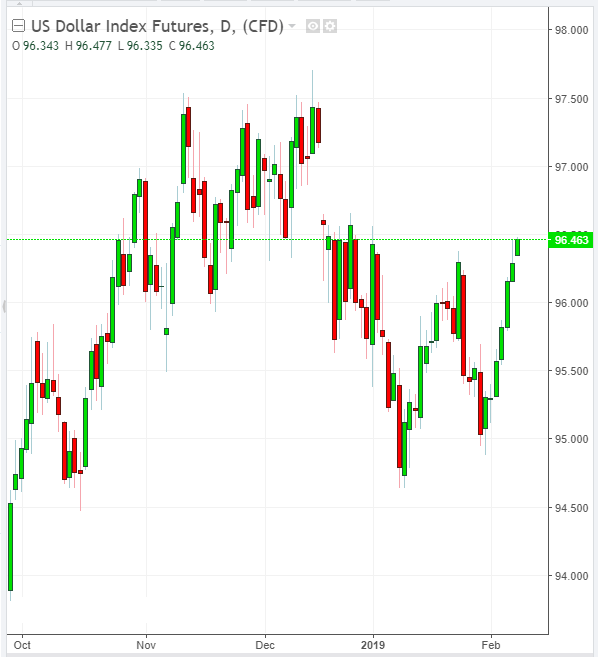 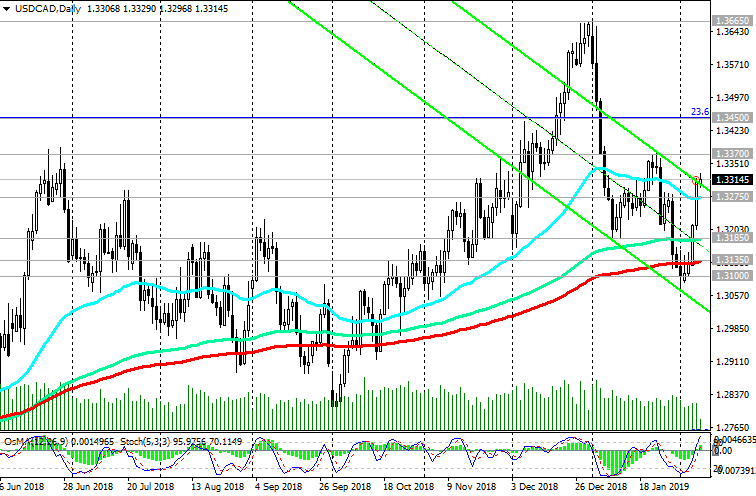  *) For up-to-date and detailed analytics and news on the forex market visit Tifia Forex Broker website tifia.com
|
|
#366
11-02-2019, 11:43
|
||||
|
||||
|
XAU/USD: Technical Analysis
11/02/2019 The dollar is rising again at the beginning of the new week. DXY dollar index futures traded at the beginning of the European trading session near the 96.62 mark, almost 20 points above the opening price of the trading day. Meanwhile, the growth of XAU / USD stopped after at the end of January this currency pair reached of the next multi-month high near the mark of 1326.00. On Monday, XAU / USD broke through an important short-term support level of 1310.00 (ЕМА200 on the 1-hour chart) and continues to decline towards the important support level of 1292.00 (ЕМА200 on the 4-hour chart). In the event of a breakdown of this support level, XAU / USD may decline to key support levels of 1265.00 (ЕМА200 on the weekly chart), 1259.00 (ЕМА200 on the daily chart). Above these levels there is a long-term positive trend. In the case of their breakdown, XAU / USD risks returning a long-term bearish trend with targets at support levels of 1197.00 (November lows), 1185.00 (Fibonacci 23.6%), 1160.00 (2018 lows). After the breakdown of the local resistance level of 1326.00, XAU / USD growth may resume with targets at resistance levels of 1357.00 (2017 highs), 1370.00 (start of a decline wave and Fibonacci level 100%). Below the short-term resistance level of 1310.00, short positions are preferable. *)An advanced fundamental analysis is available on the Tifia Forex Broker website at tifia.com/analytics Support Levels: 1302.00, 1292.00, 1277.00, 1265.00, 1259.00, 1248.00, 1234.00, 1220.00, 1197.00, 1185.00, 1160.00 Resistance Levels: 1310.00, 1315.00, 1326.00, 1357.00, 1365.00, 1370.00, 1375.00 Trading recommendations Sell Stop 1298.00. Stop Loss 1317.00. Take-Profit 1292.00, 1277.00, 1265.00, 1259.00, 1248.00, 1234.00, 1220.00, 1197.00, 1185.00, 1160.00 Buy Stop 1317.00. Stop Loss 1298.00. Take-Profit 1326.00, 1357.00, 1365.00, 1370.00, 1375.00 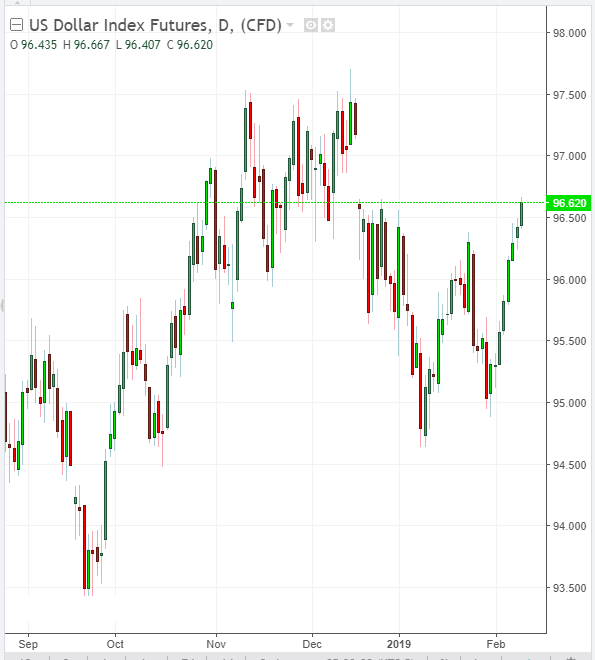 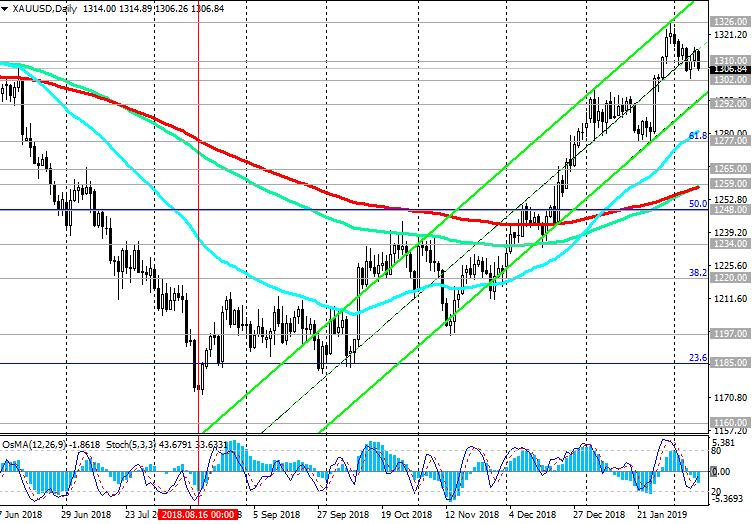 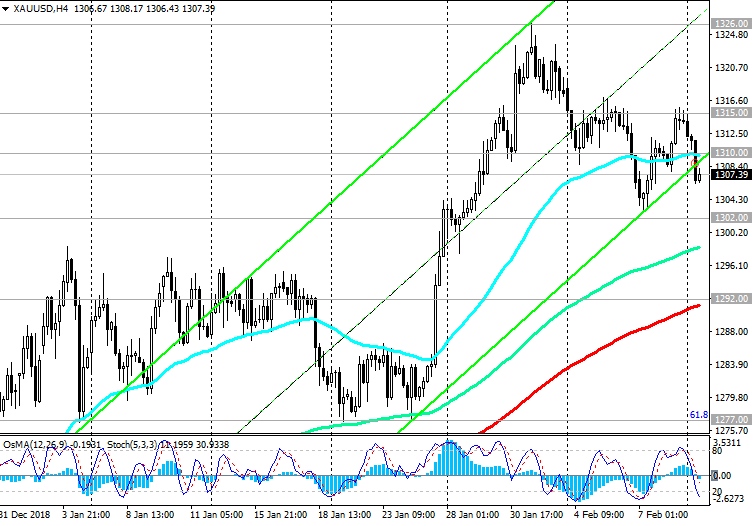 *) For up-to-date and detailed analytics and news on the forex market visit Tifia Forex Broker website tifia.com
|
|
#367
12-02-2019, 11:05
|
||||
|
||||
|
GBP/USD: Current Dynamics
12/02/2019 According to the National Bureau of Statistics of the United Kingdom, the country's GDP grew by 1.3% in the 4th quarter (year on year) against 1.6% growth in the 3rd quarter (the forecast was +1.4%). In December, GDP fell by 0.4%. It was the weakest growth since 2012. The slowdown was mainly due to a reduction in investment in 2018. Many economists predict that in the first quarter of 2019, UK real GDP will grow by 0.3% compared with the previous quarter. In the case of a tough Brexit, the British economy may fall into recession. Uncertainty about future relations with European countries will persist for several more years, many economists say. At the beginning of the European trading session, the GBP / USD pair is trading near the 1.2845 mark, and the pressure on the pound and the GBP / USD pair persists. At the same time, many economists see foreign trade as the main source of concern for the global and American economies. This week high-level trade negotiations will be held in Beijing. Investors hope to conclude an agreement before the planned increase in trade duties in March. If trade negotiations are again disrupted, then investor sentiment will deteriorate again, which will lead to a fall in stock indices and an increase in defensive asset prices. The deterioration of US trade relations with China may have an even more negative impact on both the Chinese and the American economy. And this is a negative factor for the dollar. *)An advanced fundamental analysis is available on the Tifia Forex Broker website at tifia.com/analytics So far, preferred short positions. The main trend of GBP / USD is still bearish. The objectives of the decline are support levels of 1.2600 (lows of June 2017), 1.2485, 1.2365. Purchases can only be considered after GBP / USD returns to a zone above the key resistance level of 1.3020 (ЕМА200 on the daily chart) and an increase to the resistance level of 1.3210 (Fibonacci level 23.6% of the correction to the decline of the GBP / USD pair in the wave that started in July 2014 years near the level of 1.7200). The first signal for opening long positions will be the breakdown of important short-term resistance levels of 1.2920 (ЕМА200 on the 4-hour chart), 1.2895 (ЕМА50 on the daily chart). Support Levels: 1.2800, 1.2785, 1.2700, 1.2670, 1.2600, 1.2485, 1.2365, 1.2110, 1.2000 Resistance Levels: 1.2895, 1.2920, 1.2960, 1.3020, 1.3065, 1.3125, 1.3210 Trading recommendations Sell in the market. Stop Loss 1.2940. Take-Profit 1.2800, 1.2785, 1.2700, 1.2670, 1.2600, 1.2485, 1.2365 Buy Stop 1.2940. Stop Loss 1.2840. Take-Profit 1.2960, 1.3020, 1.3065, 1.3125, 1.3210 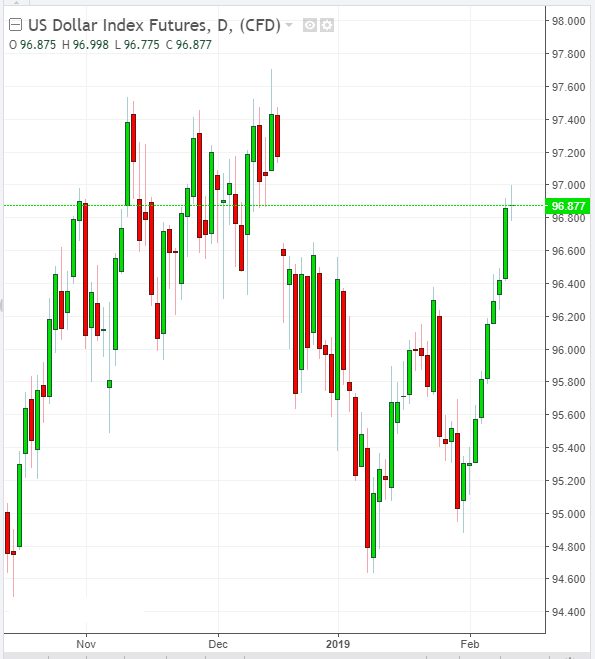  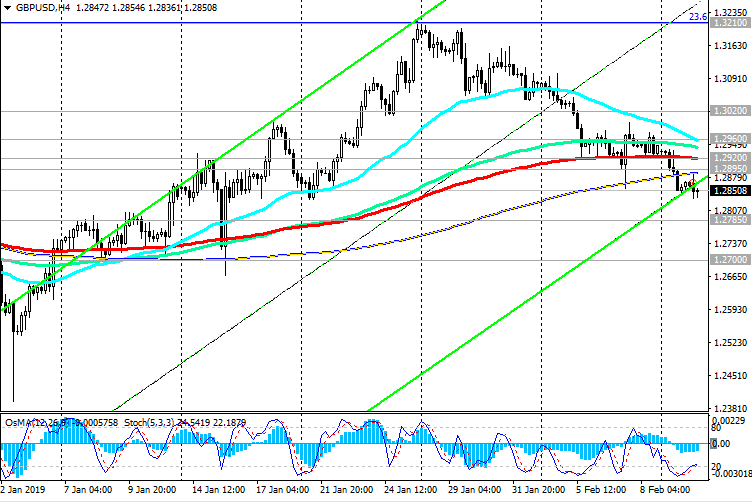 *) For up-to-date and detailed analytics and news on the forex market visit Tifia Forex Broker website tifia.com
|
|
#368
13-02-2019, 10:55
|
||||
|
||||
|
S&P500: market expectations
02/13/2019 Expectations of a positive outcome of negotiations between the US and China and the conclusion of a trade truce supports investor optimism. US President Donald Trump said on Tuesday that "tariff increases for Chinese imports on March 1 may not occur if we are close to a trade agreement". On Wednesday, investors will focus on the publication (at 13:30 GMT) of US inflation indicators. It is expected that the growth rate of consumer inflation in the United States slowed in January. This is a positive factor for the US stock market. After the December Fed meeting, the head of the central bank, Jerome Powell, repeatedly stated that the Fed could be more patient in raising rates. In his opinion, the central bank is ready to change its policy substantially if necessary, and that it will listen carefully to the market. On Wednesday, Powell said that "incoming data suggests that the US economy is in good shape," supporting investors' optimism, putting on further growth of the US stock market. *)An advanced fundamental analysis is available on the Tifia Forex Broker website at tifia.com/analytics At the moment, the S&P500 index is trying to develop an upward trend above the key support level of 2700.0 (ЕМА200 on the daily chart). Growth targets are resistance levels of 2873.0, 2936.0. Alternative scenario: breakdown of support level 2660.0 (ЕМА200 on 4-hour chart) and further decline with targets at support levels of 2615.0, 2603.0, 2584.0, 2450.0 (ЕМА200 on the weekly chart), 2386.0 (Fibonacci level 50% of the correction to the growth since February 2016), 2256.0 (Fibonacci level 61.8%), which will indicate the break of the S&P500 bullish trend. Support Levels: 2733.0, 2700.0, 2676.0, 2615.0, 2603.0, 2584.0, 2533.0, 2507.0, 2450.0, 2386.0, 2335.0 Resistance Levels: 2817.0, 2873.0, 2936.0 Trading recommendations Sell Stop 2730.0. Stop Loss 2770.0. Objectives 2700.0, 2676.0, 2615.0, 2603.0, 2584.0, 2533.0, 2507.0, 2450.0, 2386.0, 2335.0 Buy Stop 2770.0. Stop Loss 2730.0. Objectives 2800.0, 2817.0, 2873.0, 2936.0 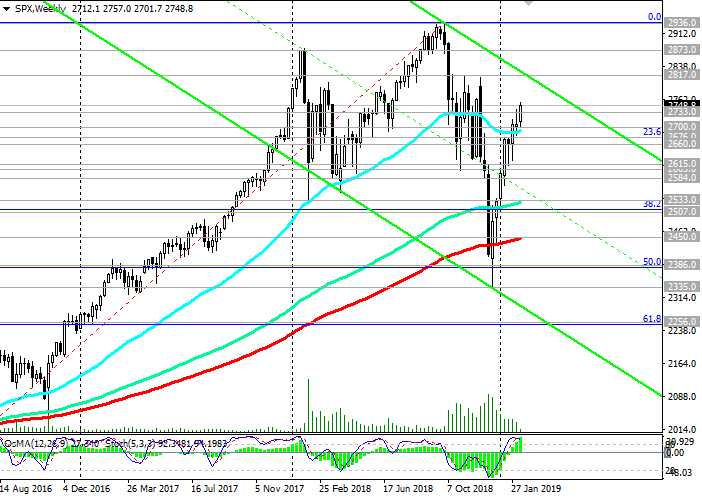 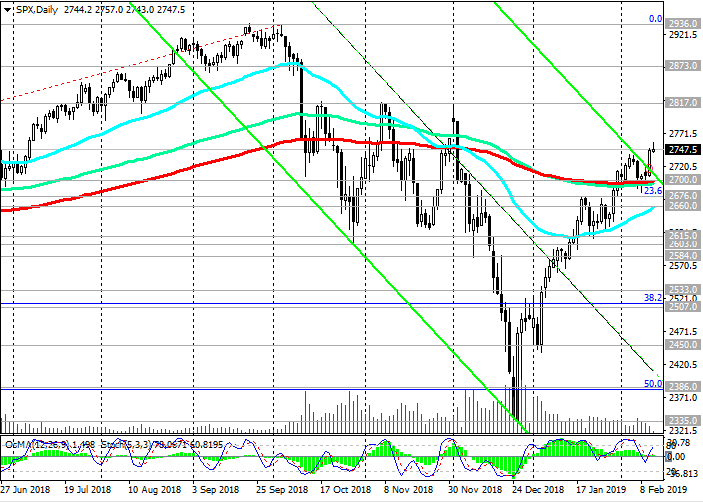 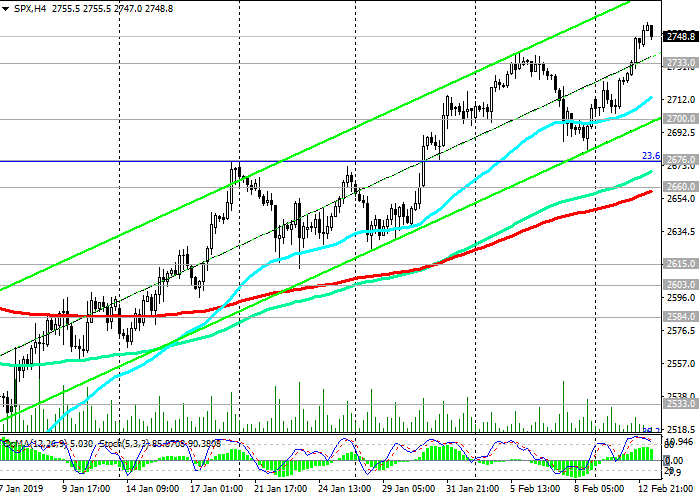 *) For up-to-date and detailed analytics and news on the forex market visit Tifia Forex Broker website tifia.com
|
|
#369
14-02-2019, 11:40
|
||||
|
||||
|
EUR/USD: pending US retail statistics
14/02/2019 Futures on the dollar index DXY, reflecting its value against a basket of 6 major world currencies, is traded on Thursday almost unchanged before the publication of US reports on inflation and retail sales, near the mark of 97.00. The DXY dollar index has been growing for the second week in a row. On Wednesday, the growth of the dollar was supported by positive macro statistics, which indicated a rise in inflation in the US + 1.6% in January, which turned out to be better than the forecast + 1.5%. The base consumer price index (excluding food and energy) in January increased by 2.2% (the forecast was + 2.1%). The data indicated that inflation in the US is near the target Fed level of 2%. If inflation continues in the coming months, the likelihood of another interest rate increase in the United States will increase, making the dollar more expensive and attractive to investors. At the same time, European macro statistics released on Thursday indicated a slowdown in the European economy at the end of 2018. According to the data of the Federal Bureau of Statistics of Germany, published on Thursday, the country's GDP grew in the 4th quarter of 2018 by only 0.1% after a decrease in the 3rd quarter of 2018 by 0.8% (year-on-year). The German economy in the 4th quarter of 2018 for the first time in six years was on the verge of recession. Eurozone GDP in the 4th quarter rose by + 0.2% (+ 1.2% in annual terms), which coincided with the forecast and the first estimate. Eurozone GDP growth in 2018 was 1.8% versus 2.4% in 2017, which once again indicated a slowdown in the growth of the European economy. The Eurodollar reacted negatively to the publication of statistics on Wednesday and Thursday, updating the 3-month low near the 1.1249 mark. On Thursday, market participants will follow the publication of US retail sales data at 1:30 pm (GMT). Retail sales in the US are expected to increase by + 0.4% in December (against + 0.9% in November and + 0.3% in October). In general, the indicators can be considered positive. However, their relative decline may adversely affect the dollar quotes. Data better than the forecast will resume the growth of the dollar. *)An advanced fundamental analysis is available on the Tifia Forex Broker website at tifia.com/analytics Currently, EUR / USD is trading near 1.1270, below key resistance levels of 1.1530 (ЕМА200 on the daily chart), 1.1480 (ЕМА144 and the upper line of the downward channel on the daily chart). Downward dynamics prevail. A further decline is likely with targets at support levels of 1.1215 (November and year lows), 1.1200, 1.1000 (bottom line of the downward channel on the weekly chart). Support Levels: 1.1270, 1.1215, 1.1120, 1.1000 Resistance Levels: 1.1335, 1.1380, 1.1480, 1.1530, 1.1680, 1.1780 Trading recommendations Sell Stop 1.1245. Stop-Loss 1.1310. Take-Profit 1.1215, 1.1120, 1.1000 Buy Stop 1.1310. Stop Loss 1.1245. Take-Profit 1.1335, 1.1380, 1.1480, 1.1530 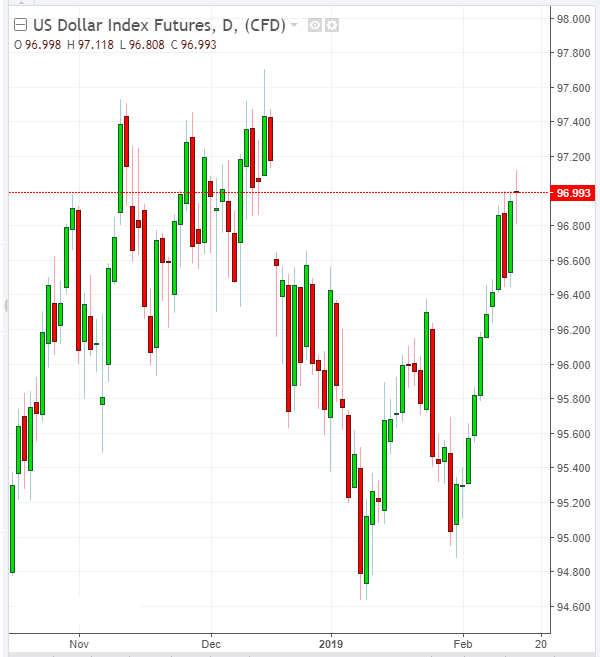 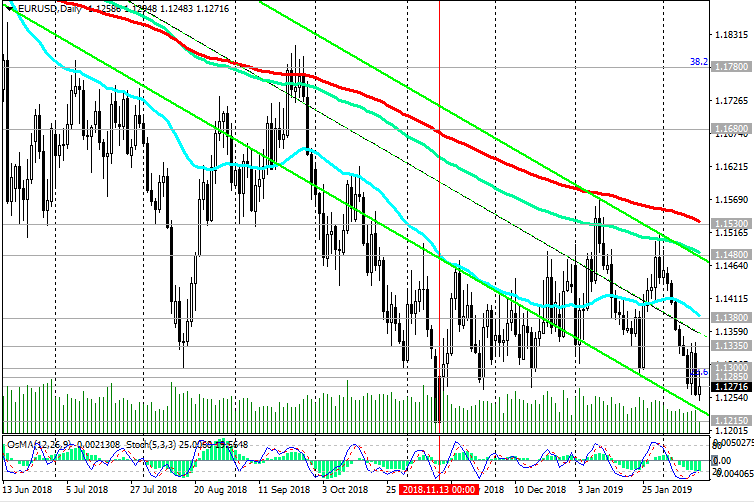 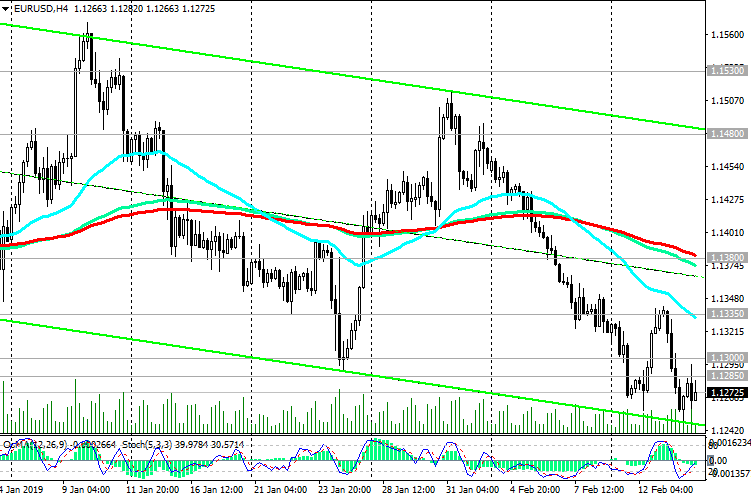 *) For up-to-date and detailed analytics and news on the forex market visit Tifia Forex Broker website tifia.com
|
|
#370
15-02-2019, 10:24
|
||||
|
||||
|
WTI: Market expectations
15/02/2019 On Friday, WTI oil prices are in a narrow range near $54.50 a barrel, and oil market participants are waiting for the publication (at 18:00 GMT) of a weekly report from the American oilfield service company Baker Hughes on the number of active oil drilling rigs in the US. Their number increased in the previous week and currently stands at 854 units, although this is below the maximum of 887 units reached at the end of 2018. At the moment, oil prices are recovering after falling in the 4th quarter of 2018 (oil prices in the end of December hit bottom near the mark of 42.00 dollars per barrel of WTI crude oil). Rising oil prices create an incentive for American oil companies to increase production, which, in turn, is a deterrent to rising oil prices. The increase in the number of drilling rigs is a negative factor for oil prices and will create prerequisites for the subsequent decline in oil prices. At the present moment, a number of positive fundamental factors prevail over negative ones. Possible further rise in oil prices. *)An advanced fundamental analysis is available on the Tifia Forex Broker website at tifia.com/analytics Last Tuesday, the price of WTI crude oil broke through an important resistance zone at 52.75 (ЕМА200 on 4-hour chart), 53.10 (ЕМА200 on 1-hour chart, ЕМА50 on the daily chart) and maintains a positive trend, trading on Friday at resistance level of 54.50 (December highs). In case of breakdown of the local resistance level of 55.50, the price growth will continue with targets at the resistance levels of 56.50 (ЕМА200 on the weekly chart), 57.80 (ЕМА144 on the daily chart and the Fibonacci 38.2% level of the correction to the growth wave that started in February 2016 from the support level, passing near the mark of 27.30), 59.00 (EMA200 on the daily chart). The alternative scenario will be associated with the breakdown of the support level of 52.00 (Fibonacci level of 50%) and the resumption of decline in the downstream channels on the daily and weekly charts, the lower limit of which passes near the mark of 27.30. So far, positive dynamics prevail. Long positions are preferred. Support Levels: 53.55, 53.10, 52.75, 52.00, 51.60, 50.25, 50.00, 49.00, 46.00, 42.20 Resistance Levels: 55.50, 56.50, 57.00, 57.80, 59.00, 60.00 Trading Scenarios Sell Stop 52.90. Stop Loss 55.10. Take-Profit 52.75, 52.00, 51.60, 50.25, 50.00, 49.00, 46.00, 42.20 Buy Stop 55.10. Stop Loss 52.90. Take-Profit 55.50, 56.50, 57.00, 57.80, 59.00, 60.00 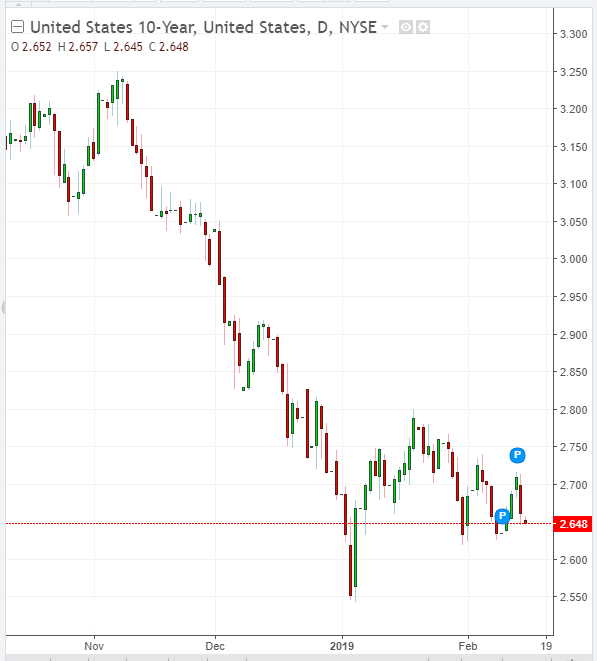  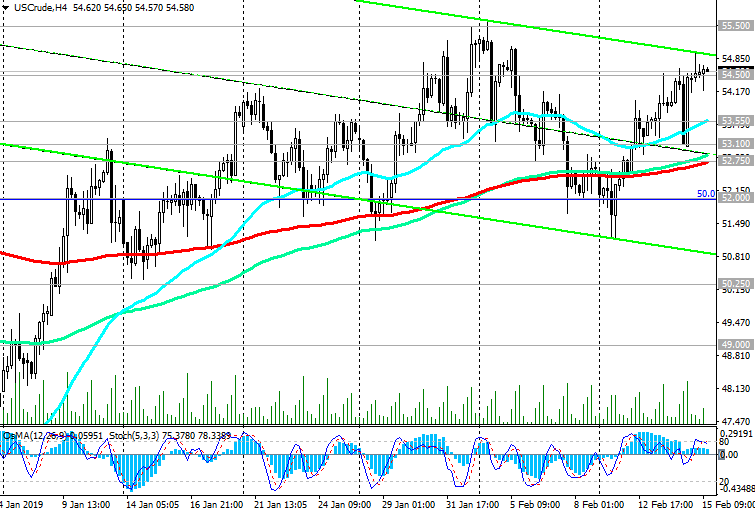 *) For up-to-date and detailed analytics and news on the forex market visit Tifia Forex Broker website tifia.com
|
|
#371
18-02-2019, 09:13
|
||||
|
||||
|
EUR/USD: Support and resistance levels
18/02/2019 At the beginning of the European trading session, the EUR / USD pair is trading above the support level of 1.1300, attempting to break the short-term resistance level of 1.1320 (ЕМА200 on the 1-hour chart). The indicators OsMA and Stochastic on the 1-hour, 4-hour, daily charts turned to long positions. In case of a breakdown of the resistance level and continued growth, EUR / USD will be able to reach the next important resistance level of 1.1375 (ЕМА200 on the 4-hour chart, ЕМА50 on the daily chart). The maximum correctional growth is possible to the key resistance levels of 1.1480 (EMA144 on the daily chart), 1.1530 (EMA200 on the daily chart). Above the resistance level of 1.1530, growth is unlikely against the background of strong fundamental factors indicating the slowdown of the European economy and the acceleration of the American economy. The dollar remains the preferred currency. Downward dynamics prevail. Short positions are preferred. In case of resumption of decline and after the breakdown of the support level of 1.1285 (Fibonacci 23.6% of the correction to the fall from the level of 1.3900, which began in May 2014), the reduction targets will be the support levels of 1.1270 (December lows), 1.1215 (November and year lows), 1.1200, 1.1000 (bottom line of the downward channel on the weekly chart). Today is a public holiday on the occasion of Presidents Day The exchanges will be closed, trading volumes will be small. Probably, until the end of today's trading day, the EUR / USD pair will remain trading near the current levels and the support level of 1.1300. Breakdown of the resistance level of 1.1320 today is unlikely due to the lack of important news drivers and low trading volumes. *)An advanced fundamental analysis is available on the Tifia Forex Broker website at tifia.com/analytics Support Levels: 1.1300, 1.1285, 1.1215, 1.1120, 1.1000 Resistance Levels: 1.1320, 1.1375, 1.1480, 1.1530 Trading recommendations Sell Stop 1.1290. Stop Loss 1.1335. Take-Profit 1.1215, 1.1120, 1.1000 Buy Stop 1.1335. Stop Loss 1.1280. Take-Profit 1.1375, 1.1480, 1.1530 *) For up-to-date and detailed analytics and news on the forex market visit Tifia Forex Broker website tifia.com
|
|
#372
19-02-2019, 11:34
|
||||
|
||||
|
GBP/USD: Brexit theme is in the foreground
02/19/2019 Current dynamics The data presented on Tuesday by the National Bureau of Statistics of the United Kingdom, which generally coincided with the forecast, indicated an increase in the average wage in the country from October to December (excluding bonuses by 3.4%) and a decrease in the number of unemployed. Unemployment remained at 4%, the lowest in four decades, the number of unemployed in the UK from October to December declined by 14,000 compared with the previous three-month period. The growth rate of wages far exceeds inflation, which in January was 1.8%. However, the Bank of England is unlikely to take any action regarding monetary policy, given the uncertainty about the prospects for Brexit. The economic performance of the UK is still in the background, as market participants expect clarification of prospects for Brexit. The British pound almost did not respond to strong data on the UK labor market, indicating an increase in average wages and a decrease in the number of unemployed. Now market participants will expect the results of the voting next week in the British Parliament regarding Brexit. If British Prime Minister Theresa May is defeated again, the pound will again be under pressure. If there is no agreement between the EU and the UK regarding trade relations after March 29 (the UKs exit date), then a "hard" Brexit, as Bank of England CEO Mark Carney stated earlier, will be a disaster for the British economy. This may not happen in reality; however, a significant blow will be dealt to the pound in the foreign exchange market. *)An advanced fundamental analysis is available on the Tifia Forex Broker website at tifia.com/analytics For now, the GBP / USD remains within the narrow range between the support level of 1.2900 (ЕМА200 on the 1-hour chart, ЕМА200 on the 4-hour chart, ЕМА50 on the daily chart) and the resistance level of 1.2960 (ЕМА144 on the daily chart). So far, more likely resumption of decline. In the event of a breakdown of the support level of 1.2700, the targets for the decline will be the support levels of 1.2600 (lows of June 2017), 1.2485, 1.2365. Support Levels: 1.2900, 1.2800, 1.2785, 1.2700, 1.2670, 1.2600, 1.2485, 1.2365, 1.2110, 1.2000 Resistance Levels: 1.2960, 1.3020, 1.3065, 1.3125, 1.3210 Trading scenarios Sell Stop 1.2890. Stop Loss 1.2970. Take-Profit 1.2800, 1.2785, 1.2700, 1.2670, 1.2600, 1.2485, 1.2365 Buy Stop 1.2970. Stop Loss 1.2890. Take-Profit 1.3020, 1.3065, 1.3125, 1.3210 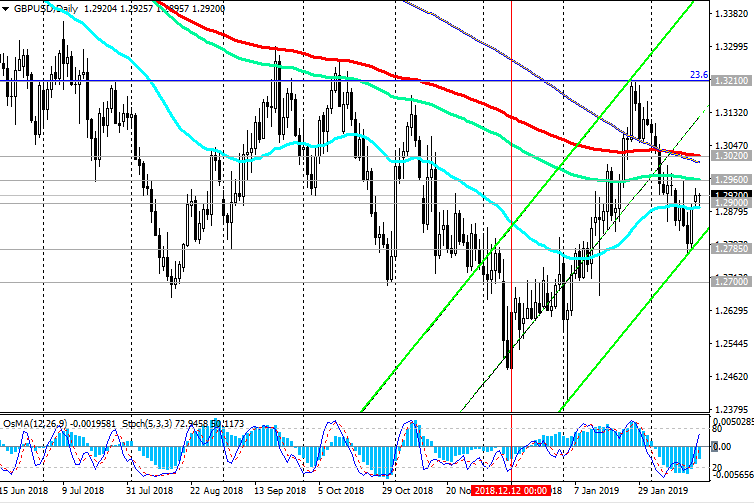 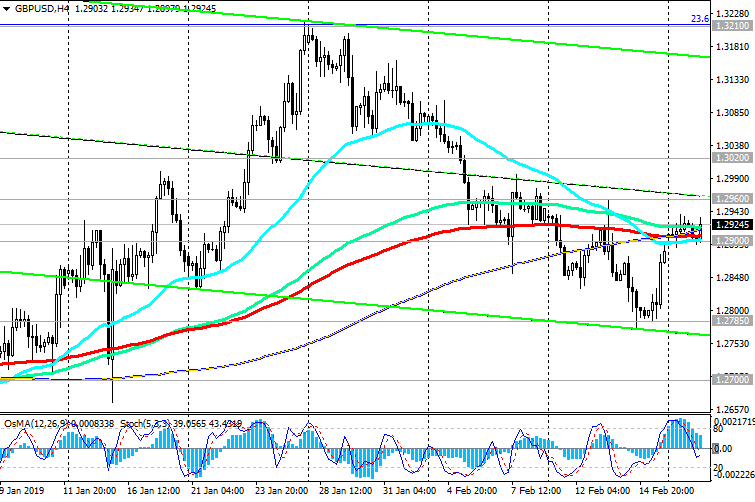 *) For up-to-date and detailed analytics and news on the forex market visit Tifia Forex Broker website tifia.com
|
|
#373
20-02-2019, 10:49
|
||||
|
||||
|
AUD/USD: on the eve of the publication of the minutes from the January Fed meeting
20/02/2019 The focus of traders on Wednesday will be the publication (19:00 GMT) of the minutes from the January Fed meeting. Earlier in the week, New York Fed President John Williams said he did not see the need to raise interest rates if growth or inflation rates did not change. Fed Chairman Jerome Powell, after the January meeting of the Fed, also spoke more restrained about the prospects for further monetary tightening, saying that "the policy is not predetermined. We (at the Fed) will pay close attention to incoming economic and financial data". If the texts of the protocols are also soft in content and rhetoric of statements by the Fed leaders, this will have a stimulating effect on the US stock markets. The dollar is likely to react with more restraint to the publication of the protocols, since market participants are unlikely to find something new for themselves in them. Recently, there has been a restrained approach on the part of the leaders of world central banks with regard to the monetary policy of their banks. The decisive role in these conditions for the dynamics of the US dollar will be played by macro statistics coming from the United States. In the context of world trade wars, the American economy looks more stable, which will attract investment in it and will support the demand for the dollar in the long term. For traders who trade AUD and AUD / USD, pay attention to the publication at 00:30 (GMT) on Thursday of data from the Australian labor market. As expected, in January, the number of employed Australian citizens increased by 15,000 people (against +21600 in December), while unemployment remained unchanged at 5%. In general, the indicators can be called positive. Data better than forecast will strengthen AUD. On Wednesday, the Australian Finance Minister said that risks (for the Australian economy) are increasing both domestically and abroad, although, in his opinion, the labor market remains strong, and will eventually support wage growth. *)An advanced fundamental analysis is available on the Tifia Forex Broker website at tifia.com/analytics Meanwhile, AUD / USD is trading on Wednesday at the 0.7150 balance line (ЕМА50 on the daily chart, ЕМА200 on the 4-hour chart), which is also in the middle of the range between the levels of 0.7055 (February lows) and 0.7225 (ЕМА144 on the daily chart). In case of breakdown of the local resistance level of 0.7180, AUD / USD will go to the upper part of the specified range and to resistance levels of 0.7225, 0.7275 (ЕМА200 on the daily chart). Growth above the resistance level of 0.7275 is unlikely. The breakdown of the short-term support level of 0.7130 (ЕМА200 on the 1-hour chart) will be a signal to resume sales with targets at the support levels of 0.6910 (lows of September 2015), 0.6830 (2016 lows). Support Levels: 0.7150, 0.7130, 0.7100, 0.7085, 0.7055, 0.7025 Resistance Levels: 0.7225, 0.7275 Trading recommendations Sell Stop 0.7120. Stop Loss 0.7180. Take-Profit 0.7100, 0.7085, 0.7025, 0.6910, 0.6830 Buy Stop 0.7180. Stop Loss 0.7120. Take-Profit 0.7225, 0.7245, 0.7275 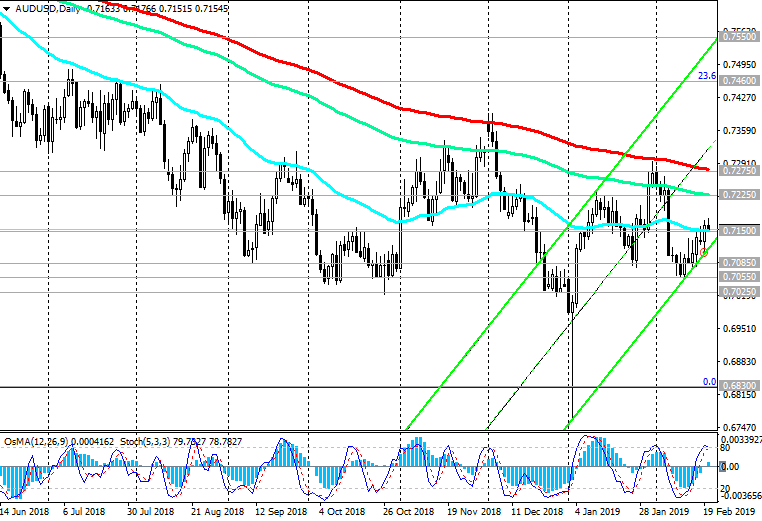 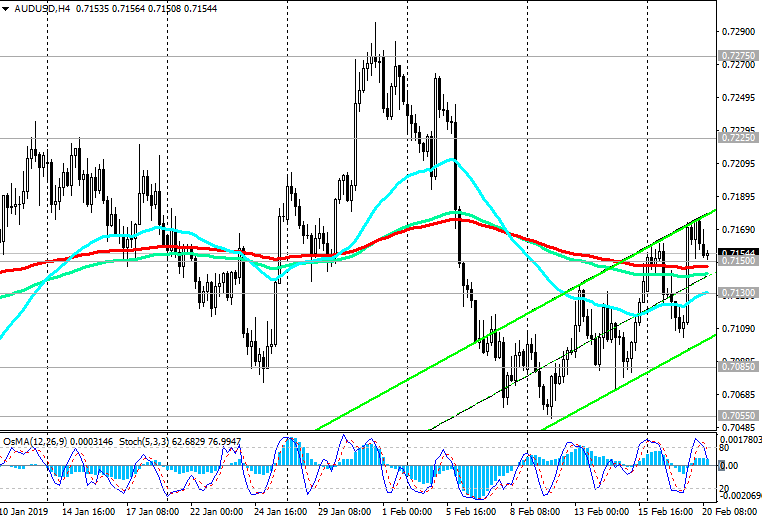 *) For up-to-date and detailed analytics and news on the forex market visit Tifia Forex Broker website tifia.com
|
|
#374
21-02-2019, 10:36
|
||||
|
||||
|
EUR/USD: breakdown of the range is expected
02/21/2019 Euro sluggishly reacted to the publication at the beginning of the European session on Thursday of the purchasing managers' indices (PMI) for the manufacturing sector in Germany (according to IHS Markit) and the services sector. In February, the PMI for the manufacturing sector fell to 47.6 (the forecast was 49.7), which was the lowest level in more than six years. The composite PMI index of the Eurozone in February came out with a value of 51.4 (the forecast was 51.1 and 51.0 in January). *)An advanced fundamental analysis is available on the Tifia Forex Broker website at tifia.com/analytics The EUR / USD pair for the second day continues to trade in the range between the levels of 1.1325 (ЕМА200 on the 1-hour chart) and 1.1365 (ЕМА200 on the 4-hour chart). A breakthrough in one direction or another will determine the further dynamics of EUR / USD. The growth targets in case of continuation of the upward correction will be the resistance levels of 1.1471 (ЕМА144 and the upper limit of the downward channel on the daily chart), 1.1522 (ЕМА200 on the daily chart). Below these levels, there is a long-term bearish trend that began in May 2014 near the 1.3870 mark. In case of breakdown of the support level of 1.1325, the targets for the decline will be the support levels of 1.1270 (December lows), 1.1215 (November and year lows), 1.1200, 1.1000 (the lower line of the downward channel on the weekly chart). Short positions are preferred. Support Levels: 1.1325, 1.1300, 1.1285, 1.1215, 1.1120, 1.1000 Resistance Levels: 1.1365, 1.1471, 1.1522 Trading recommendations Sell Stop 1.1310. Stop-Loss 1.1380. Take-Profit 1.1285, 1.1215, 1.1120, 1.1000 Buy Stop 1.1380. Stop-Loss 1.1310. Take-Profit 1.1471, 1.1522 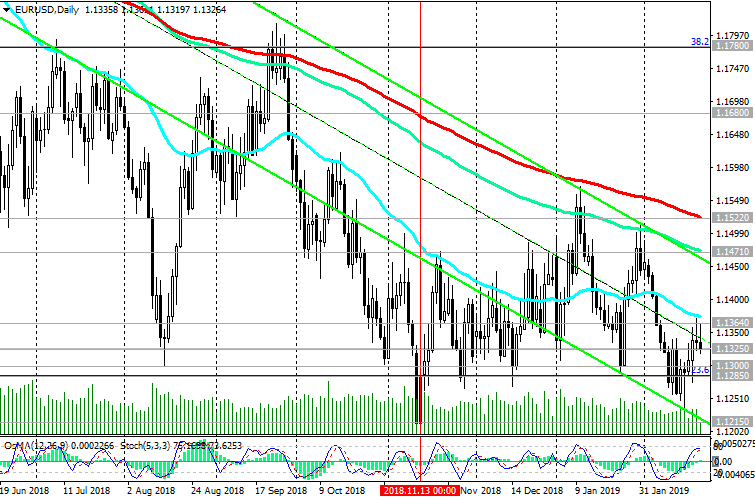 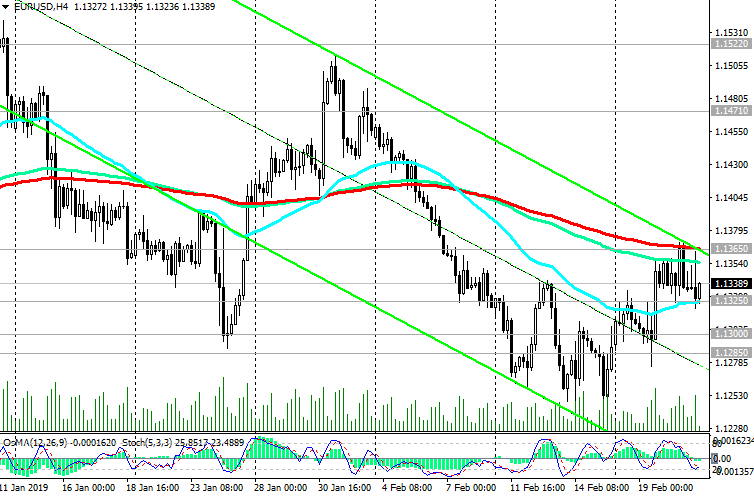 *) For up-to-date and detailed analytics and news on the forex market visit Tifia Forex Broker website tifia.com
|
|
#375
22-02-2019, 10:22
|
||||
|
||||
|
WTI: long positions are preferred
02/22/2019 Despite another increase in oil reserves in the US storages, oil prices continue to grow. According to the Energy Information Administration (EIA), the US Department of Energy, oil reserves in storage last week rose by 3.672 million barrels (the forecast was +3.080 million barrels). At the same time, oil production in the United States grew by 100,000 barrels to a record 12 million barrels per day. Thus, oil reserves in the United States rose to 455 million barrels, the highest level since November 17, 2017. The growth of oil prices contributes to a number of fundamental factors. Among them - the recovery of stock markets, investor optimism regarding the positive outcome of trade negotiations between the US and China, expectations of a further reduction in production at OPEC, increased risks of disruptions in oil supplies from Venezuela. On Friday, oil market participants will be waiting for the publication (at 18:00 GMT) of a weekly report from the American oilfield service company Baker Hughes on the number of active oil drilling rigs in the United States. Their number increased in the previous week and currently stands at 857 units, although this is below the maximum of 887 units reached at the end of 2018. At the moment, oil prices are recovering after falling in the 4th quarter of 2018 (oil prices in the end of December hit bottom near the mark of 42.00 dollars per barrel of WTI crude oil). Rising oil prices create an incentive for American oil companies to increase production, which, in turn, is a deterrent to rising oil prices. The increase in the number of drilling rigs is a negative factor for oil prices and creates prerequisites for the subsequent decline in oil prices. However, in the current situation, positive fundamental factors outweigh the negative ones, which creates prerequisites for a further increase in oil prices. *)An advanced fundamental analysis is available on the Tifia Forex Broker website at tifia.com/analytics To date, the price has reached the zone of important levels: resistance level 57.80 (EMA144 on the daily chart, Fibonacci 38.2% of the correction to the growth wave, which began in February 2016 with the support level near the level of 27.30), 59.00 (EMA200 on the daily chart) and support level 56.50 (EMA200 on the weekly chart). The indicators OsMA and Stochastic on the weekly and daily charts recommend long positions. Immediate growth targets are resistance levels 57.80, 59.00. In the case of a breakdown of the short-term support level of 55.50 (ЕМА200 on the 1-hour chart), the price will again go into the downward channel on the daily chart. This will return WTI oil prices to a bearish trend that began in October, with a target at the 42.20 support level (2017 and 2018 lows). In the current situation, long positions are preferred. Support levels: 56.50, 55.50, 53.80, 52.00, 50.25, 49.00, 46.00, 42.20 Resistance Levels: 57.80, 59.00, 60.00 Trading recommendations Sell Stop 55.40. Stop Loss 57.10. Take-Profit 53.80, 52.00, 50.25, 49.00, 46.00, 42.20 Buy Stop 57.10. Stop Loss 55.40. Take-Profit 57.80, 59.00, 60.00 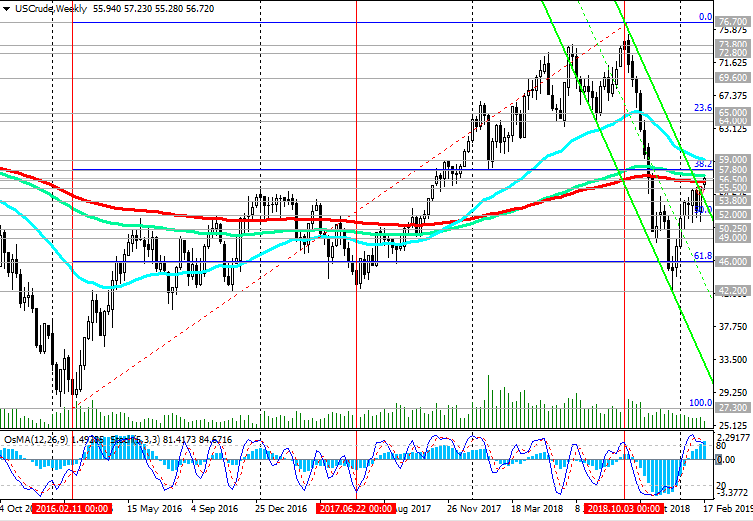  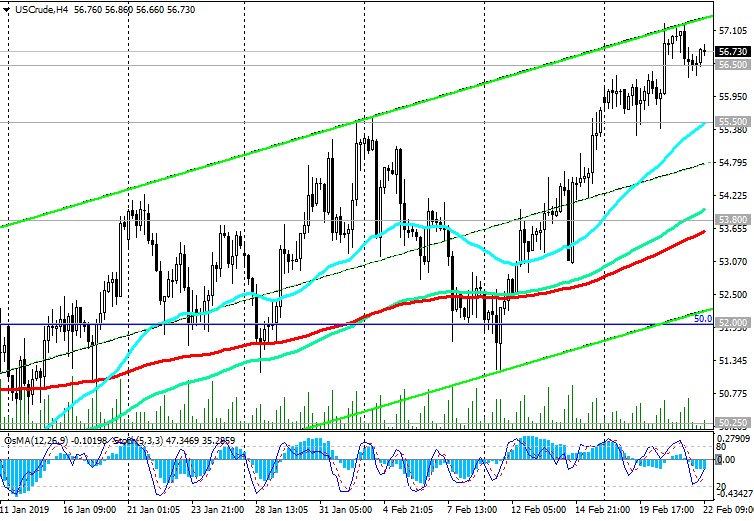 *) For up-to-date and detailed analytics and news on the forex market visit Tifia Forex Broker website tifia.com
|
|
#376
25-02-2019, 11:22
|
||||
|
||||
|
NZD/USD: investors' optimism returned to the markets
02/25/2019 Progress in trade negotiations between the United States and China contributed to the growth of world stock indices and the weakening of the US dollar. US President Donald Trump tweeted last Sunday that he intends to postpone the increase in fees scheduled for March 1, explaining that to significant progress towards a trade agreement. The new trade agreement between the two countries will end the trade war and revive investor optimism, pushing global stock markets to accelerate recovery after falling in the 4th quarter. China's leading stock indexes ended the trading session on Monday at new heights, thanks to optimism about the US-China trade negotiations. Leading stock indicators of the country on Monday rose by about 5.5%. For the Chinese stock exchanges, this was the best trading day since 2015. At the same time, the US dollar resumed its decline on Monday, including against the yuan and major commodity currencies, such as Canadian, Australian, New Zealand dollars. The pair NZD / USD was trading at the beginning of the European session near the level of 0.6890, which is 0.5% higher than the closing price of the previous week (at the level of 0.6842). The data, which indicated the growth of retail sales in New Zealand in the 4th quarter compared to the 3rd quarter (by 1.7% while the growth forecast was +0.5% and +0.3% in the previous quarter), also contributed the growth of the New Zealand dollar. This positive information was published at the beginning of the trading day on Monday. On Tuesday and Wednesday, Fed Chairman Jerome Powell will give a speech in the US Congress. If he shows a tendency toward a softer monetary policy, the US dollar will continue to decline, including against the NZD. *)An advanced fundamental analysis is available on the Tifia Forex Broker website at tifia.com/analytics Meanwhile, NZD / USD is developing a positive trend above key support levels of 0.6860 (Fibonacci level 23.6% of the upward correction to the global wave of the pair's decline from the level of 0.8800, started in July 2014; wave minima are near the level of 0.6260), 0.6815 (ЕМА200 on daily chart). Growth targets are resistance levels of 0.6970 (December highs and EMA144 on the weekly chart), 0.7070 (EMA200 on the weekly chart). So far, positive dynamics prevail. Above the support level of 0.6815 long positions are preferable. Support Levels: 0.6860, 0.6815, 0.6785, 0.6745, 0.6710, 0.6655, 0.6515, 0.6430 Resistance Levels: 0.6900, 0.6970, 0.7070 Trading recommendations Sell Stop 0.6850. Stop-Loss 0.6910. Take-Profit 0.6815, 0.6785, 0.6745, 0.6710, 0.6655, 0.6515, 0.6430 Buy Stop 0.6910. Stop Loss 0.6850. Take-Profit 0.6970, 0.7070  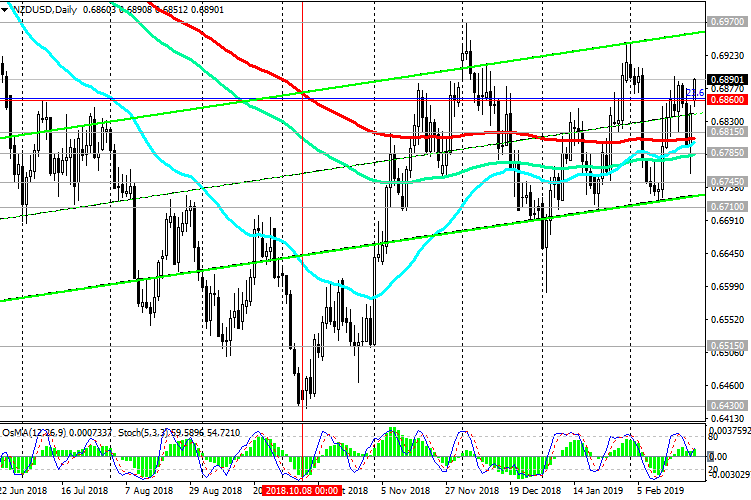 *) For up-to-date and detailed analytics and news on the forex market visit Tifia Forex Broker website tifia.com
|
|
#377
26-02-2019, 10:53
|
||||
|
||||
|
EUR/USD: dollar is under pressure
26/02/2019 The dollar continues to decline on Tuesday, while DXY dollar index futures have been trading down for the third consecutive day. The pressure on the dollar have expectations of an early conclusion of a trade agreement between the United States and China. As you know, over the weekend, trade negotiations between the US and China ended. US President Donald Trump on his Twitter wrote that he had made significant progress on a number of issues, and he could postpone the increase in import duties on Chinese goods scheduled for March 2. Investors are also waiting for speeches on Tuesday and Wednesday of Fed Chairman Jerome Powell. He should speak to the US Congress with a semi-annual report. Any hints of Powell to pause in the interest rate increase, and this is the most likely scenario, will cause a decrease in the dollar. Pressure on the dollar index also had a sharp increase in the pound after reports appeared in the media that the leader of the Labor Party, Jeremy Corbin, announced his partys intention to either support or suggest holding a second referendum on the British withdrawal from the EU. *)An advanced fundamental analysis is available on the Tifia Forex Broker website at tifia.com/analytics Meanwhile, the EUR / USD pair is trying to continue to grow above the short-term support level of 1.1338 (ЕМА200 on the 1-hour chart). However, this is hampered by the strong resistance level of 1.1365 (EMA200 on the 4-hour chart, EMA50 on the daily chart). In case of its breakthrough, EUR / USD will move to resistance levels of 1.1465 (EMA144 on the daily chart), 1.1515 (EMA200 on the daily chart). The decline scenario will be associated with the breakdown of the support level of 1.1338 and a decline to the support levels of 1.1270 (December lows), 1.1215 (November and year lows), 1.1200. Support Levels: 1.1338, 1.1300, 1.1285, 1.1215, 1.1120, 1.1000 Resistance Levels: 1.1365, 1.1465, 1.1515 Trading scenarios Sell Stop 1.1330. Stop-Loss 1.1380. Take-Profit 1.1300, 1.1285, 1.1215, 1.1120, 1.1000 Buy Stop 1.1380. Stop-Loss 1.1330. Take-Profit 1.1465, 1.1515    *) For up-to-date and detailed analytics and news on the forex market visit Tifia Forex Broker website tifia.com
|
|
#378
28-02-2019, 14:55
|
||||
|
||||
|
XAU/USD: Current trend
02/28/2019 The dollar index stopped falling after the publication of stronger than expected US GDP data. According to the data released on Thursday by the US Department of Commerce, gross domestic product, a broad indicator of goods and services produced in the United States, rose by 2.6% per annum in the 4th quarter (the forecast was + 2.2%). GDP growth by 2.6% was lower than economic growth by 3.4% in the 3rd quarter and 4.2% in the 2nd quarter. The pace of economic activity slowed down as consumers limited their spending and the housing market held back economic growth. This report by the Ministry of Commerce states that the decrease in services provided by the federal government due to the partial shutdown, that started on December 22 made a negative contribution to GDP growth of 0.1 percentage point in the 4th quarter. Consumer spending, which is more than two-thirds of US GDP, rose by 2.8% per annum in the 4th quarter after rising by 3.5% in the 3rd quarter. Americans' spending on services and consumer goods and short-term use has become more moderate. Nevertheless, the dollar reacted positively to the information provided. In the first half of the trading day on Thursday, the dollar was falling, and DXY dollar index futures, reflecting the value of the dollar against a basket of 6 major world currencies, were traded before the publication of US GDP data near the 95.75 mark, 25 points lower than the opening price of today's trading day. However, the DXY dollar index rose sharply after the publication of GDP data and moved to positive territory, above the 96.00 mark. In the first half of the trading day, investors increased the demand for defensive assets such as the yen, franc, and gold. However, the publication of positive information on US GDP strengthened the demand for the dollar and caused the sale of gold. *)An advanced fundamental analysis is available on the Tifia Forex Broker website at tifia.com/analytics At the same time, the XAU / USD pair maintains a positive trend, trading in the ascending channel on the daily chart, the upper limit of which passes near the mark of 1357.00 (2017 highs). In case of breakdown of a strong resistance level of 1326.00 (ЕМА200 on the 1-hour chart) the immediate goal of XAU / USD growth will be a local resistance level of 1346.00 (February and 2019 highs). In the case of renewed decline and breakdown of the support level of 1310.00 (ЕМА200 on the 4-hour chart) XAU / USD may decline to the key support level of 1266.00 (ЕМА200 on the weekly and daily charts) and further with the goals of decline at support levels of 1197.00 (November lows) , 1185.00 (Fibonacci level 23.6% of the correction to the wave of decline since July 2016), 1160.00 (minimums of 2018). Support Levels: 1316.00, 1310.00, 1303.00, 1297.00, 1277.00, 1266.00, 1248.00 Resistance Levels: 1326.00, 1346.00, 1357.00, 1365.00, 1370.00, 1375.00 Trading recommendations Sell Stop 1314.00. Stop Loss 1331.00. Take-Profit 1310.00, 1303.00, 1297.00, 1277.00, 1266.00, 1248.00, 1234.00, 1220.00, 1197.00, 1185.00, 1160.00 Buy Stop 1331.00. Stop Loss 1314.00. Take-Profit 1346.00, 1357.00, 1365.00, 1370.00, 1375.00 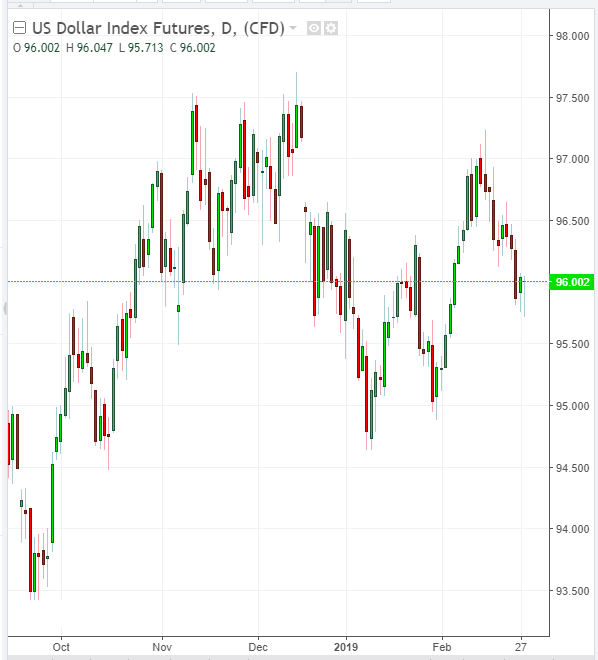 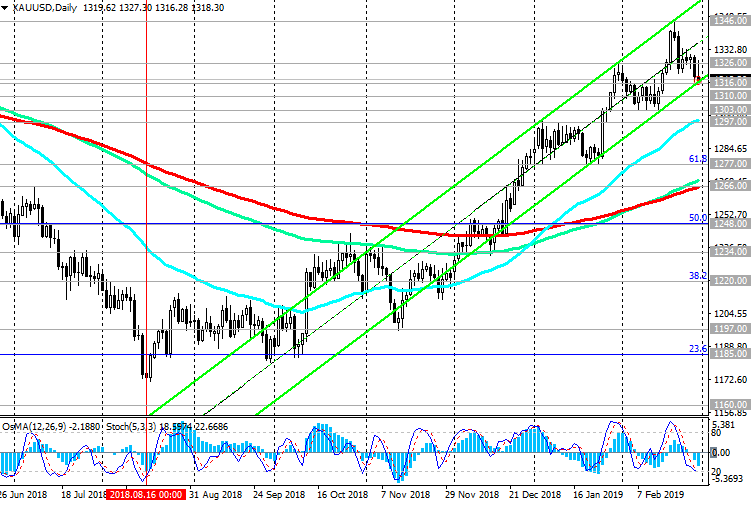 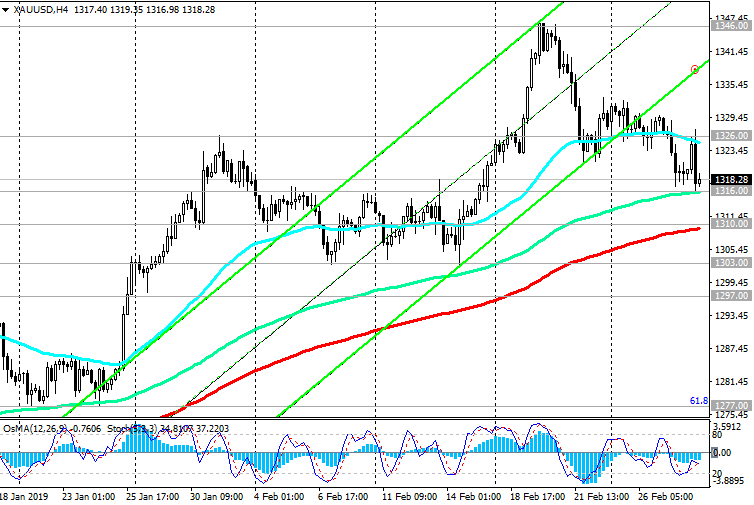 *) For up-to-date and detailed analytics and news on the forex market visit Tifia Forex Broker website tifia.com
|
|
#379
01-03-2019, 11:57
|
||||
|
||||
|
USD/CAD: Current Dynamics
03/01/2019 The US dollar declines on Friday against commodity currencies such as Australian, New Zealand and Canadian dollars. Participants in the financial market are inspired by the expectations of a speedy conclusion of a new trade agreement between China and the United States. As reported by the Bloomberg News agency on Thursday, the American negotiators will soon complete the preparation of a trade agreement with China, which may be signed in the coming weeks. The United States expects to complete the preparation of the agreement by mid-March, when President Donald Trump may meet with Chinas leader Xi Jinping. US Treasury Secretary Stephen Mnuchin said Thursday that a 150-page document was being prepared, noting that "there is still a lot of work left". Earlier on Thursday, Larry Cudlow, director of the National Economic Council of the United States, said he had made "amazing" progress, and the signing of the agreement was approaching. World stock indices resumed their growth on Friday, while positive macro data came from China, indicating growth in the country's manufacturing sector. The final index of purchasing managers (PMI) for the manufacturing sector of China from Caixin in February was 49.9 against 48.3 in January, recovering to a 3-month high. Also, the growth of these currencies, including CAD, contributed by the growth of oil and commodity prices. *)An advanced fundamental analysis is available on the Tifia Forex Broker website at tifia.com/analytics USD / CAD is dropping on Friday. However, USD / CAD found support at a key level of 1.3135 (ЕМА200 on the daily chart). Strong support levels of 1.3235 (ЕМА200 on the 4-hour chart), 1.3182 (ЕМА200 on the 1-hour chart, ЕМА144 on the daily chart) are broken. Breakdown of support level 1.3135 will accelerate further decline. In this case, the USD / CAD will go to support levels 1.3090, 1.3020 (the bottom line of the downward channel on the daily chart). A return to the zone above the resistance level of 1.3235 will cause a resumption of the upward trend and the growth of USD / CAD with the closest targets at the local resistance levels of 1.3340, 1.3370. Support Levels: 1.3135, 1.3100, 1.3090, 1.3020 Resistance Levels: 1.3182, 1.3235, 1.3340, 1.3370, 1.3450, 1.3600, 1.3665, 1.3790 Trading Scenarios Sell Stop 1.3110. Stop Loss 1.3190. Take-Profit 1.3090, 1.3020 Buy Stop 1.3190. Stop Loss 1.3110. Take-Profit 1.3235, 1.3340, 1.3370, 1.3450, 1.3600, 1.3665, 1.3790 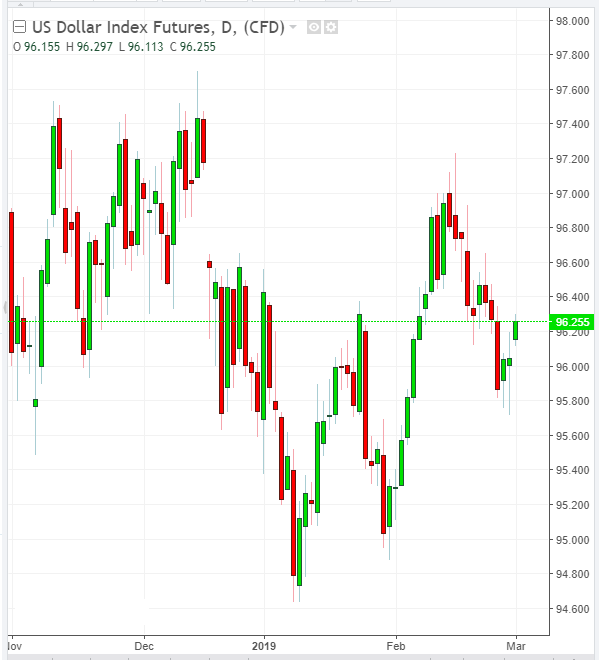  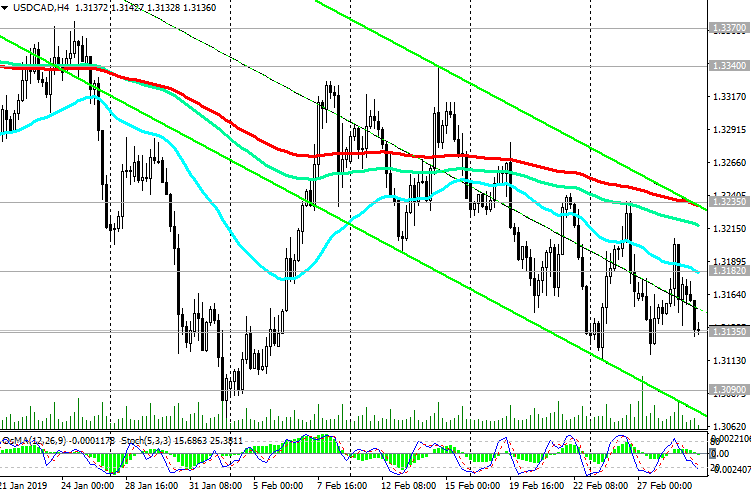 *) For up-to-date and detailed analytics and news on the forex market visit Tifia Forex Broker website tifia.com
|
|
#380
04-03-2019, 11:15
|
||||
|
||||
|
AUD/USD: on the eve of the RBA meeting
03/04/2019 Investor sentiment has recently improved by easing tensions in trade relations between the United States and China. Waiting for the early conclusion of a new trade agreement between the United States and China, commodity currencies, primarily the Australian dollar, rose at the beginning of today's trading day. The AUD / USD opened trading near the level of 0.7105, which is about 30 points higher than the closing price on Friday. However, in the first half of the trading day, the AUD / USD decline resumed after the publication of weak macro data received in the morning from Australia. At the beginning of the US trading session, the AUD / USD pair will trade near the 0.7085 mark. On Tuesday, the RB of Australia makes a decision on the interest rate. The publication of the decision on rates is scheduled for 03:30 (GMT). In February, the RBA did not change interest rates, expressing a cautious propensity to increase them, given the increasing internal and external risks. Probably, at tomorrow's meeting, the RBA will also signal an intention to continue to maintain the current monetary policy unchanged. Interest rates may remain unchanged even longer, given the weak wage growth and slowdown in the Australian economy. "The Board does not see a weighty argument in favor of adjusting the key interest rate in the short term", said one of the latest statements of the RBA. Economists also warn that due to the weak housing market and the continued weakening of housing prices in large cities, the RBA will not change rates until 2020. In view of this, and also against the background of the strengthening US dollar, the AUD / USD will continue to decline. *)An advanced fundamental analysis is available on the Tifia Forex Broker website at tifia.com/analytics Downward trend resumed. AUD / USD continues to trade in a bearish trend and downward channel on the weekly chart, the lower limit of which passes near the level of 0.6600. Below the key resistance level of 0.7260 (ЕМА200 on the daily chart), short positions with targets at the support levels of 0.6910 (lows of September 2015), 0.6830 (2016 lows) are preferable. Consideration of long positions can be returned only after the breakdown of the local resistance level of 0.7140 (ЕМА50 on the daily chart, ЕМА200 on the 4-hour chart). Growth above the resistance level of 0.7260 is unlikely. Support Levels: 0.7055, 0.7025 Resistance Levels: 0.7125, 0.7140, 0.7180, 0.7210, 0.7260 Trading Scenarios Sell Stop 0.7070. Stop Loss 0.7110. Take-Profit 0.7055, 0.7025, 0.6910, 0.6830 Buy Stop 0.7110. Stop Loss 0.7070. Take-Profit 0.7125, 0.7140, 0.7180, 0.7210, 0.7260 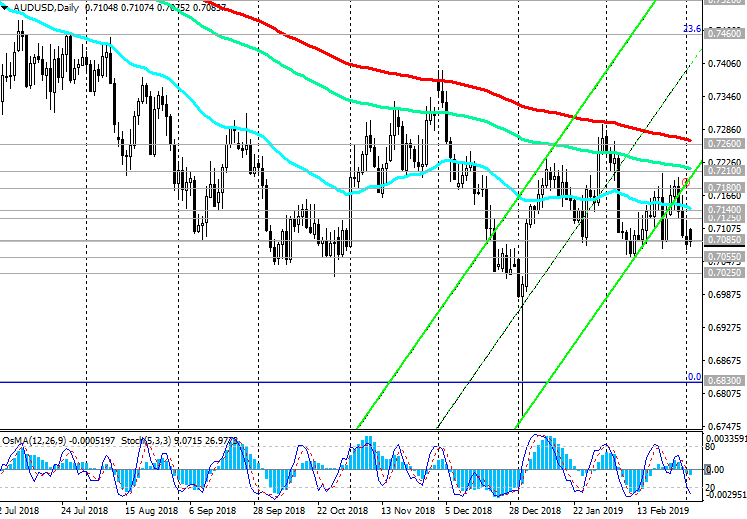 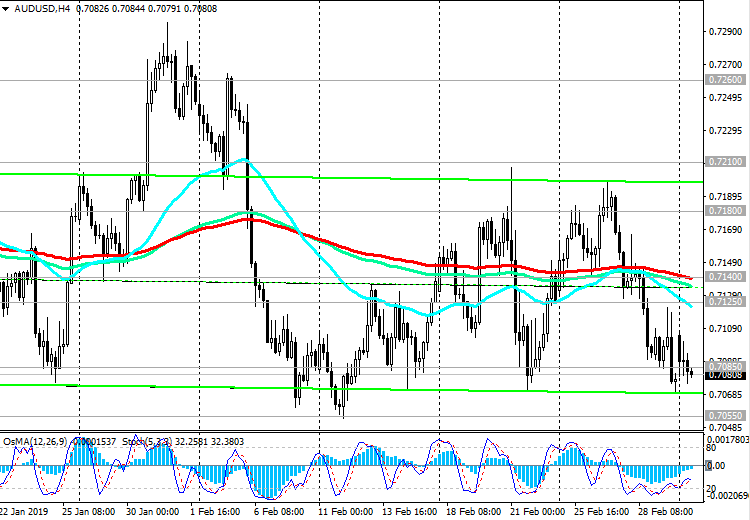  *) For up-to-date and detailed analytics and news on the forex market visit Tifia Forex Broker website tifia.com
|
|
#381
05-03-2019, 11:24
|
||||
|
||||
|
USD/CHF: Current dynamics on 03/05/2019
The US dollar continues to strengthen in the foreign exchange market, and futures for the dollar index DXY, which tracks the US currency against a basket of 6 other major currencies, are growing on Tuesday for the fifth consecutive day and are trading at 96.65 at the beginning of the European session, 33 points higher than the opening price at the beginning of the week. As the data published last week showed, the US economy remains one of the fastest growing in the world. Gross domestic product in the 4th quarter grew by 2.6% per annum (the forecast was +2.2%). GDP growth by 2.6% was lower than economic growth by 3.4% in the 3rd quarter and 4.2% in the 2nd quarter. Nevertheless, last year was characterized by strong economic growth in the United States. Another positive aspect of the report on GDP, published on Thursday, was the growth of companies' investments. As for the internal situation, I think that the economy is in good condition. Unemployment is low, confidence is still positive, so it seems to me that we have good prospects, said the chairman of the Federal Reserve Jerome Powell Systems in the Senate Banking Committee. Now market participants will closely monitor the publication on Friday (13:30 GMT) of data from the US labor market. Along with data on inflation and GDP, labor market data are crucial for the Fed when planning monetary policy for the coming months. Strong data are expected. With their confirmation, the dollar will continue to strengthen, including against the franc, despite the continued high demand for it as a refuge currency. *)An advanced fundamental analysis is available on the Tifia Forex Broker website at tifia.com/analytics Meanwhile, the USD / CHF resumed an upward trend, bargaining in the upward channel on the daily chart, the upper limit of which passes above the level of 1.0160 (March 2017 highs). Positive dynamics is maintained. Long positions are preferred. In the case of the breakdown of important short-term support levels of 0.9998 (ЕМА200 on the 1-hour chart), 0.9985 (ЕМА200 on the 4-hour chart) a signal appears to open short positions with targets at the support levels of 0.9900 (ЕМА200 on the daily chart), 0.9770 (ЕМА200 on the weekly chart), 0.9745 (Fibonacci level 50%), 0.9720 (January lows). Support Levels: 0.9998, 0.9985, 0.9970, 0.9925, 0.9900, 0.9875, 0.9800, 0.9770, 0.9745, 0.9720, 0.9650, 0.9615, 0.9545 Resistance Levels: 1.0040, 1.0090, 1.0130, 1.0160 Trading recommendations Sell Stop 0.9980. Stop Loss 1.0025. Take-Profit 0.9970, 0.9925, 0.9900, 0.9875, 0.9800, 0.9770, 0.9745 Buy Stop 1.0025. Stop Loss 0.9980. Take-Profit 1.0040, 1.0090, 1.0130, 1.0160   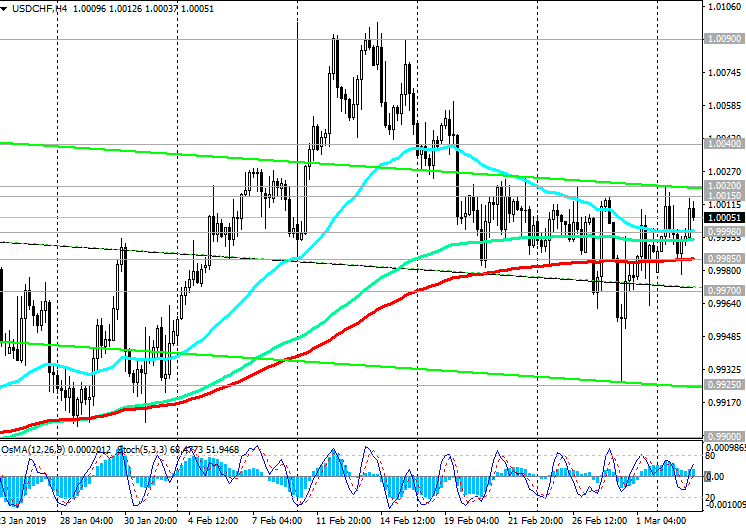 *) For up-to-date and detailed analytics and news on the forex market visit Tifia Forex Broker website tifia.com
|
|
#382
06-03-2019, 10:45
|
||||
|
||||
|
EUR/USD: Eurodollar remains under pressure
06/03/2019 Despite the positive macro statistics received on Tuesday from Europe, the Eurodollar could not strengthen. Moreover, on Tuesday, the EUR / USD pair fell, losing about 30 points, to the level of 1.1308. Reducing the pair is contributed by the general strengthening of the dollar, and expectations of restrained statements at tomorrow's meeting of the ECB regarding the prospects for monetary policy. As expected, the ECB will maintain its current monetary policy and reduce expectations for growth of the European economy and inflation in the Eurozone. Many market participants expect the rate to be raised by the ECB not earlier than mid-2020. *)An advanced fundamental analysis is available on the Tifia Forex Broker website at tifia.com/analytics On Wednesday, the EUR / USD remains under pressure, bargaining near the local support level of 1.1300. In the event of a breakdown of this support level, EUR / USD will move to targets at support levels of 1.1270 (December lows), 1.1215 (November and year lows), 1.1200, 1.1120, 1.1000. Purchases with targets at resistance levels 1.1455 (ЕМА144 on the daily chart), 1.1505 (ЕМА200 on the daily chart) are possible only after the breakdown of the resistance level 1.1360 (ЕМА200 on the 4-hour chart, ЕМА50 on the daily chart). The long-term bearish trend, which began in May 2014 near the 1.3870 mark, remains. Short positions are preferred. Support Levels: 1.1300, 1.1285, 1.1215, 1.1120, 1.1000 Resistance Levels: 1.1342, 1.1360, 1.1455, 1.1505 Trading recommendations Sell in the market. Stop-Loss 1.1345. Take-Profit 1.1285, 1.1215, 1.1120, 1.1000 Buy Stop 1.1350. Stop Loss 1.1280. Take-Profit 1.1400, 1.1455, 1.1500  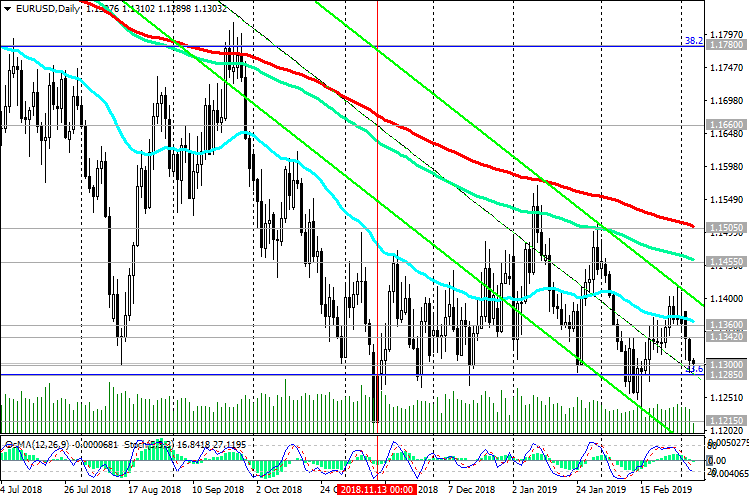 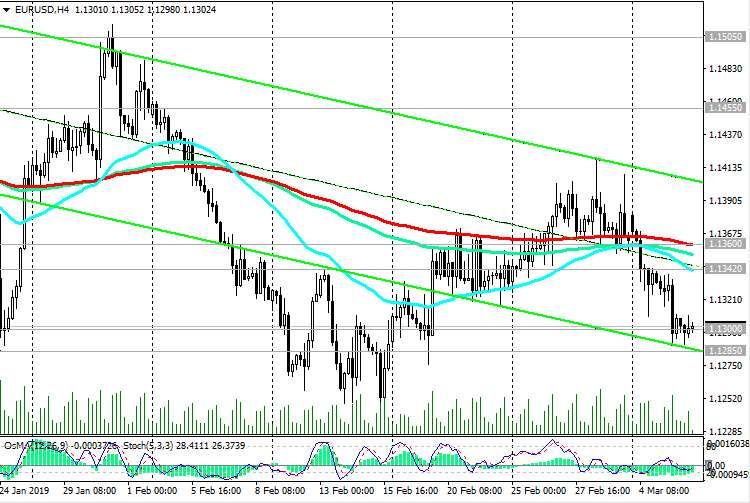 *) For up-to-date and detailed analytics and news on the forex market visit Tifia Forex Broker website tifia.com
|
|
#383
07-03-2019, 11:18
|
||||
|
||||
|
EUR/USD: ECB meeting and press conference may drop the euro
03/07/2019 Current Dynamics As the EU Statistical Agency reported on Thursday, Eurozone GDP in the 4th quarter of 2018 grew by 0.9% (year on year) after increasing by 0.6% in the 3rd quarter. Eurozone GDP in the 4th quarter of 2018 grew by only 1.1% compared with the same period of the previous year, which was the lowest annual growth rate since 2013. At the same time, the US economy in the 4th quarter of 2018 increased by 3.1%. On Thursday, the attention of market participants will be focused on the meeting and press conference of the ECB, which will begin at 13:30 (GMT). As expected, the monetary policy of the bank will remain unchanged. Investors are interested in signals about the possible actions of the ECB in the event of a steady slowdown in the growth of the Eurozone economy. On Wednesday, the Organization for Economic Cooperation and Development lowered its forecast for economic growth in the Eurozone for 2019 to 1%, while it had previously expected a growth of 1.8%. If the ECB signals a new round of targeted long-term refinancing operations (TLTRO) or a management propensity to ease monetary policy, the euro could decline significantly. *)An advanced fundamental analysis is available on the Tifia Forex Broker website at tifia.com/analytics On Thursday, the EUR / USD pair remains under pressure, bargaining near the local support level of 1.1300. In the event of a breakdown of this level, EUR / USD will move to targets at support levels of 1.1270 (December lows), 1.1215 (November and year lows), 1.1200, 1.1120, 1.1000. Long positions can be returned only if EUR / USD is fixed above the resistance level of 1.1360 (ЕМА200 on the 4-hour chart, ЕМА50 on the daily chart). The targets are at resistance levels of 1.1455 (EMA144 on the daily chart), 1.1505 (EMA200 on the daily chart). The long-term bearish trend, which began in May 2014 near the 1.3870 mark, remains. Short positions are preferred. Support Levels: 1.1300, 1.1285, 1.1215, 1.1120, 1.1000 Resistance Levels: 1.1342, 1.1360, 1.1455, 1.1505 Trading recommendations Sell in the market. Stop-Loss 1.1340. Take-Profit 1.1285, 1.1215, 1.1120, 1.1000 Buy Stop 1.1340. Stop Loss 1.1280. Take-Profit 1.1400, 1.1455, 1.1500 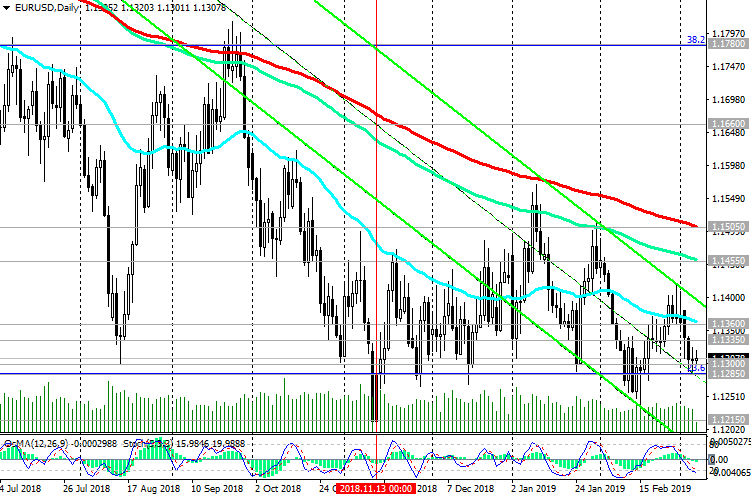 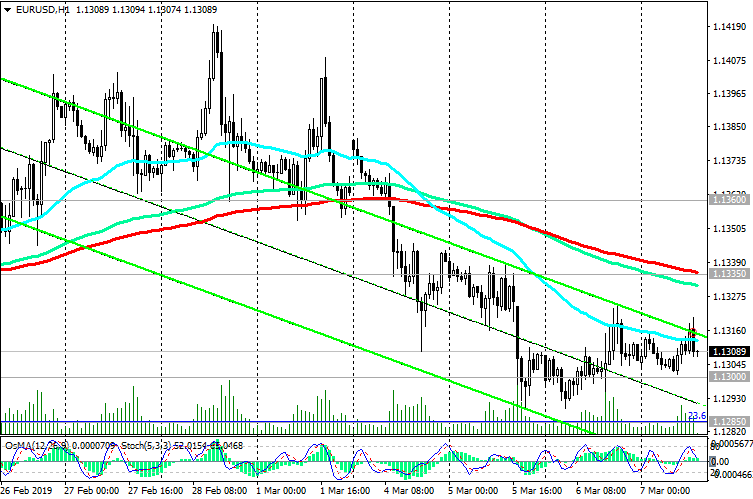 *) For up-to-date and detailed analytics and news on the forex market visit Tifia Forex Broker website tifia.com
|
|
#384
11-03-2019, 12:06
|
||||
|
||||
|
EUR/USD: the dollar is likely to continue to strengthen
03/11/2019 After the published report on the labor market, investors' concerns that the global economic slowdown could have spread to the United States increased, and the likelihood of easing of the Feds monetary policy also increased. As the US Department of Labor reported last Friday, unemployment in the country fell to 3.8% in February against 4.0% in January, the average hourly earnings in the private sector increased by 11 cents and amounted to $ 27.66. However, the number of jobs outside of US agriculture in February increased by 20,000. Economists had expected that the number of jobs in February would grow by 180,000, and unemployment would be 3.9%. And yet, according to economists, the attractiveness of the dollar to investors will grow over the next few months. Despite the downturn in the global economy, the US economy looks more resilient compared to other major economies in the world. The dollar will continue to strengthen in the foreign exchange market. At the same time, the euro remains under pressure after the ECB meeting last week. The outlook for the European economy has worsened, according to the ECB management. The head of the ECB, Mario Draghi, said that the GDP growth in the Eurozone in 2019 will be 1.1%, not 1.7%, in 2020, 1.6%, and not 1.7% as previously planned. The ECB announced a new program of target long-term refinancing, which was a surprise to investors. *)An advanced fundamental analysis is available on the Tifia Forex Broker website at tifia.com/analytics The euro fell sharply last week, and the EUR / USD pair fell 1% (or 114 points) to 1.1191. On Thursday, the multi-month low was recorded at 1.1177. The ECB will have to forget about the early start of the interest rate increase cycle. A further weakening of the euro and a decline in the EUR / USD pair are likely. After the breakdown of the local support level of 1.1225, EUR / USD will move to the targets at the support levels of 1.1185, 1.1120, 1.1000. The long-term bearish trend, which began in May 2014 near the 1.3870 mark, remains. Short positions are preferred. Support Levels: 1.1225, 1.1185, 1.1120, 1.1000 Resistance Levels: 1.1260, 1.1285, 1.1300, 1.1340, 1.1450, 1.1500 Trading recommendations Sell Stop 1.1215. Stop Loss 1.1275. Take-Profit 1.1185, 1.1120, 1.1000 Buy Stop 1.1275. Stop Loss 1.1215. Take-Profit 1.1285, 1.1300, 1.1340, 1.1450, 1.1500 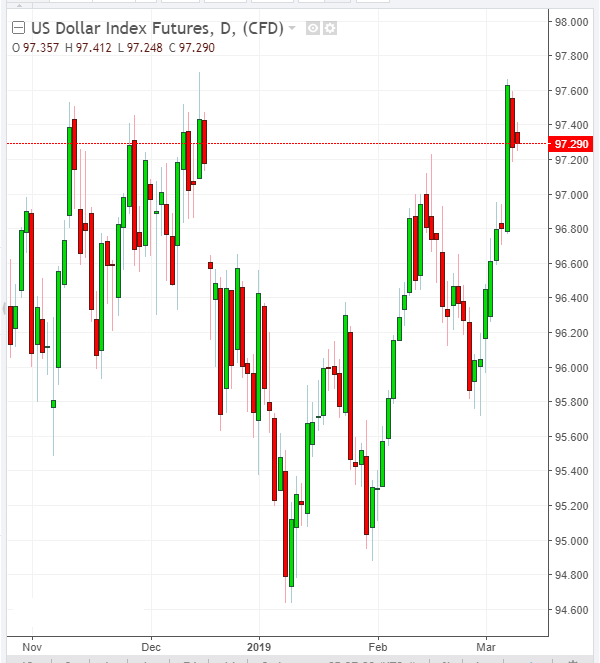 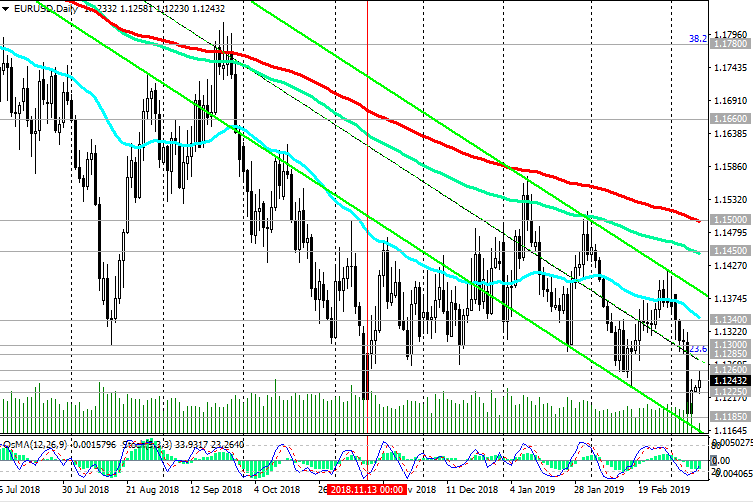 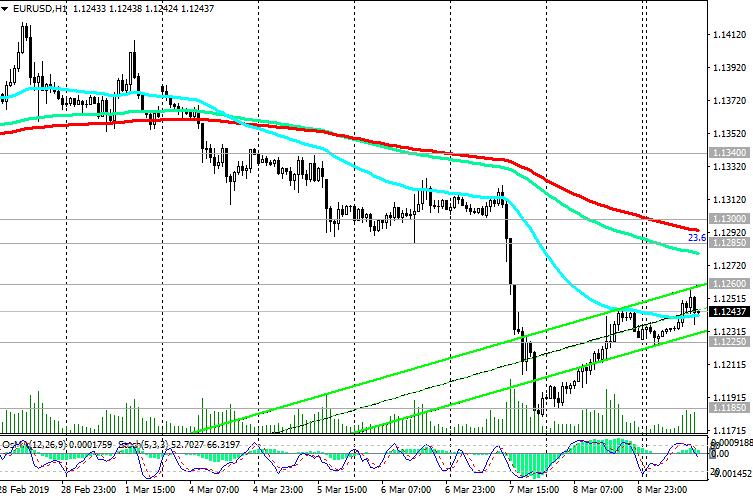 *) For up-to-date and detailed analytics and news on the forex market visit Tifia Forex Broker website tifia.com
|
|
#385
12-03-2019, 12:24
|
||||
|
||||
|
GBP/USD: Trading Scenarios
03/12/2019 The British pound fell after the publication of data on the trade deficit, which exceeded market expectations. The trade deficit in January rose to 13.1 billion pounds from the December figure of 12.7 billion pounds. Other data pointed to a recovery in the growth of the British economy in January after a weak December. GDP growth in November-January on an annualized basis amounted to 1.1% versus 0.9% in the previous three months. Meanwhile, the greatest impact on the pound have expectations regarding the upcoming parliamentary vote on Brexit. The pair GBP / USD declined in the first half of the European session and at the time of writing this article was trading down 140 points to the opening price of the trading day near 1.3040. Through this mark passes a strong level of support in the form of a 200-period moving average on the daily chart. *)An advanced fundamental analysis is available on the Tifia Forex Broker website at tifia.com/analytics In the event of a breakdown of a lower support level of 1.3000 (EMA144 on the daily chart), GBP / USD will go to support levels of 1.2785 (February lows), 1.2700. A more distant target for the decline is the support level of 1.2400 (lows of 2018, 2019). In the case of GBP / USD growth and its return to the zone above the short-term resistance level of 1.3130 (ЕМА200 on the 1-hour chart), further strengthening and growth to the resistance level of 1.3400 (the upper limit of the ascending channel on the daily chart) is likely. The distant target is at the resistance level of 1.3670 (ЕМА200 on the weekly chart) and higher. Support Levels: 1.3040, 1.3000, 1.2800, 1.2785, 1.2700, 1.2670, 1.2600, 1.2485, 1.2400 Resistance Levels: 1.3100, 1.3130, 1.3210, 1.3300, 1.3400, 1.3670 Trading scenarios Sell Stop 1.2990. Stop Loss 1.3140. Take-Profit 1.2800, 1.2785, 1.2700, 1.2670, 1.2600, 1.2485, 1.2400 Buy Stop 1.3140. Stop Loss 1.2990. Take-Profit 1.3210, 1.3300, 1.3400, 1.3670 *) For up-to-date and detailed analytics and news on the forex market visit Tifia Forex Broker website tifia.com
|
|
#386
13-03-2019, 12:11
|
||||
|
||||
|
GBP/USD: Current Dynamics
13/03/2019 The pound is regaining its position after a sharp fall on Tuesday, when the British parliament again voted against the version of the Brexit agreement proposed by Prime Minister Theresa May. Now lawmakers on Wednesday will vote on the issue of leaving the EU on March 29 without a deal. If they vote against, then on Thursday there will be a vote on the question of postponing the exit date from March 29 to a later date. The GBP / USD maintains a positive trend, trading above key support levels of 1.3050 (ЕМА200 on the daily and 4-hour charts), 1.3000 (ЕМА144 on the daily chart). In case of continued growth and after the breakdown of the resistance level of 1.3210 (Fibonacci level 23.6% of the correction to the decline of GBP / USD in the wave that started in July 2014 near 1.7200) GBP / USD will aim to the resistance levels 1.3300, 1.3400 (upper limit of the ascending channel on the daily chart), 1.3670 (ЕМА200 on the weekly chart). Short positions will become relevant after the GBP / USD decline to a zone below the support level of 1.3000. The signal for the resumption of sales of GBP / USD will be the breakdown of the short-term support level of 1.3123 (ЕМА200 on the 1-hour chart). Support Levels: 1.3123, 1.3050, 1.3000, 1.2800, 1.2785, 1.2700, 1.2670, 1.2600, 1.2485, 1.2400 Resistance Levels: 1.3210, 1.3300, 1.3400, 1.3670 Trading Recommendations Sell Stop 1.3090. Stop Loss 1.3170. Take-Profit 1.3050, 1.3000, 1.2800, 1.2785, 1.2700, 1.2670, 1.2600, 1.2485, 1.2400 Buy Stop 1.3170. Stop Loss 1.3090. Take-Profit 1.3210, 1.3300, 1.3400, 1.3670 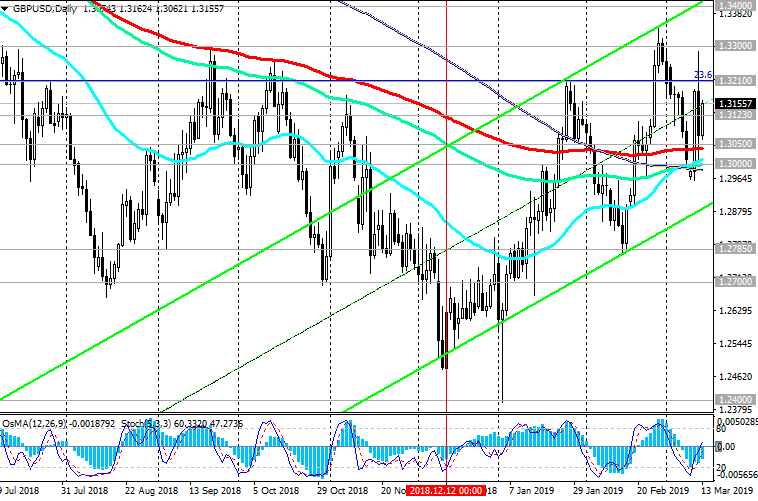 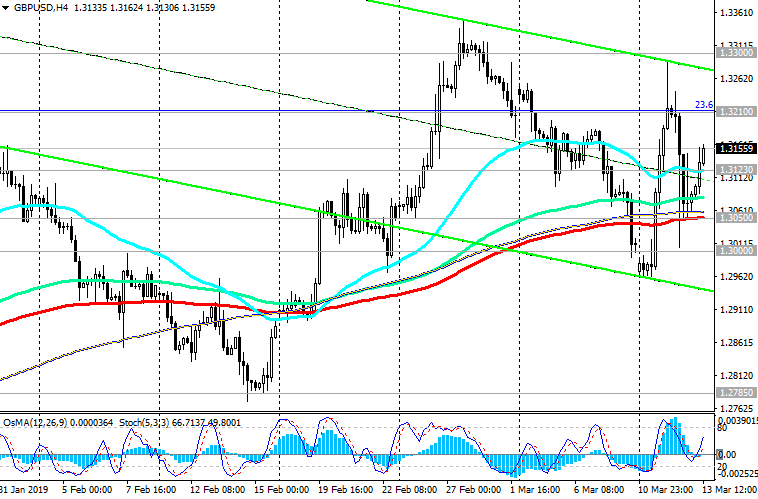 *) For up-to-date and detailed analytics and news on the forex market visit Tifia Forex Broker website tifia.com
|
|
#387
14-03-2019, 12:50
|
||||
|
||||
|
EUR/USD: dollar strengthened
14/03/2019 The dollar index DXY, reflecting the value of the dollar against a basket of 6 currencies, is growing on Thursday. In the middle of the European session, futures for the DXY dollar index traded near the 96.75 mark, 25 points higher than the opening price of today. As the National Bureau of Statistics of China reported on Thursday, industrial production in the country in January-February increased by 5.3% compared with the same period last year, after an annual growth of 5.7% in December. At the beginning of 2019, the growth of the Chinese economy slowed down. Industrial production growth was weak, despite some recovery in investment. In a situation of international trade wars, the US economy looks more stable compared to other major world economies. This increases the investment attractiveness of the dollar and US assets. Dollar growth also resumed after US President Donald Trump warned Beijing on Wednesday that he would not sign a trade agreement that would not take into account Washingtons demands. On Thursday, the focus of traders' attention is the vote in the British Parliament on the postponement of the country's withdrawal from the EU from March 29 to a later date. However, further developments are still very uncertain, which creates prerequisites for maintaining the situation of increased volatility in the financial market. The situation around Brexit is reflected both in quotes of the pound and in quotations of the euro. *)An advanced fundamental analysis is available on the Tifia Forex Broker website at tifia.com/analytics On Thursday, the EUR / USD is falling amid a stronger dollar. Probably further fall of the Eurodollar. The outlook for the European economy has worsened, according to the ECB management. The head of the ECB, Mario Draghi, after the last meeting of the ECB, said that the GDP growth in the Eurozone in 2019 will be 1.1%, not 1.7%, in 2020 1.6%, and not 1.7%, as planned earlier. The ECB announced a new program of target long-term refinancing, which was a surprise to investors. The euro fell sharply last week, and the EUR / USD pair fell 1% (or 114 points) to 1.1191. Last Thursday the multi-month minimum was fixed at 1.1177. In the event of a breakdown of support levels of 1.1300, 1.1285 (Fibonacci level 23.6% of the correction to the fall from the level of 1.3900, which began in May 2014), EUR / USD will head towards targets at support levels of 1.1185, 1.1120, 1.1000. The long-term bearish trend, which began in May 2014 near the 1.3870 mark, remains. Short positions are preferred. Long positions will become relevant after EUR / USD is fixed in the zone above the resistance level of 1.1330 (ЕМА200 on the 4-hour chart, ЕМА50 on the daily chart). Support Levels: 1.1300, 1.1285, 1.1260, 1.1225, 1.1185, 1.1120, 1.1000 Resistance Levels: 1.1330, 1.1435, 1.1490 Trading recommendations Sell Stop 1.1280. Stop-Loss 1.1340. Take-Profit 1.1260, 1.1225, 1.1185, 1.1120, 1.1000 Buy Stop 1.1340. Stop Loss 1.1280. Take-Profit 1.1435, 1.1500 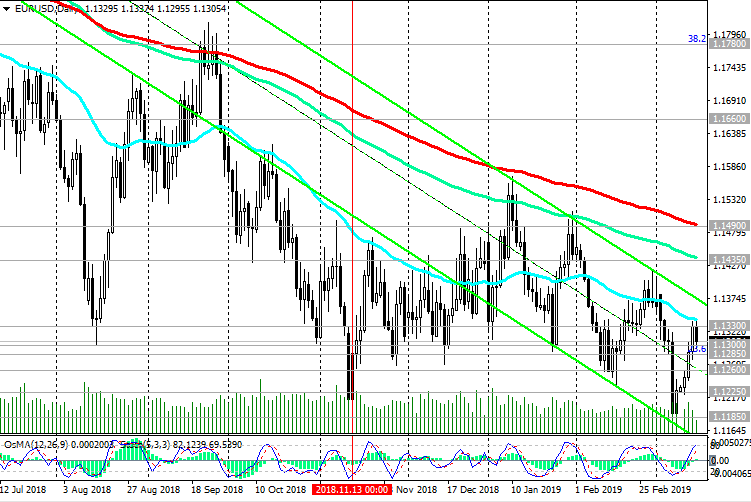 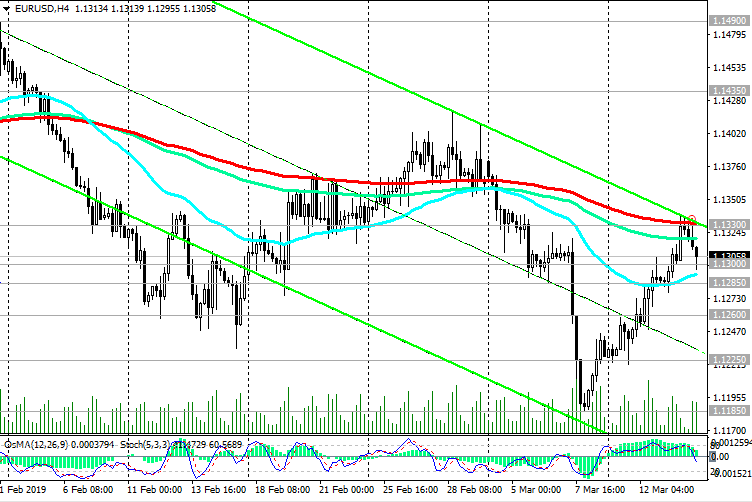 *) For up-to-date and detailed analytics and news on the forex market visit Tifia Forex Broker website tifia.com
|
|
#388
15-03-2019, 10:58
|
||||
|
||||
|
WTI: oil prices likely to rise further
03/15/2019 Current dynamics Oil prices are rising again on Friday, receiving support from data on US oil reserves, published on Wednesday. As the Energy Information Administration (EIA) of the US Department of Energy reported, oil reserves in the US last week unexpectedly fell by 3.9 million barrels to 449.1 million barrels (the forecast was +1.9 million barrels). The US restrictions on oil exports from Iran and Venezuela also contribute to a more significant reduction in world supply and higher oil prices. The United States intends to reduce the supply of oil from Iran by about 20%. On Friday at 17:00 (GMT), the American oilfield service company Baker Hughes will publish a weekly report on the number of oil drilling rigs in the United States. To date, the number of active rigs in the United States is 834 active rigs, which is much lower than the maximum of 887 units, achieved at the end of 2018. The increase in the number of active drilling rigs will support oil prices. *)An advanced fundamental analysis is available on the Tifia Forex Broker website at tifia.com/analytics On Thursday, WTI crude prices hit a high in 2019 near $58.67 a barrel, and oil prices continue to rise on the first half of the trading day on Friday. In case of consolidation above the key support level of 58.60 (ЕМА200 on the daily chart), further price growth is likely. So far, WTI oil is trading above important support levels of 55.50 (ЕМА200 on 4-hour chart), 56.35 (ЕМА200 on weekly chart), 57.80 (Fibonacci 38.2% of the correction to the growth wave that started in February 2016 from near the mark of 27.30), positive dynamics is maintained. Long positions are preferred. In the case of a breakdown of the short-term support level of 57.10 (ЕМА200 on the 1-hour chart), the decline will resume with targets at the support levels of 56.35, 55.50, 53.80, 52.00, 50.25, 49.00, 46.00, 42.20. Support Levels: 58.60, 57.80, 57.10, 56.35, 55.50, 53.80, 52.00 Resistance Levels: 59.00, 60.00, 62.00, 64.00, 65.00 Trading scenarios Sell Stop 56.90. Stop Loss 59.10. Take-Profit 56.35, 55.50, 53.80, 52.00, 50.25, 49.00, 46.00, 42.20 Buy Stop 59.10. Stop Loss 56.90. Take-Profit 60.00, 62.00, 64.00, 65.00 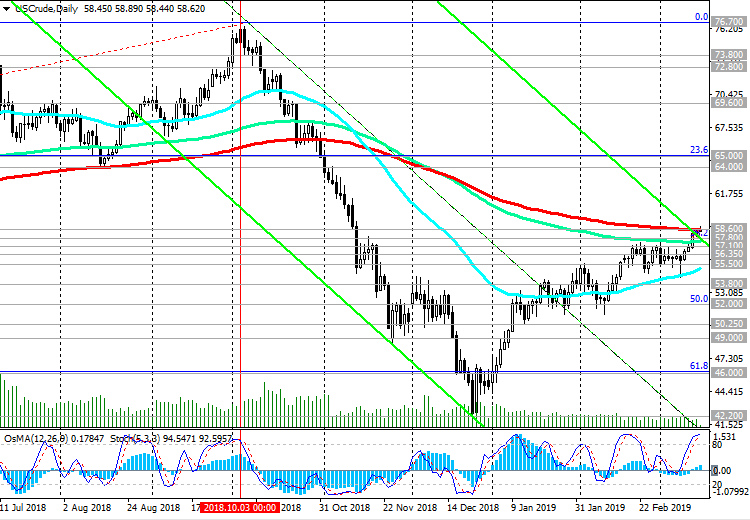  *) For up-to-date and detailed analytics and news on the forex market visit Tifia Forex Broker website tifia.com
|
|
#389
18-03-2019, 11:42
|
||||
|
||||
|
S&P500: Current Situation
18/03/2019 Last week, the DJIA grew by 1.6%, the Nasdaq - by 3.8%, and the S&P 500 - by 2.9%, closing at the maximum levels of 2019. The growth leader in the S&P 500 for the current year remains the technology sector. On Monday, the positive dynamics of US stock indices persisted, although their growth stopped. At the beginning of the European session, futures for the S&P500 index are traded near the mark of 2824.0. Today, the publication of important macro data is not expected, and, probably, US stock indexes will remain traded near the current levels. But on Wednesday you should be careful when trading stock indices and the dollar. Recall that at 18:00 (GMT) the Feds decision on the interest rate will be published, and at 18:30 (GMT) the Feds press conference will begin. During this period, a sharp increase in volatility in financial markets is likely. The soft rhetoric of Jerome Powells speech will further boost US stock indices. *)An advanced fundamental analysis is available on the Tifia Forex Broker website at tifia.com/analytics At the end of January, the S&P500 index broke through key resistance levels of 2676.0 (Fibonacci level 23.6% of the correction to the growth since February 2016), 2720.0 (ЕМА200 on the daily chart), significantly recovered after falling in the 4th quarter of last year. At the moment, the growth of US stock indexes and the S&P500 index continues. Investors are betting on further growth of indices against the background of a more stable position of the American economy in comparison with other major economies of the world. at the beginning of the American session, the S&P500 is trading near the 2828.0 mark. The S&P500 maintains a positive trend, trading in the upward channel on the daily chart, above the key support level of 2720.0. Long positions are preferred. The signal for the resumption of sales will be the breakdown of the short-term support level of 2796.0 (ЕМА200 on the 1-hour chart). Support Levels: 2817.0, 2796.0, 2755.0, 2720.0, 2676.0, 2550.0, 2507.0, 2450.0, 2386.0, 2335.0 Resistance Levels: 2836.0, 2873.0, 2936.0 Trading recommendations Sell Stop 2794.0. Stop Loss 2838.0. Objectives 2755.0, 2720.0, 2676.0 Buy Stop 2838.0. Stop Loss 2794.0. Objectives 2873.0, 2936.0 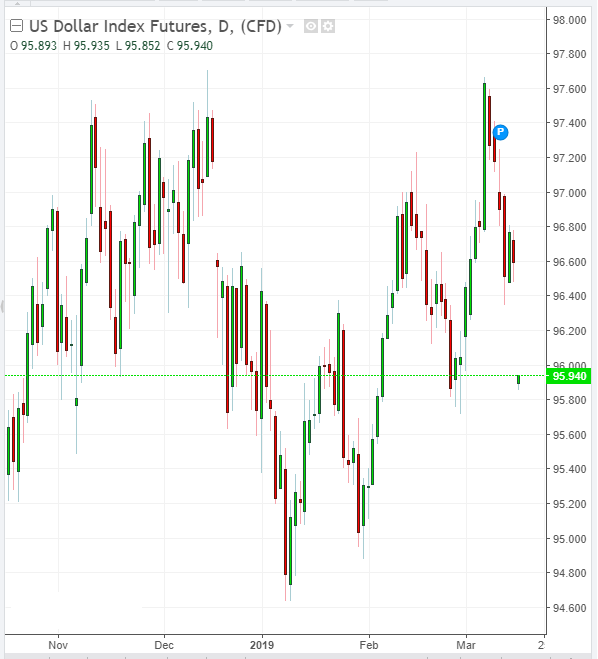  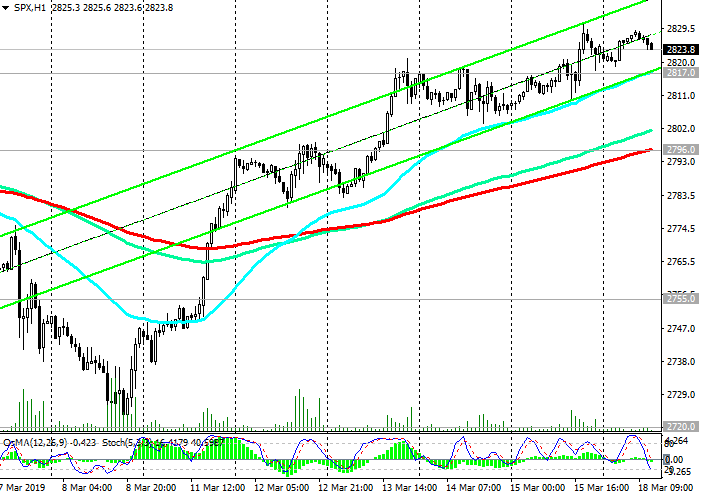 *) For up-to-date and detailed analytics and news on the forex market visit Tifia Forex Broker website tifia.com
|
|
#390
19-03-2019, 12:00
|
||||
|
||||
|
EUR/USD: Current dynamics
03/19/2019 The US dollar continues to decline on Tuesday. Investors expect that at a meeting on Wednesday, the Fed will demonstrate a propensity for a soft monetary policy. The decision on the Fed's interest rate will be published on Wednesday at 18:00 (GMT), and a press conference will begin at 18:30, at which Fed Chairman Jerome Powell can clarify what the central bank is thinking about the economy and the prospects for monetary policy. In recent weeks, Fed officials have made it clear that they are not in a hurry to change rates until the situation with the US economy is clear. On Tuesday, futures for the DXY dollar index, which measures the value of the dollar against a basket of 6 major world currencies, is trading near 95.83, down 76 points from the closing price last Friday. Some market participants are betting that the Fed will not raise the rate until the end of the year and may even lower it if the situation in the economy and the US labor market deteriorates. This is a negative factor for the dollar. Expectations that rates do not rise usually put pressure on the dollar, making it less attractive to investors. *)An advanced fundamental analysis is available on the Tifia Forex Broker website at tifia.com/analytics On Tuesday, the EUR / USD is trying to develop an upward trend above the resistance level of 1.1332 (ЕМА200 on the 4-hour chart). The top line of the descending channel on the daily chart also passes through the mark 1.1332, from which the release and return inside this channel is likely. Downward dynamics prevail. The breakdown of the support level of 1.1313 (EMA200 on the 1-hour chart) will be a signal for the resumption of Eurodollar sales. In the event of a breakdown of support levels of 1.1300, 1.1285 (Fibonacci level 23.6% of the correction to the fall from the level of 1.3900, which began in May 2014), EUR / USD will head towards targets at support levels of 1.1185, 1.1120, 1.1000. The long-term bearish trend, which began in May 2014 near the 1.3870 mark, remains. Short positions are preferred. Long positions will become relevant after EUR / USD is fixed in the zone above the local resistance level of 1.1350. Support Levels: 1.1332, 1.1313, 1.1300, 1.1285, 1.1260, 1.1225, 1.1185, 1.1120, 1.1000 Resistance Levels: 1.1350, 1.1400, 1.1430, 1.1480 Trading recommendations Sell Stop 1.1330. Stop-Loss 1.1365. Take-Profit 1.1313, 1.1300, 1.1285, 1.1260, 1.1225, 1.1185, 1.1120 Buy Stop 1.1365. Stop-Loss 1.1330. Take-Profit 1.1400, 1.1430, 1.1480  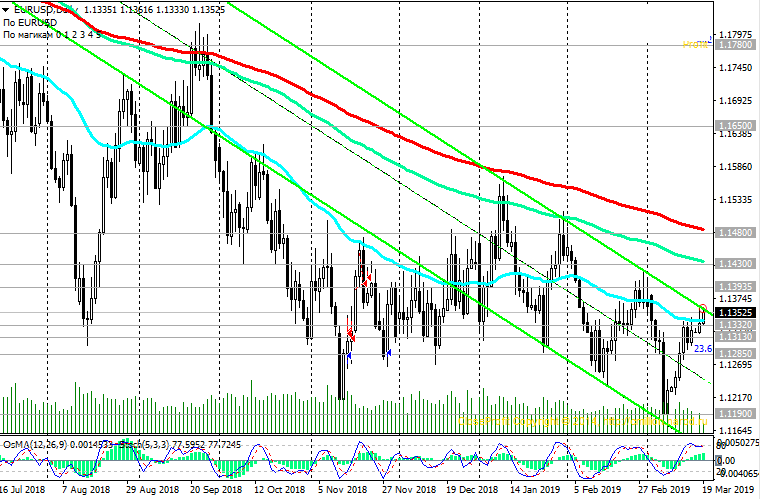  *) For up-to-date and detailed analytics and news on the forex market visit Tifia Forex Broker website tifia.com
|
|
#391
20-03-2019, 12:17
|
||||
|
||||
|
EUR/USD: Fed meeting
03/20/2019 The dollar retains mainly the position before the publication at 18:00 (GMT) of the decision on the interest rate of the Fed. On Wednesday, futures for the dollar index DXY, which measures the value of the dollar against a basket of 6 major world currencies, is trading near 95.93, down 66 points from the closing price last Friday, but up 10 points from the closing price on Tuesday. Market participants do not expect changes in monetary policy at this Fed meeting, which will end on Wednesday with the publication of a rate decision and a press conference. Its beginning is scheduled for 18:30 (GMT). Probably, the Fed will again declare patience, as well as lower forecasts for interest rates and US economic growth. It is possible that the leaders of the Fed will declare that the key rate has reached its peak. To restore funding for the US economy from abroad, the dollar must weaken. Earlier, US President Donald Trump also repeatedly criticized the Feds monetary policy against the backdrop of low inflation in the country. Nevertheless, the demand for the dollar may remain in the medium and long term against the backdrop of international trade wars, regardless of the actions of the Fed. The US economy still looks more stable than other major global economies. *)An advanced fundamental analysis is available on the Tifia Forex Broker website at tifia.com/analytics On Wednesday, the EUR / USD is trying to develop an upward trend above the support level of 1.1332 (ЕМА200 on the 4-hour chart). Below this level, downward dynamics prevail. The breakdown of the support level of 1.1313 (EMA200 on the 1-hour chart) will be a signal to resume sales. The targets for the decline after the breakdown of the support level of 1.1285 (the Fibonacci level of 23.6% of the correction to the fall from the level of 1.3900 that began in May 2014) will be the support levels of 1.1185, 1.1120, 1.1000. The long-term bearish trend, which began in May 2014 near the 1.3870 mark, remains. Short positions are preferred. Long positions will become relevant after EUR / USD is fixed in the zone above the local resistance level of 1.1350. Support Levels: 1.1332, 1.1313, 1.1300, 1.1285, 1.1260, 1.1225, 1.1185, 1.1120, 1.1000 Resistance Levels: 1.1350, 1.1400, 1.1430, 1.1480 Trading recommendations Sell Stop 1.1330. Stop-Loss 1.1365. Take-Profit 1.1313, 1.1300, 1.1285, 1.1260, 1.1225, 1.1185, 1.1120 Buy Stop 1.1365. Stop-Loss 1.1330. Take-Profit 1.1400, 1.1430, 1.1480  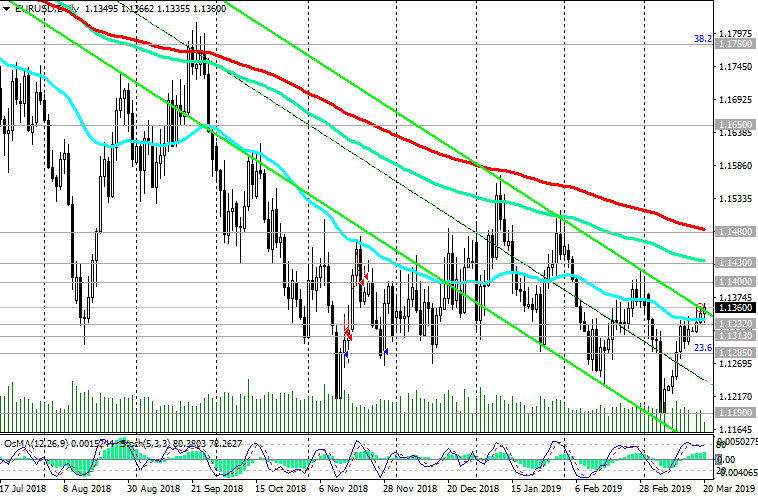 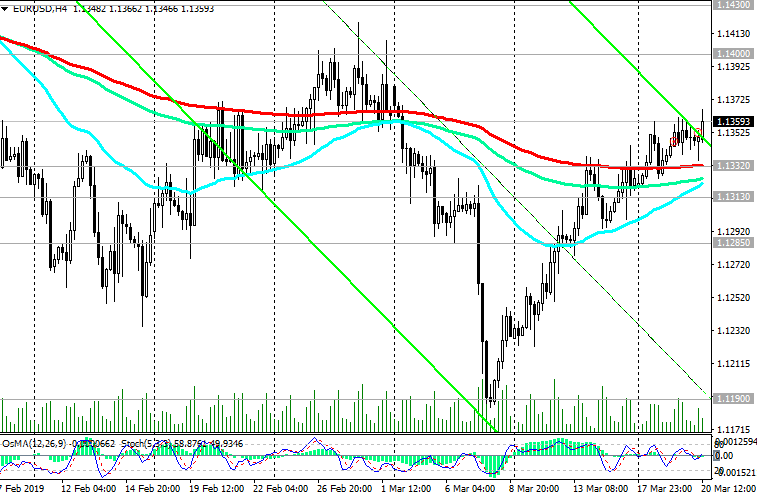 *) For up-to-date and detailed analytics and news on the forex market visit Tifia Forex Broker website tifia.com
|
|
#392
21-03-2019, 12:24
|
||||
|
||||
|
GBP/USD: anxiety is growing in the markets
03/21/2019 On Thursday, the dollar is rising, recovering from a strong fall on Wednesday. DXY dollar index futures at the beginning of the American session on Thursday traded near the level of 95.67, 32 points higher than the opening price of today. Meanwhile, the Bank of England and the National Bank of Switzerland also retained their monetary policy unchanged. The decision of the SNB was published on Thursday at 08:30 GMT, and of the Bank of England at 12:00. The Swiss National Bank left the deposit rate at -0.75%, where it has been located since January 2015. It also left a three-month LIBOR rate in the range from -1.25% to -0.25%. It is worth paying attention to the statement of the SNB, made by it after the meeting. The statement says that this decision and the decline in economic forecasts "is mainly due to the deterioration of the prospects for economic growth and inflation abroad, as well as the associated decrease in expectations regarding the interest rates of key economic regions". The Bank of England also predictably retained its monetary policy unchanged. The decision was made by all 9 votes of members of the Bank of England Monetary Policy Committee (MPC). The banks statement says that the outlook for the economy depends on how the UK leaves the EU. The pound almost did not respond to the decision of the Bank of England. At the same time, anxiety is growing in the markets. Usually, the decision of the central bank of the United States, similar to the one adopted on Wednesday, would provoke growth in the stock markets, but this time the indices rose briefly and fell again. The yield on US government bonds reached 2.52%, the lowest level in a year, and the disappearing difference between long-term and short-term bonds indicates an increased likelihood of recession. And yet, the demand for the dollar may remain in the situation of international trade wars and a slowdown in the global economy, regardless of the actions of the Fed. The US economy looks more stable than other major global economies. *)An advanced fundamental analysis is available on the Tifia Forex Broker website at tifia.com/analytics At the same time, the negative dynamics in the GBP / USD pair is growing due to renewed uncertainty about Brexit. In case of breakdown of the support level of 1.3050 (ЕМА200 on the daily chart), the targets for further reduction will be the support levels of 1.2970, 1.2800, 1.2660, 1.2600. In the alternative scenario, and after returning to the zone above the resistance level of 1.3210 (Fibonacci 23.6% of the correction to the decline of GBP / USD in the wave that started in July 2014 near 1.7200), the GBP / USD growth will resume with targets at the resistance levels of 1.3400 ( the upper limit of the ascending channel on the daily chart), 1.3660 (ЕМА200 on the weekly chart). Short positions in the current situation looks preferable. Support Levels: 1.3112, 1.3050, 1.2970, 1.2800, 1.2700, 1.2660, 1.2600 Resistance Levels: 1.3210, 1.3310, 1.3370, 1.3400, 1.3660 Trading scenarios Sell Stop 1.3090. Stop Loss 1.3190. Take-Profit 1.3050, 1.2970, 1.2800, 1.2700, 1.2660, 1.2590, 1.2480 Buy Stop 1.3190. Stop Loss 1.3090. Take-Profit 1.3210, 1.3310, 1.3370, 1.3400, 1.3660   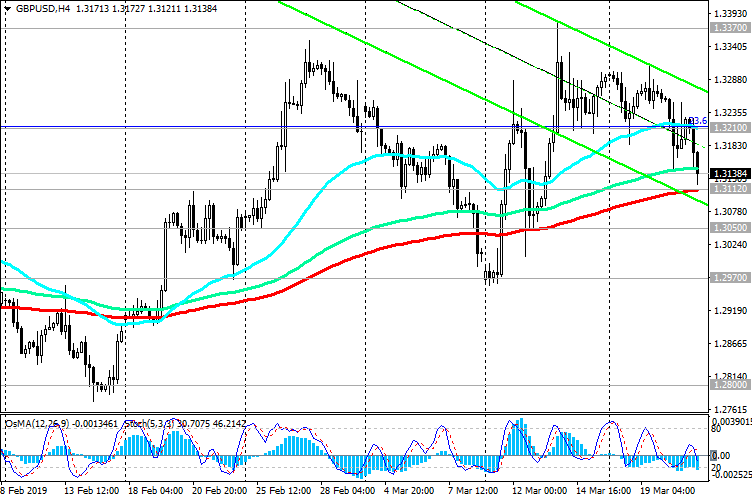 *) For up-to-date and detailed analytics and news on the forex market visit Tifia Forex Broker website tifia.com
|
|
#393
22-03-2019, 12:43
|
||||
|
||||
|
USD/CHF: Swiss National Bank did not change monetary policy
03/22/2019 Current dynamics On Thursday, a regular meeting of the Swiss National Bank took place, at which the bank maintained its monetary policy unchanged. The Swiss National Bank left the deposit rate at -0.75%, where it has been located since January 2015. It also left a three-month LIBOR rate in the range from -1.25% to -0.25%. The banks statement said that this decision and the decline in economic forecasts was mainly due to the deterioration of the prospects for economic growth and inflation abroad, as well as the associated decrease in expectations regarding interest rates in key economic regions. This statement was partly confirmed on Friday, when the weak, much worse than forecast, macro data came out, indicating an acceleration of the slowdown of the European economy. The Swiss franc reacted with restraint to the decision of the NBS, which traditionally considers the franc to be overbought, which does not allow for a more active increase in the growth rate of the Swiss economy. GDP in the 4th quarter grew by only 1.4%, as recently reported in the government of the country. The economic barometer KOF in February fell by 3.8 points and amounted to 92.4, continuing to decline from the long-term average of 100. Since September last year, the index has lost 10 points. "We can expect that the Swiss economy will show weakness in the coming months", said the KOF Economic Research Agency report. Most likely, the interest rate of the NBS will not change in the near future. Soft monetary policy of the central bank usually contributes to keeping the national currency rate low. Nevertheless, the franc maintains stability in the foreign exchange market, receiving support from franc buyers, who traditionally use it as a protective asset during periods of heightened turbulence in financial markets and the uncertainty of the political situation in the world. Meanwhile, the dollar strengthened significantly over the past two days after falling on Wednesday, when the Fed unexpectedly announced its propensity for a softer monetary policy. At the beginning of the European session on Friday, DXY dollar index futures traded near the 96.20 mark, 103 points higher than the minimum reached on Wednesday. From the news for today we are waiting for the publication (at 13:45 GMT) of the PMI indices from Markit Economics for the USA. The preliminary manufacturing PMI index is expected to be 53.6 in March (against 53.0 in February), while the composite PMI index is expected to be 55.2 against 55.5 in February. Data worse than forecasts can trigger a fall in the dollar and the closure of long positions on it at the end of the week. *)An advanced fundamental analysis is available on the Tifia Forex Broker website at tifia.com/analytics Support and Resistance Levels At the beginning of the European session, the USD / CHF is trading near the level of 0.9945, through which the strong resistance level (EMA144 on the daily chart) passes. The indicators OsMA and Stochastic on the 1-hour, 4-hour charts turned to long positions. In the case of the breakdown of the resistance level of 0.9945, the growth of USD / CHF will continue, and the positive dynamics will again increase. In the case of a confirmed breakdown of the key support level of 0.9920 (ЕМА200 on the daily chart and the Fibonacci level 50% of the upward correction to the last wave of decline since November 2018 and from 1.0130), the negative dynamics will increase. A break of this level will increase the risks of breaking the USD / CHF uptrend. Support Levels: 0.9920, 0.9875, 0.9815, 0.9785, 0.9745, 0.9720 Resistance Levels: 0.9945, 0.9970, 0.9990, 1.0005, 1.0050, 1.0090, 1.0130, 1.0160 Trading Scenarios Sell Stop 0.9910. Stop Loss 0.9955. Take-Profit 0.9875, 0.9800, 0.9780, 0.9745, 0.9720 Buy Stop 0.9950. Stop Loss 0.9910. Take-Profit 0.9990, 1.0005, 1.0050, 1.0090, 1.0130, 1.0160  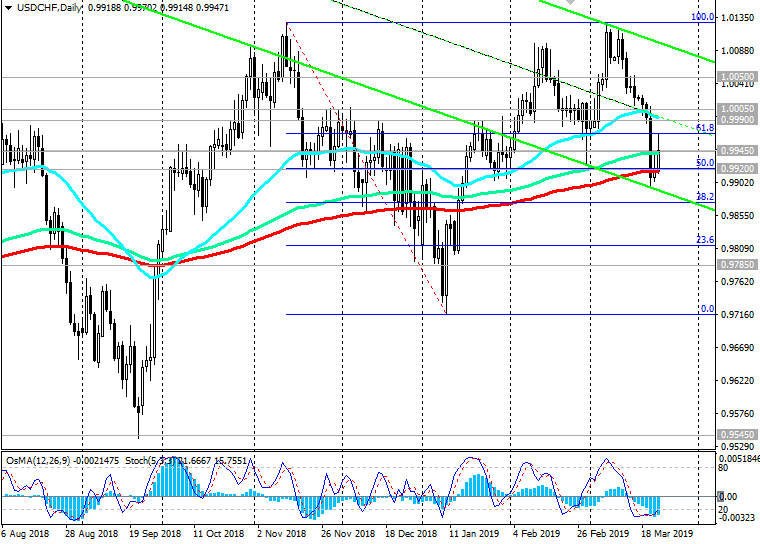 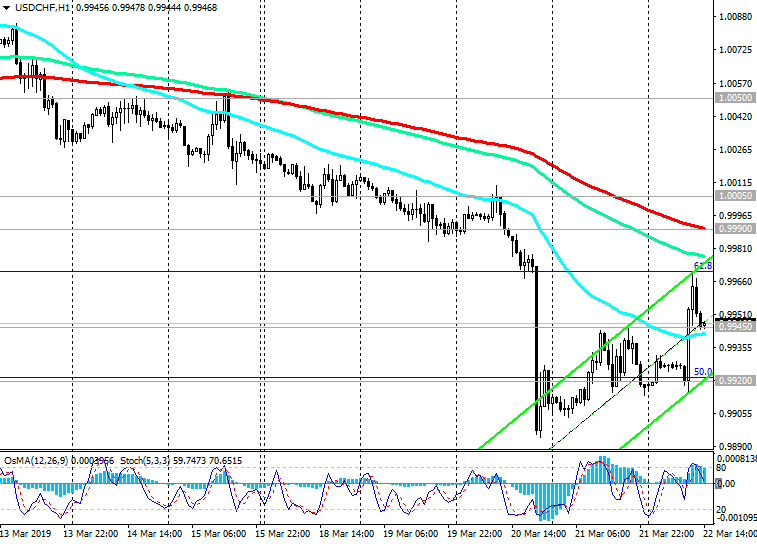 *) For up-to-date and detailed analytics and news on the forex market visit Tifia Forex Broker website tifia.com
|
|
#394
25-03-2019, 11:45
|
||||
|
||||
|
EUR/USD: Current trend
03/25/2019 At the end of last week, the dollar fell, moreover, it was already the second week in a row of dollar decline. Last Wednesday, when the Fed meeting ended, DXY dollar index futures, which valued the dollar against a basket of 6 major world currencies, traded near the 95.17 mark, with a significant decrease to the closing price of the previous week. The leaders of the American Central Bank unexpectedly stated that rates would not rise this year, and a one-time increase in interest rates may be next year. Fed Chairman Jerome Powell said that the policy of the Central Bank may remain unchanged for many months. Some participants in the financial market are betting that the Fed may soon reach a rate cut, which has not happened since the 2008 financial crisis. According to the CME Group, futures for federal funds show that market participants estimate the likelihood of Fed rate cuts by the end of the year at 57%, which is 11% higher than a month earlier. On Monday, the decline in the dollar resumed. DXY dollar index futures traded at the beginning of the European session near the 96.11 mark, 5 points lower than the opening price on Monday. *)An advanced fundamental analysis is available on the Tifia Forex Broker website at tifia.com/analytics Meanwhile, the EUR / USD is recovering on Monday after a significant drop last Friday, when the PMI indices for Germany, France and the Eurozone were published. The Purchasing Managers Index (PMI) for the German manufacturing sector, according to IHS Markit, fell to 44.7 in March from 47.6 in February, reaching the lowest level in more than 6.5 years. France's preliminary composite PMI dropped to 48.7 from 50.4 in February. An index value below 50 indicates slowdown and reduced activity. At the beginning of the European session, the EUR / USD pair is trading near the 1.1300 mark. Below the resistance level of 1.1335 (ЕМА50 on the daily chart, ЕМА200 on the 4-hour and 1-hour charts) only short positions are recommended. The targets for the decline after the breakdown of the support level of 1.1285 (Fibonacci level of 23.6% of the correction to the fall from the level of 1.3900 that began in May 2014) will be the support levels of 1.1210 (November lows), 1.1190 (March and year lows), 1.1120, 1.1000. Support Levels: 1.1300, 1.1285, 1.1260, 1.1210, 1.1190, 1.1120, 1.1000 Resistance Levels: 1.1335, 1.1400, 1.1430, 1.1480 Trading Recommendations Sell Stop 1.1280. Stop-Loss 1.1340. Take-Profit 1.1260, 1.1210, 1.1185, 1.1120 Buy Stop 1.1340. Stop-Loss 1.1280. Take-Profit 1.1400, 1.1430, 1.1480 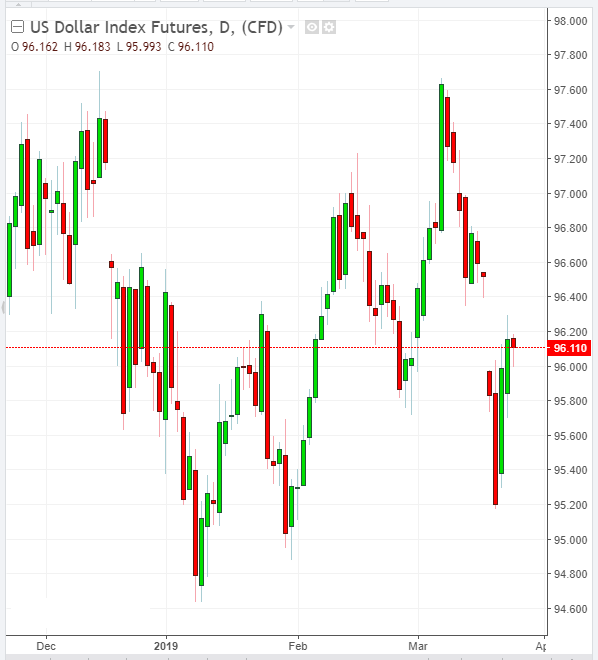 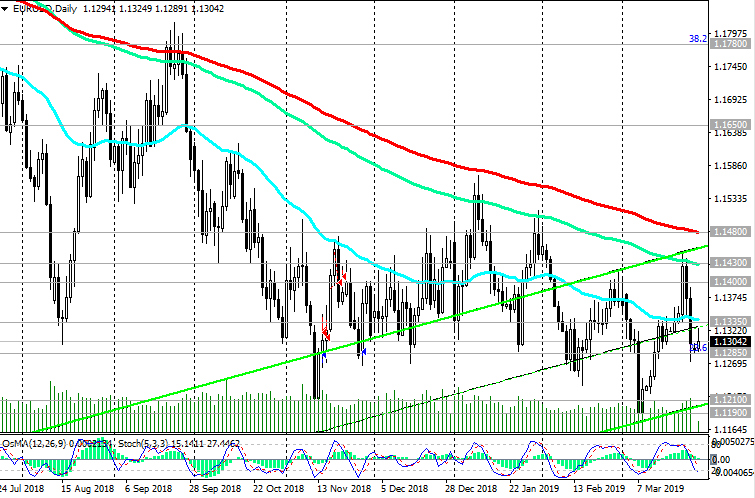 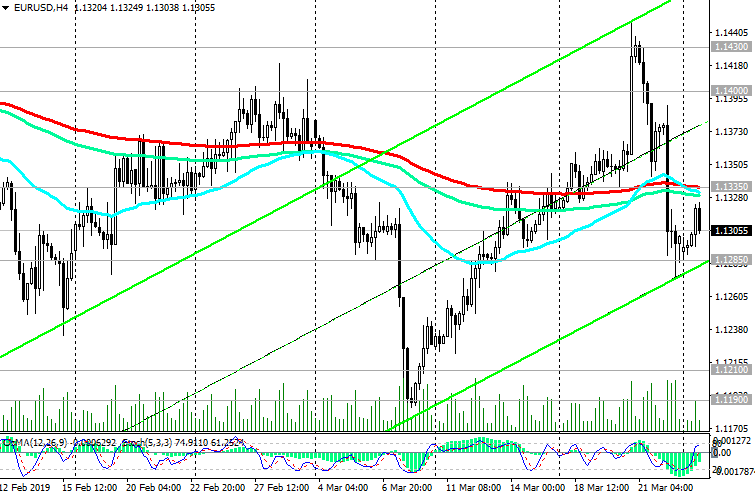 *) For up-to-date and detailed analytics and news on the forex market visit Tifia Forex Broker website tifia.com
|
|
#395
26-03-2019, 11:29
|
||||
|
||||
|
NZD/USD develops upward momentum
03/26/2019 On the eve of the meeting of the RBNZ on the topic of monetary policy, the publication of data on the foreign trade of New Zealand was held. The Statistics Bureau of New Zealand reported on Tuesday that the trade surplus of the country in February amounted to 12 million New Zealand dollars (a deficit of 109 million New Zealand dollars was forecast). At the same time, exports amounted to $ 4.82 billion in February (compared with the forecast of 4.70 billion and the previous value of $ 4.33 billion). Over the past two weeks, the New Zealand dollar has strengthened, which is associated by economists with optimism around the US-China trade negotiations. The RBNZ interest rate decision will be published on Wednesday (01:00 GMT). Probably, the rate will remain at the same level of 1.75%. Market participants expect the rate of the RBNZ to remain at the current level throughout 2019 and the first half of 2020. *)An advanced fundamental analysis is available on the Tifia Forex Broker website at tifia.com/analytics Meanwhile, NZD / USD is developing an upward trend above key support levels of 0.6865 (Fibonacci level 23.6% of the upward correction to the global wave of the pair's decline from the level of 0.8800, started in July 2014; the wave minima are near the level of 0.6260), 0.6815 (ЕМА200 on daily chart). Growth targets are at resistance levels of 0.6980 (EMA144 on the weekly chart), 0.7060 (EMA200 on the weekly chart). The alternative scenario will be associated with the breakdown of the support level of 0.6815 and a decline to the support levels of 0.6750, 0.6700, which will increase the risk of NZD / USD returning to a bearish trend. Support levels: 0.6900, 0.6865, 0.6840, 0.6815, 0.6750, 0.6700, 0.6630, 0.6575 Resistance levels: 0.6935, 0.6980, 0.7060 Trading scenarios Sell Stop 0.6885. Stop Loss 0.6925. Take-Profit 0.6865, 0.6840, 0.6815, 0.6750, 0.6700, 0.6630, 0.6575 Buy Stop 0.6925. Stop Loss 0.6885. Take-Profit 0.6935, 0.6980, 0.7060 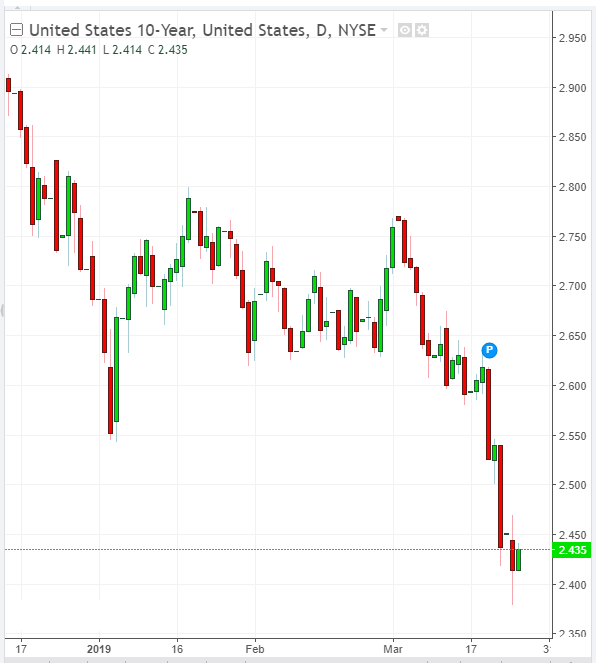 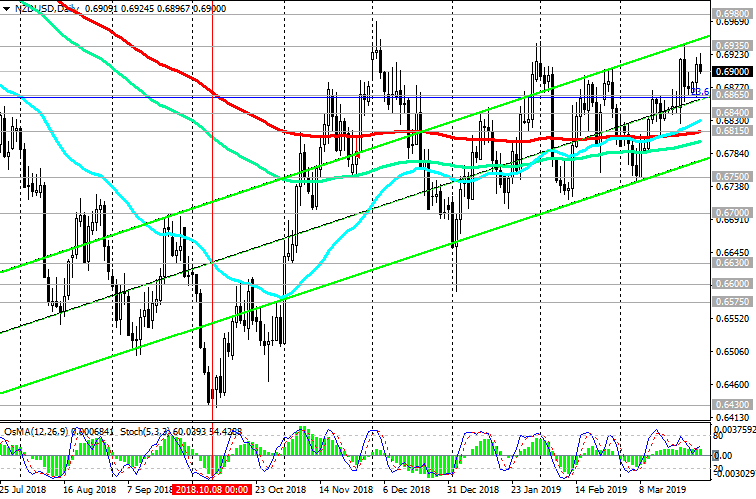 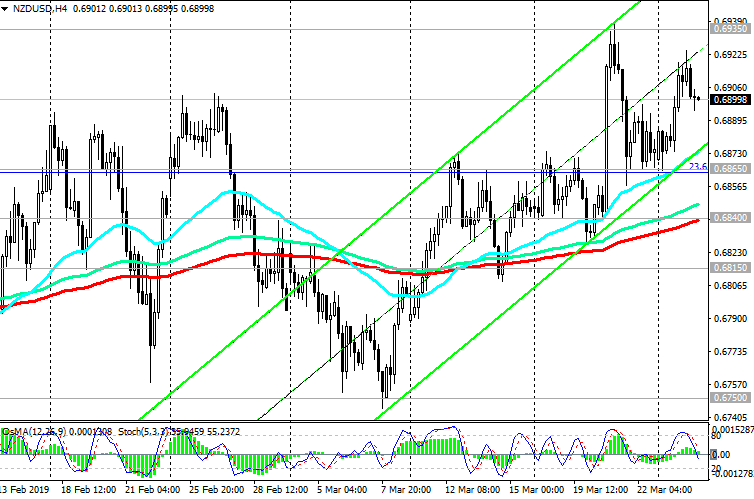 *) For up-to-date and detailed analytics and news on the forex market visit Tifia Forex Broker website tifia.com
|
|
#396
27-03-2019, 12:43
|
||||
|
||||
|
NZD/USD: RBNZ softened the rhetoric
03/27/2019 Current Dynamics The New Zealand dollar fell significantly on Wednesday after the RBNZ left the key rate at 1.75% and indicated the likelihood of interest rate cuts According to the RBNZ, "the outlook for the global economy continues to deteriorate". "Given the deterioration in the prospects for the world economy and the weakening of the impulse of spending inside the country, the more likely direction of our key interest rate will be its decline", the RBNZ said in a statement. Now some economists predict that by the end of this year, the RBNZ will lower rates twice. *)An advanced fundamental analysis is available on the Tifia Forex Broker website at tifia.com/analytics The NZD / USD fell by 1.6%, reaching a minimum near the level of 0.6793, breaking through the key support level of 0.6815 (ЕМА200 on the daily chart). Indicators OsMA and Stochastic on the 4-hour and daily charts turned to short positions. The negative scenario implies a further weakening of the New Zealand dollar, a breakdown of the support level of 0.6798 (EMA144 on the daily chart) and a decline to the support levels of 0.6750, 0.6700. The breakdown of these support levels will mean the return of NZD / USD to a bearish trend. If NZD / USD resumes upward trend, then growth targets will be resistance levels of 0.6865 (Fibonacci level 23.6% of the upward correction to the global wave of the pair's decline from 0.8800 level, which began in July 2014; wave minima are near 0.6260), 0.6935, 0.6980. Support levels: 0.6798, 0.6750, 0.6700 Resistance levels: 0.6815, 0.6840, 0.6865, 0.6935, 0.6980 Trading Scenarios Sell Stop 0.6785. Stop Loss 0.6825. Take-Profit 0.6750, 0.6700, 0.6630, 0.6575 Buy Stop 0.6825. Stop Loss 0.6785. Take-Profit 0.6865, 0.6935, 0.6980, 0.7060   *) For up-to-date and detailed analytics and news on the forex market visit Tifia Forex Broker website tifia.com
|
|
#397
28-03-2019, 11:44
|
||||
|
||||
|
EUR/USD: Current Dynamics
03/28/2019 The dollar is rising again in the second half of the European session, and the EUR / USD is trading near the 1.1235 mark. At the same time, futures for the dollar index DXY, reflecting the value of the dollar against a basket of 6 major world currencies, is trading near 96.64, 36 points higher than the closing price on Wednesday. The US Federal Reserve last week also made it clear that this year it does not plan to raise rates. Nevertheless, the US dollar is supported because of the deteriorating economic situation in Europe and the world, which makes investors more fearful of a slowdown in the global economy. In this situation, investors buy the dollar, because the United States is the largest economy in the world, from the end of 2017 ahead of other developed economies in terms of growth rates. The American economy in the current situation looks more attractive. On Thursday, market participants will pay attention to the publication (12:30 GMT) of the US annual GDP for the 4th quarter (final release). GDP data is one of the key (along with labor market and inflation data) for the Fed in terms of its monetary policy. A strong result strengthens the US dollar; a weak GDP report adversely affects the US dollar. In the previous quarter, GDP growth was +3.4%. The forecast for 4Q 2018 +2.4%. Despite the relative decline, this is a strong indicator. If the data turns out to be worse than the forecast, the dollar will respond with a decrease. *)An advanced fundamental analysis is available on the Tifia Forex Broker website at tifia.com/analytics Trading recommendations EUR / USD is in a long-term bearish trend, trading lower for the second week in a row. Below the key resistance levels 1.1420 (ЕМА144), 1.1470 (ЕМА200 on the daily chart) short positions are preferable. The targets for the decline after the breakdown of the support level of 1.1210 (November lows) will be the levels of 1.1190 (March and year lows), 1.1120, 1.1000. Support Levels: 1.1210, 1.1190, 1.1120, 1.1000 Resistance Levels: 1.1285, 1.1305, 1.1325, 1.1400, 1.1420, 1.1470 Trading recommendations Sell in the market. Stop-Loss 1.1310. Take-Profit 1.1210, 1.1185, 1.1120 Buy Stop 1.1310. Stop Loss 1.1210. Take-Profit 1.1325, 1.1400, 1.1420, 1.1470 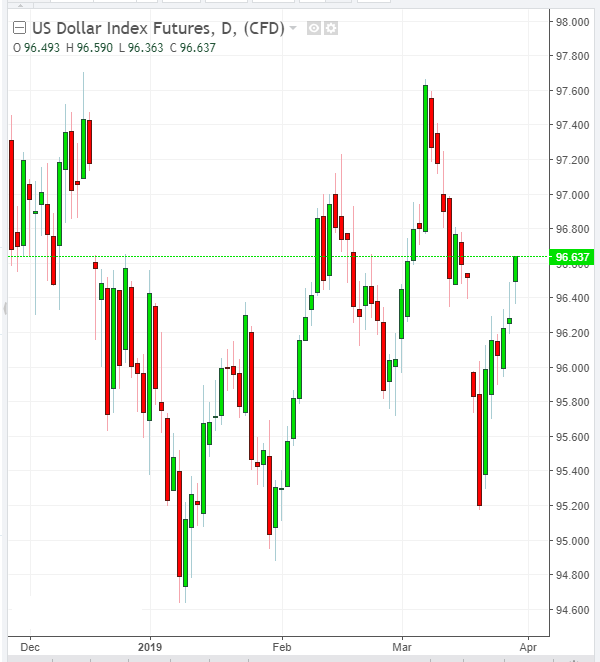 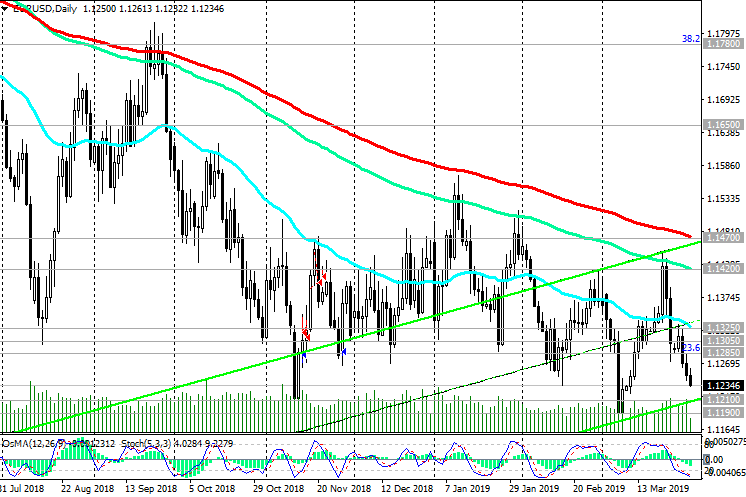 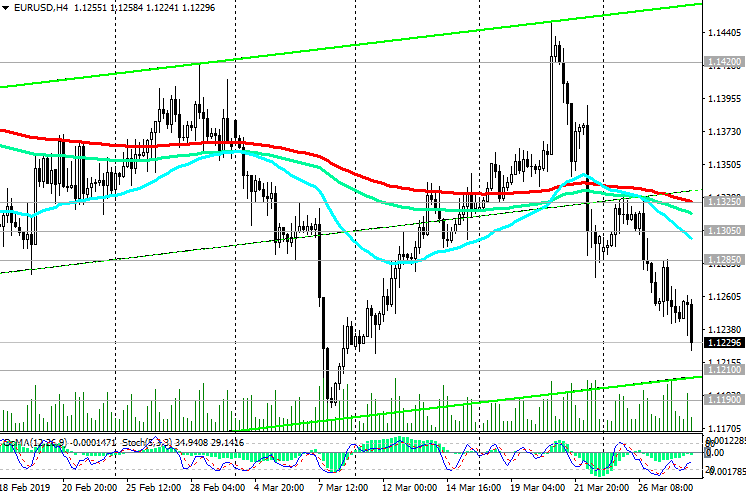 *) For up-to-date and detailed analytics and news on the forex market visit Tifia Forex Broker website tifia.com
|
|
#398
29-03-2019, 12:34
|
||||
|
||||
|
GBP/USD: Current Dynamics
03/29/2019 On Friday, the British parliament will vote for the Brexit plan proposed by Theresa May for the third time, albeit in a truncated form. Voting will take place on one of the parts of the transaction, which spelled out such provisions as the rights of citizens, payments to the UK in the EU funds and measures to prevent the creation of a rigid border in Ireland. If parliament votes in favor, the UK will leave the EU on May 22. If they dont support it, then until April 12, London will have to offer an alternative agreement to Brussels. This year, Parliament has twice rejected the plan for a deal with the EU proposed by Theresa May. Voting in the British Parliament is scheduled for 13:30 (GMT). Any unexpected voting results or related comments may cause increased volatility in the GBP / USD. *)An advanced fundamental analysis is available on the Tifia Forex Broker website at tifia.com/analytics In the meantime, the pair GBP / USD is trading near 1.3100, above the key support levels of 1.3060 (ЕМА200 on the daily chart), 1.3035 (ЕМА144 on the daily chart). Breakdown of these support levels may trigger a deeper decline. The targets are at the support levels of 1.3035, 1.2970 (March lows), 1.2800 (February lows), 1.2700 (October and August 2018 lows). The breakdown of the short-term resistance level of 1.3125 (EMA200 on the 4-hour chart) will signal a resumption of purchases with targets at resistance levels of 1.3210 (Fibonacci level 23.6% of the correction to a decline in the GBP / USD pair in the wave that started in July 2014 near 1.7200) , 1.3370 (maximums of March and year), 1.3400 (upper limit of the ascending channel on the daily chart), 1.3660 (ЕМА200 on the weekly chart). Support Levels: 1.3060, 1.3035, 1.2970, 1.2800, 1.2700, 1.2660, 1.2600 Resistance Levels: 1.3125, 1.3210, 1.3310, 1.3370, 1.3400, 1.3660 Trading scenarios Sell Stop 1.3010. Stop Loss 1.3135. Take-Profit 1.2970, 1.2800, 1.2700, 1.2660, 1.2590, 1.2480 Buy Stop 1.3135. Stop Loss 1.3010. Take-Profit 1.3210, 1.3310, 1.3370, 1.3400, 1.3660  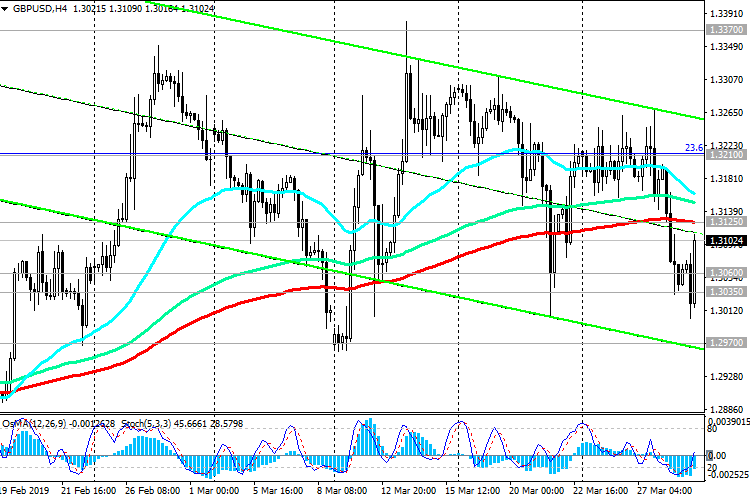 *) For up-to-date and detailed analytics and news on the forex market visit Tifia Forex Broker website tifia.com
|
|
#399
01-04-2019, 11:11
|
||||
|
||||
|
AUD/USD: current dynamics
01/04/2019 The US dollar declines on Monday after last Friday, the DXY dollar index, reflecting the value of the dollar against a basket of 6 major world currencies, reached a two-week high near the 96.91 mark. Investors prefer the US dollar amid risks of a slowdown in the global economy. The US economy looks more resilient than other major global economies. On Monday at the beginning of the European session, futures for the dollar index DXY is trading near the mark of 96.68. Received last Sunday and during the Asian session on Monday, positive macro statistics from China contributed to the growth of Chinese yuan and the currencies of the Asia-Pacific region, as well as a decrease in the US dollar. The official Purchasing Managers Index (PMI) for the manufacturing sector in China rebounded noticeably in March, hardening to a 6-month high of 50.5 from 49.2 in February, exceeding the forecast of 49.5. The business activity index in the service sector also turned out to be in March (54.8) better than the forecast (54.1) and the previous value (54.3). The index of purchasing managers (PMI) for the manufacturing sector of China from Caixin in March rose to 50.8 from 49.9 in February. The PMI index from Caixin in March reached the highest point since October, exceeding the level of 50, which separates the growth of activity from the decline. As a result, the AUD / USD opened today with a gap up by 23 points, and at the beginning of the European session it was trading near the daily high of 0.7131. However, by the beginning of the American session, the AUD / USD pair is again decreasing before the publication of important macro data from the USA (in the period from 12:30 to 14:00 (GMT)). Favorable statistics on retail trade and business activity in the US manufacturing sector are expected in March. PMI is expected to grow in the US manufacturing sector (from ISM) to 54.5 against 54.2 in February. This is a strong indicator that will have a positive impact on the USD when the forecast is confirmed. On Tuesday, a meeting of the RB of Australia on monetary policy will be held. According to the forecasts of economists, the RBA will keep the interest rate unchanged on Tuesday, at the level of 1.5%, but will hint at the likelihood of an early decrease in the interest rate. This will have a negative effect on AUD. Publication of the RBA decision on the rate is scheduled for 03:30 (GMT). *)An advanced fundamental analysis is available on the Tifia Forex Broker website at tifia.com/analytics Despite the growth during the Asian session, AUD / USD remains under pressure below the key resistance level of 0.7230 (ЕМА200 on the daily chart). Mostly long-term negative dynamics. In the event of a breakdown of the support level of 0.7110 (EMA50 on the daily chart), AUD / USD will go inside the downward channel on the daily chart towards the support levels of 0.7025, 0.6980, 0.6910 (September 2015 lows), 0.6830 (2016 lows). Short positions are preferred. Support Levels: 0.7110,0.7100, 0.7025, 0.6980 Resistance Levels: 0.7140, 0.7180, 0.7230, 0.7295 Trading Recommendations Sell in the market. Stop Loss 0.7150. Take-Profit 0.7100, 0.7055, 0.7025, 0.6910, 0.6830 Buy Stop 0.7150. Stop Loss 0.7090. Take-Profit 0.7180, 0.7230 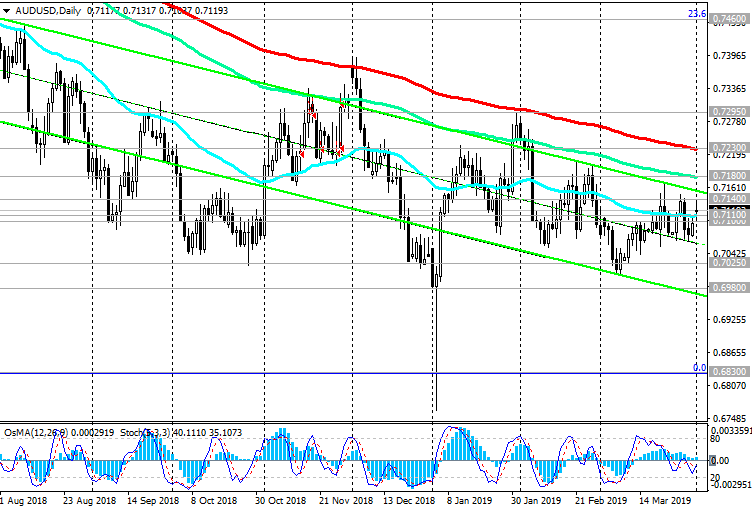 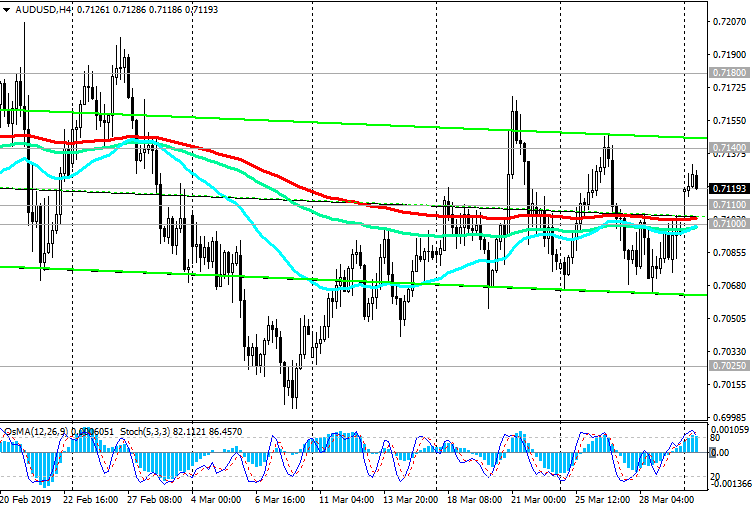 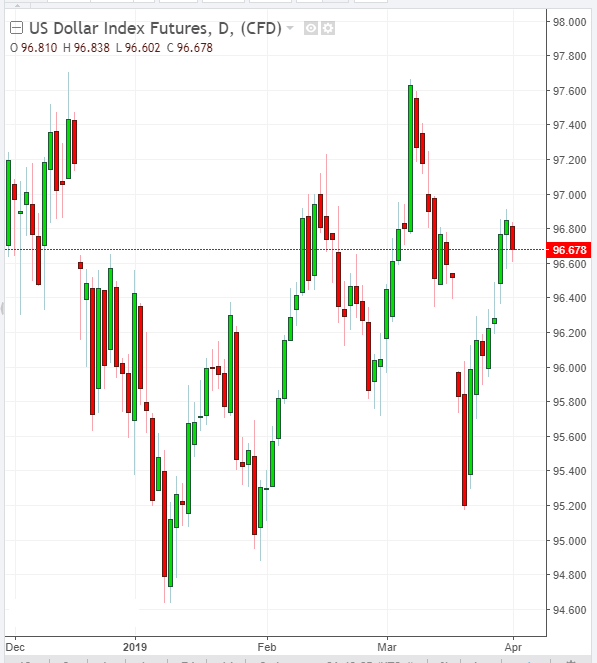 *) For up-to-date and detailed analytics and news on the forex market visit Tifia Forex Broker website tifia.com
|
|
#400
02-04-2019, 12:13
|
||||
|
||||
|
USD/CAD: Current Dynamics
02/04/2019 The PMI index for the US manufacturing sector, published on Monday, calculated by the Institute for Supply Management (ISM), rose to 55.3 in March against 54.2 in February. The DXY dollar index, reflecting its value against a basket of 6 major world currencies, is at the beginning of the European session on Tuesday near 96.92, 12 points higher than the closing price on Monday. Today is the 6th day of the continuous growth of the DXY dollar index, and it looks like its positive dynamics will continue until the end of the week, when data from the American labor market will be published. Expected strong data that will support the US dollar in confirming the forecast. From the news today we are waiting for important macro statistics from the United States. At 12:30 (GMT), data on durable goods orders will be published, involving large investments. In January, the indicator came out with a value of +0.3%. Forecast for February: -1.8%. This is negative information for dollar buyers. If Februarys data is even weaker, the US dollar may decline significantly. Data better than the forecast will strengthen the dollar. *)An advanced fundamental analysis is available on the Tifia Forex Broker website at tifia.com/analytics Meanwhile, the USD / CAD continues to trade near the support levels of 1.3335 (ЕМА200 on the 4-hour chart), 1.3320 (ЕМА50 on the daily chart). A break of the short-term resistance level of 1.3370 (ЕМА200 on the 1-hour chart) will confirm the scenario for the growth of USD / CAD. The growth targets will be the resistance levels of 1.3450 (Fibonacci level 23.6% of the downward correction to the growth of the pair in the global uptrend since September 2012 and 0.9700), 1.3660 (2018 highs), 1.3790 (2017 highs). Confirmed breakdown of the local support level of 1.3300 will create prerequisites for further reduction to support levels of 1.3245 (ЕМА144 on the daily chart), 1.3200 (ЕМА200 on the daily chart). In general, the positive dynamics of USD / CAD remains; long positions are preferred. Support Levels: 1.3300, 1.3245, 1.3200, 1.3155, 1.3090, 1.3045 Resistance Levels: 1.3320, 1.3335, 1.3370, 1.3450, 1.3600, 1.3660, 1.3790 Trading scenarios Sell Stop 1.3290. Stop Loss 1.3340. Take-Profit 1.3245, 1.3200, 1.3155, 1.3090, 1.3045 Buy Stop 1.3340. Stop-Loss 1.3290. Take-Profit 1.3370, 1.3450, 1.3600, 1.3660, 1.3790  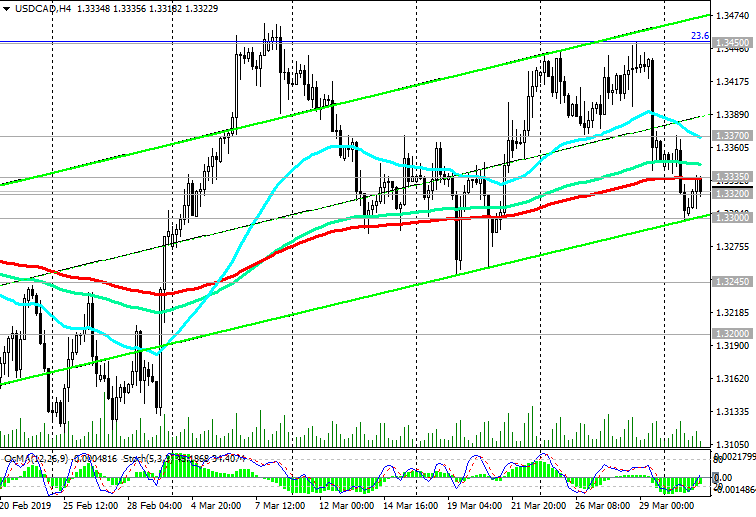 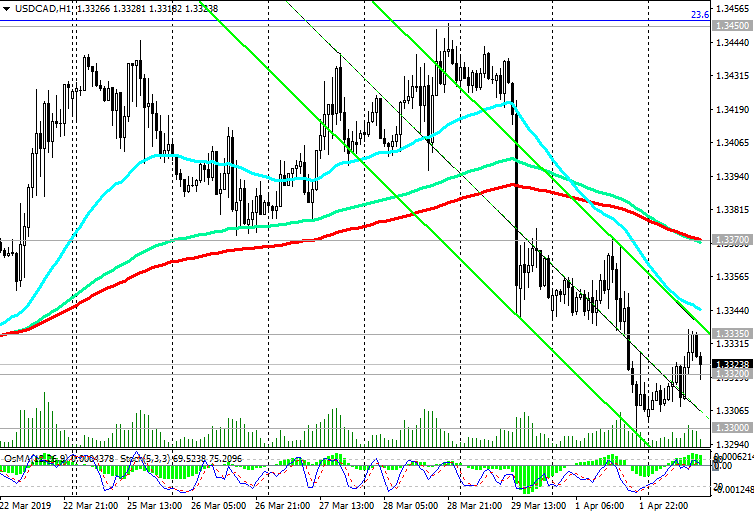 *) For up-to-date and detailed analytics and news on the forex market visit Tifia Forex Broker website tifia.com
|
|
|
|
 Similar Threads
|
||||
| Thread | Thread Starter | Forum | Replies | Last Post |
| Tifia Daily Market Analytics | TifiaFX | Forex Analysis | 0 | 22-03-2017 14:17 |
| Tifia Daily Market Analytics | TifiaFX | Forex Analysis | 0 | 16-03-2017 14:48 |
| Tifia Daily Market Analytics | TifiaFX | Forex Analysis | 0 | 14-03-2017 09:52 |
| Daily Market Analysis by FxGrow | FxGrow10 | Forex Analysis | 0 | 06-05-2015 01:03 |
| Daily Market update by UWC | effexx | Trading Journals | 156 | 01-03-2012 10:40 |


