Forex Forums | ForexLasers.com |
|
|||||||
 |
|
|
LinkBack | Thread Tools | Search this Thread |
|
#281
 25-06-2018, 11:48
|
||||
|
||||
|
DJIA: negative dynamics prevails
25/06/2018 Current dynamics The main US stock indices rose on Friday, mainly due to oil and gas sector securities against the backdrop of a restrained OPEC decision to increase oil production. S&P500 rose by 0.2% on Friday to 2,754.88 points, although it lost 24.78 points, or 0.9%, over the week. DJIA on Friday increased by 119.19 points (+0.5%), to 24580.89 points. However, for the week also fell, losing 509.59 points, or 2%. Since mid-June, the main US stock indexes are declining. The escalation of international trade conflicts, or rather, the escalation of the contradictions in the US trade relations with other major partners such as China, the EU, Canada, contribute to the fact that investors escape from the risks of buying high-yield assets of the stock markets. In this situation, the dollar is a protective asset. Additional pressure on the stock indices is the actions of the Fed. As you know, in mid-June, the Fed raised the rate by 0.25% and signaled a higher rate of tightening of monetary policy. US President Donald Trump on Friday threatened to introduce a 20% duty on cars from the EU after the European Commission began to impose duties on various American products. The EU took a response to the introduction of import duties in the United States on the import of European steel and aluminum in the amount of 25% and 10%, respectively. Earlier, Donald Trump instructed his administration to additionally draw up a list of Chinese goods worth $ 200 billion, for which duties will be introduced. Trump accuses China of violating intellectual property rights and technology theft, as well as in disproportionate import duties and restrictions on the importation of American goods into the country. China immediately reacted to Washington's actions, saying that "if the US side completely lost the mind and published a new list, the Chinese side will be forced to take comprehensive quantitative and qualitative measures and give a decisive respond". In both cases, import duties in the United States and China come into force on July 6. On Sunday, US President Donald Trump called on all countries that have established artificial trade barriers and duties to eliminate them. "The United States insists that all countries that have established artificial trade barriers and duties on goods coming to them, eliminate these duties and barriers, otherwise they will face more than reciprocity from the United States", he wrote in his Twitter. Investors are worried about the increasing deterioration of trade relations in the world. According to the Bank of America Merrill Lynch, over the last week, investors have withdrawn the largest since 2016, the volume of funds from equity funds, financial instruments and bonds of investment grade emerging markets. Shares of industrial, agricultural and automotive companies fell last week. DJIA on Thursday finished with losses eighth consecutive session. This is the longest such series in more than a year. *)An advanced fundamental analysis is available on the Tifia Forex Broker website at tifia.com/analytics Support levels: 24425.0, 24050.0, 23800.0, 23120.0, 22450.0 Resistance levels: 24800.0, 25400.0, 25750.0, 26200.0, 26620.0 Trading Scenarios Buy Stop 24700.0. Stop-Loss 24300.0. Take-Profit 24800.0, 25400.0, 25750.0, 26200.0, 26620.0 Sell Stop 24300.0. Stop-Loss 24700.0. Take-Profit 24050.0, 23800.0, 23120.0, 22450.0 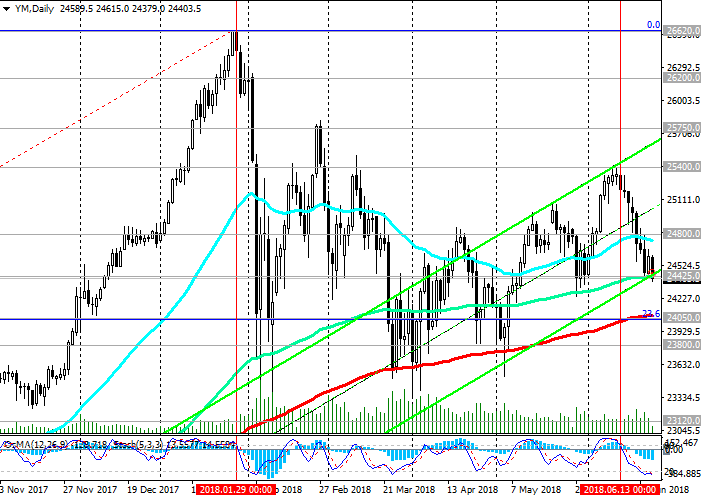 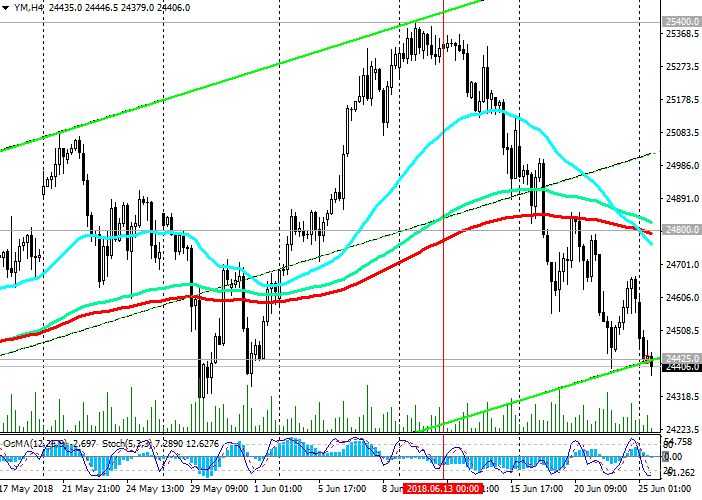 *) For up-to-date and detailed analytics and news on the forex market visit Tifia Forex Broker website tifia.com 
|
|
#282
02-07-2018, 11:28
|
||||
|
||||
|
DJIA: investors' pessimism prevails
02/07/2018 Current dynamics Major US stock indexes began a new month and a quarter with a fall. On Monday, US and world stock indices are falling amid escalation of international trade conflicts, weak economic data on China, deterioration of the political situation in the German government. The strongest decline is - of banks shares, automobile companies and firms connected with the raw materials sphere. Trump is considering the possibility of imposing duties on imports of cars in the US at a rate of 20%, including from Europe. The presidential administration is currently studying this issue. Discussing the course of the negotiations on the revision of the terms of the North American Free Trade Agreement with Mexico and Canada (NAFTA), Trump said that "if they do not like it, I will tax the cars they bring to the US, and that's serious". Since mid-June, the main US stock indexes are declining. And today is not an exception. Pessimism of investors and negative dynamics of stock indices prevail. *)An advanced fundamental analysis is available on the Tifia Forex Broker website at tifia.com/analytics Support and resistance levels With the opening of the trading day on Monday, the DJIA is down, coming close to a strong support level of 24050.0 (EMA200 on the daily chart and Fibonacci level of 23.6% of the correction to the growth from the level of 15650.0 in the wave that began in January 2016. The maximum of this wave and the Fibonacci level 0 % are near the mark of 26620.0). The breakdown of the support levels 24050.0, 23800.0 (EMA50 on the weekly chart) will significantly increase the risks of breaking the bullish trend. Indicators OsMA and Stochastics on the daily, weekly, monthly charts recommend short positions. The first signal for the resumption of the upward dynamics will be the breakdown of the short-term resistance level 24425.0 (EMA200 on the 1-hour chart). The breakdown of resistance level 24650.0 (EMA200 on the 4-hour chart) will confirm the resumption of the upward dynamics and bullish trend of DJIA. The nearest growth target is resistance level 25400.0 (June highs). In the event of a breakdown of the resistance level 25400.0, the DJIA will head towards resistance levels 25750.0, 26620.0 (absolute and annual highs). Support levels: 24050.0, 23800.0, 23120.0, 22450.0 Resistance levels: 24425.0, 24650.0, 25400.0, 25750.0, 26200.0, 26620.0 Trading Scenarios Buy Stop 24350.0. Stop-Loss 23950.0. Take-Profit 24425.0, 24650.0, 25400.0, 25750.0, 26200.0, 26620.0 Sell Stop 23950.0. Stop-Loss 24350.0. Take-Profit 23800.0, 23120.0, 22450.0  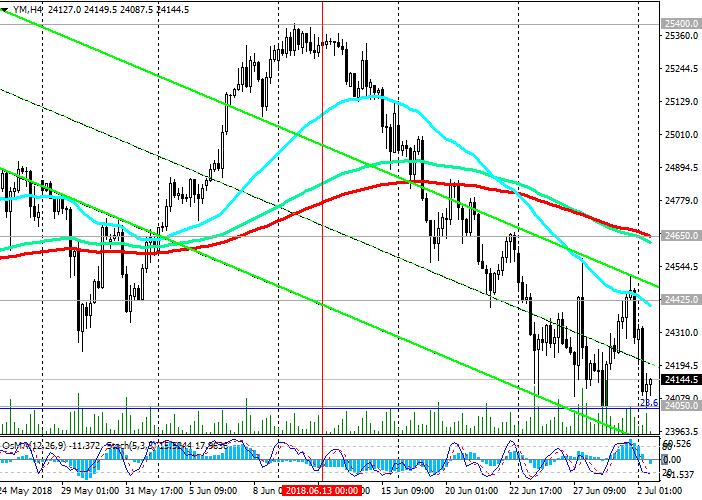 *) For up-to-date and detailed analytics and news on the forex market visit Tifia Forex Broker website tifia.com
|
|
#283
05-07-2018, 09:19
|
||||
|
||||
|
GBP/USD: Market expectations
05/07/2018 The central event on Thursday will be the publication (at 18:00 GMT) of the minutes from the June Fed meeting. The publication of the protocol is extremely important for determining the course of the current policy of the Fed and the prospects for raising the interest rate in the US, because recently, from the leaders of the Federal Reserve more often you can hear statements that testify to the Fed's inclination to accelerate the rate of interest rate increase. Volatility during the publication of the protocol is usually increased, since the text of the protocol often contains either changes or clarifying the details of the outcome of the previous FOMC meeting. Also, market participants will follow the speech of the head of the Bank of England Mark Carney, which will start at 10:00 (GMT). Volatility in the pound trade in this period of time may rise sharply, because Mark Carney is able to unfold the markets with his unexpected statements. If he does not touch upon the questions of the monetary policy of the Bank of England, the reaction to his speech will be weak. It is also necessary to pay attention to the publication of a block of important macro data from the United States in the period from 12:15 to 14:00 (GMT). Among other data - the publication of the ADP report on employment in the private sector in the US in June. This report usually has a strong impact on the market and the dollar quotes. Although there is usually no direct correlation with Non-Farm Payrolls, the ADP report is considered the harbinger of the official report of the US Department of Labor on the overall state of the labor market in the country. Strong data positively affects the dollar. The number of employees in the US private sector is expected to increase by 190,000 (against +178,000 in May). Reducing the result could negatively affect the dollar. Thus, on Thursday an extremely volatile trading day is expected, especially in the American trading session. *)An advanced fundamental analysis is available on the Tifia Forex Broker website at tifia.com/analytics Support levels: 1.3210, 1.3195, 1.3105, 1.3035, 1.3000, 1.2900 Resistance levels: 1.3260, 1.3320, 1.3410, 1.3500 Trading Scenarios Sell Stop 1.3210. Stop-Loss 1.3260. Take-Profit 1.3195, 1.3105, 1.3035, 1.3000, 1.2900 Buy Stop 1.3260. Stop-Loss 1.3210. Take-Profit 1.3320, 1.3410, 1.3500  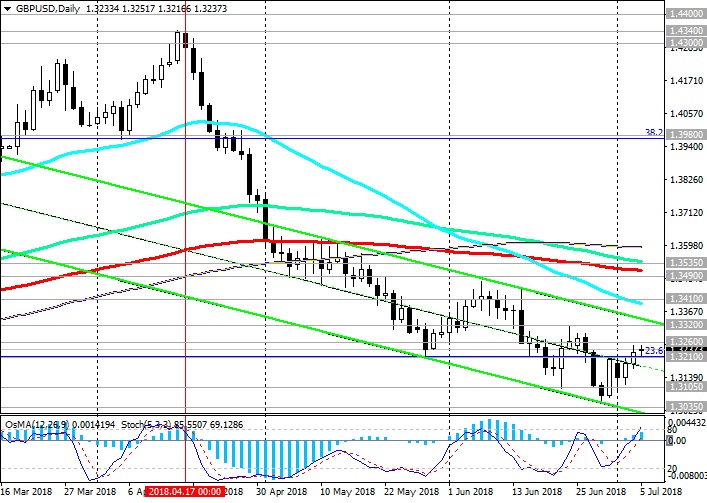 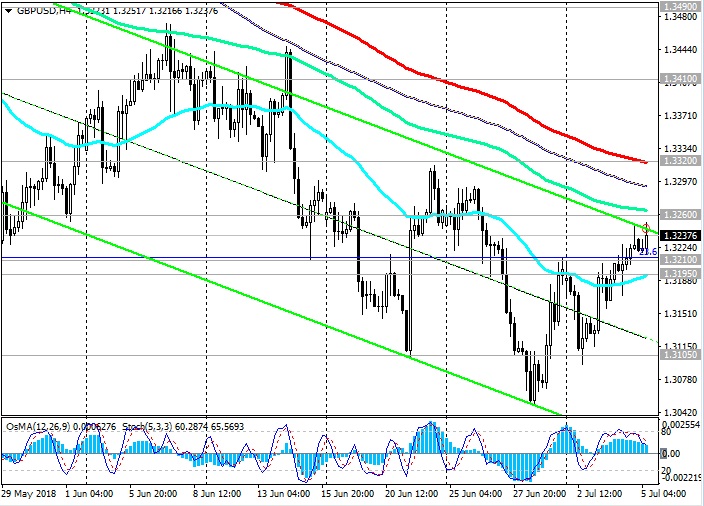 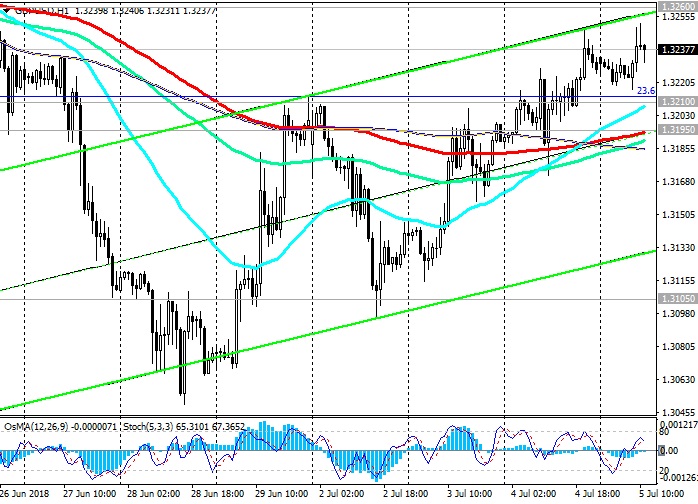 *) For up-to-date and detailed analytics and news on the forex market visit Tifia Forex Broker website tifia.com
|
|
#284
09-07-2018, 12:05
|
||||
|
||||
|
DJIA: investors' optimism rose
09/07/2018 Current dynamics Investors enthusiastically met with a strong report on the US labor market, published last Friday, as well as information about the next reduction in the deficit of the US foreign trade balance. According to the data presented, the deficit of trade in goods and services in the US in May fell by 6.6% compared to the previous month, amounting to $ 43.05 billion. Thus, the deficit of foreign trade in May was the lowest since October 2016. At the same time, although unemployment rose to 4.0% from 3.8% in May, the number of jobs outside the country's agriculture increased by 213 000 in June (the forecast was +200 000). Also upward, NFP data for the previous two months were revised. The number of jobs outside of US agriculture increases for 93 consecutive months, which is the longest such period in the history of such statistics, and speaks of a strong labor market. Steady hiring of workers and low unemployment indicate that the US labor market remains a strong place in the country's economy since the end of the recession nine years ago. At present, activity in other sectors seems to be accelerating as well. Some economists predict that the country's GDP growth in the second quarter exceeded 4% per annum for the first time since 2014. The main US stock indexes today continued to rise against the background of strong macroeconomic indicators for the US, published last week. The escalation of the US trade contradictions with other countries, for the time being, seems to be taking a back seat. *)An advanced fundamental analysis is available on the Tifia Forex Broker website at tifia.com/analytics Support and resistance levels With the opening of the trading day on Monday, DJIA is growing. And the growth is already the fourth trading day. Strong support levels of 24100.0 (EMA200 on the daily chart), 24050.0 (Fibonacci level of 23.6% of the correction to the growth from the level of 15650.0 in the wave, which began in January 2016. The maximum of this wave and the Fibonacci 0% level are near the mark of 26620.0) have stopped falling DJIA in the end of the last month. At the beginning of the European session, DJIA is trading at a strong resistance level of 24580.0 (EMA50 on the daily chart and EMA200 on the 4-hour chart). Breakdown of this resistance level will confirm the resumption of the upward dynamics and bullish trend of DJIA. Indicators OsMA and Stochastics on the 4-hour, daily charts went to the side of buyers. The nearest growth target is resistance level 25400.0 (June highs). In the event of a breakdown of the resistance level 25400.0, the DJIA will head towards resistance levels 25750.0, 26620.0 (absolute and annual highs). In the alternative scenario, the breakdown of the support levels 24050.0, 23800.0 (EMA50 on the weekly chart) will significantly increase the risks of breaking the bullish trend. Support levels: 24380.0, 24100.0, 24050.0, 23800.0, 23120.0, 22450.0 Resistance levels: 24580.0, 25000.0, 25400.0, 25750.0, 26200.0, 26620.0 Trading Scenarios Buy Stop 24610.0. Stop-Loss 24460.0. Take-Profit 25000.0, 25400.0, 25750.0, 26200.0, 26620.0 Sell Stop 24460.0. Stop-Loss 24610.0. Take-Profit 24380.0, 24100.0, 24050.0, 23800.0, 23120.0, 22450.0 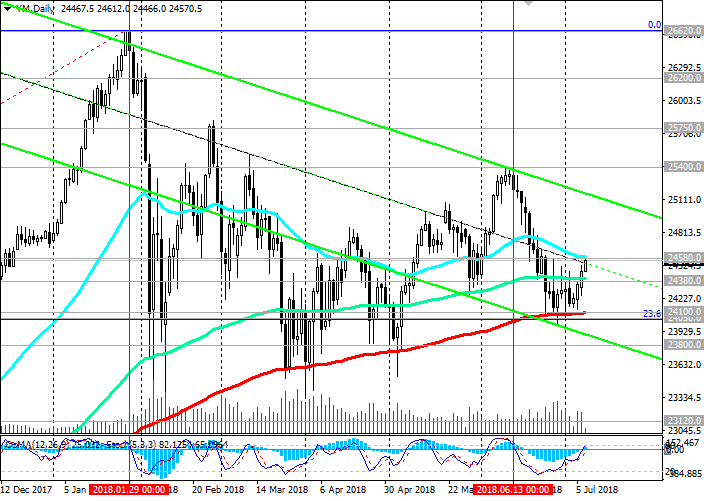 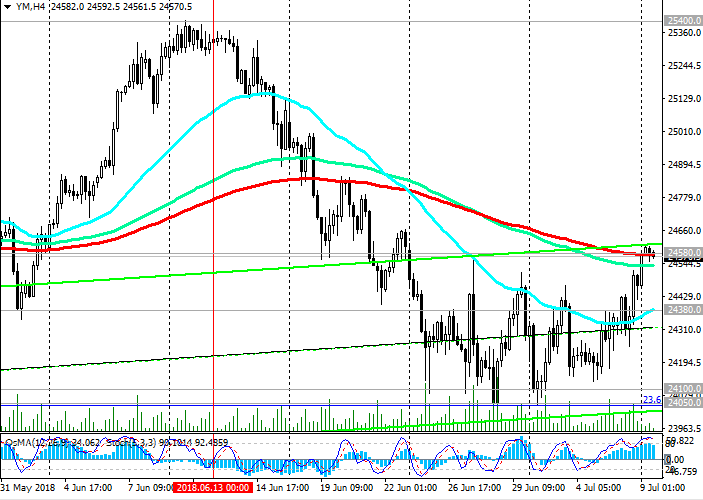 *) For up-to-date and detailed analytics and news on the forex market visit Tifia Forex Broker website tifia.com
|
|
#285
13-07-2018, 12:39
|
||||
|
||||
|
DJIA: indices retain positive dynamics
13/07/2018 Current situation American stock indexes retain a positive dynamics, developing an upward correction. Earlier in the week, the stock market saw a large-scale sale in the light of renewed fears about trade relations between the US and China. As you know, the White House announced its intention to introduce additional 10-percent duties on Chinese goods worth $ 200 billion. Previously, Trump threatened to impose duties on all exports from China, which is $ 505 billion a year. Nevertheless, the threat of an escalation of trade contradictions between the US and China has so far come to the fore. US Treasury Secretary Stephen Mnuchin on Thursday rejected the possibility of consequences of the introduction of duties announced by the administration of US President Donald Trump. Mnuchin said that the US economy will not suffer as a result of these duties. Investors focus on the reports of the largest US companies and on positive macro statistics coming from the US, indicating the acceleration of the growth of the American economy. The producer price index rose in June, which was another sign of increased inflationary pressures in the US. The index of final demand (PPI), which displays the cost of goods and services, appointed by companies, in June rose by 0.3%. Compared to the same period of the previous year, PPI in June grew by 3.4%, which was the strongest annual growth since November 2011. The consumer price index in June increased by 2.9% compared to the same period of the previous year, showing the strongest growth since 2012. Even if the indices are down today, they will end the week in positive territory anyway. *)An advanced fundamental analysis is available on the Tifia Forex Broker website at tifia.com/analytics Support and resistance levels While DJIA is trading above the key support levels of 24130.0 (EMA200 on the daily chart), 24050.0 (the Fibonacci level of 23.6% of the correction to the growth from the level of 15650.0 in the wave, which began in January 2016. The maximum of this wave and the Fibonacci 0% level are near the mark of 26620.0), positive dynamics remain, and the bullish trend is not threatened. Breakdown of the local resistance level of 24940.0 (July highs) will accelerate the recovery and growth of the DJIA. In the event of a breakdown of the resistance level 25400.0 (June highs), the DJIA will head towards the resistance levels 25750.0, 26620.0 (absolute and annual highs). The signal for sales will be a breakdown of the short-term support level of 24630.0 (EMA200 on the 4-hour chart). Support levels: 24630.0, 24400.0, 24130.0, 24050.0, 23800.0, 23120.0, 22450.0 Resistance levels: 24940.0, 25000.0, 25400.0, 25750.0, 26200.0, 26620.0 Trading Scenarios Buy Stop 25020.0. Stop-Loss 24880.0. Take-Profit 25400.0, 25750.0, 26200.0, 26620.0 Sell Stop 24880.0. Stop-Loss 25020.0. Take-Profit 24600.0, 24400.0, 24130.0, 24050.0, 23800.0, 23120.0, 22450.0 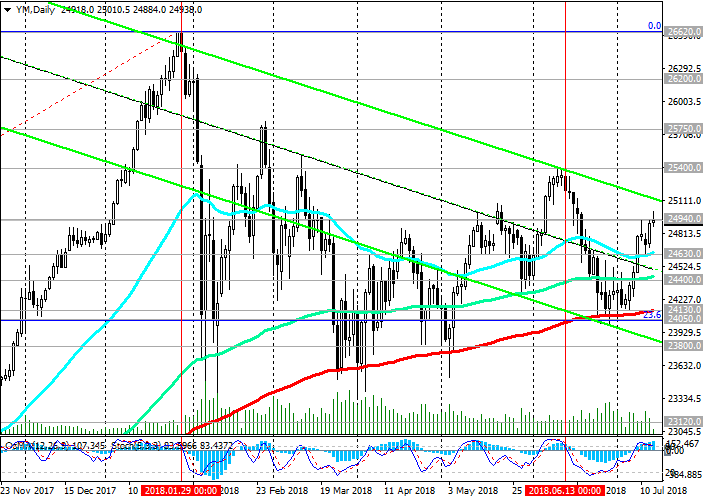 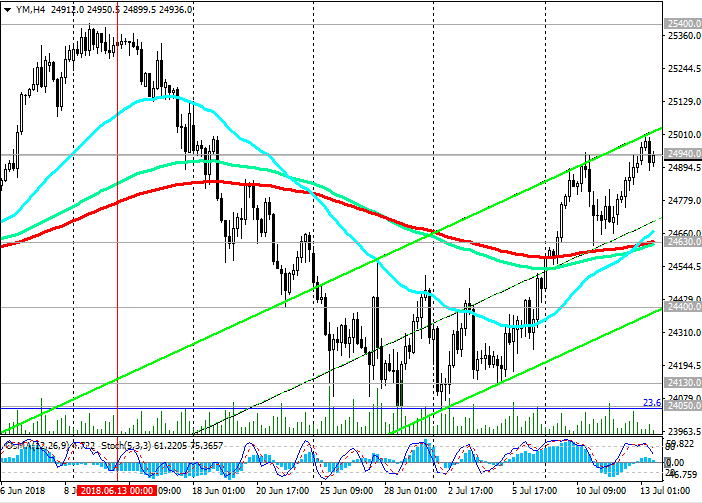 *) For up-to-date and detailed analytics and news on the forex market visit Tifia Forex Broker website tifia.com
|
|
#286
16-07-2018, 11:38
|
||||
|
||||
|
XAU/USD: Demand for the dollar persists
16/07/2018 Current dynamics Despite the continuing, and even accelerating, growth of the US economy, some economists still believe that in the US, in about two years, a recession may begin. This means that the growth of the economy may slow from the middle of next year, and towards its end become zero. The probability of such a scenario is 85%. The basis of such assumptions is the declining difference in yields of 2-year and 10-year US bonds. If this trend continues, then, as historical observations show, in another 12 months a recession may begin. This is a long-term negative scenario for the dynamics of the dollar. Meanwhile, the dollar continues to be in demand and strengthened amid expectations of further tightening of the Fed's monetary policy, as well as positive macro statistics coming from the US. Today at 12:30 (GMT) data on retail sales in the US will be published. A relative decline in sales is expected (+ 0.5% in June against + 0.8% in May). If the data is even weaker, the dollar may fall. Nevertheless, investors will wait for new signals from the head of the Fed, Jerome Powell, regarding monetary policy. Hard Powell rhetoric coupled with positive forecasts will again force investors to buy the dollar. Possibly, Powell will also touch upon the topic of US trade relations with China. As you know, last week the US Treasury Secretary Stephen Mnuchin ruled out the possibility of negative impact on the US economy from the introduction of duties. Mnuchin said that the US economy will not suffer as a result of this. Powell will speak twice this week, on Tuesday (14:00 GMT) and on Wednesday (also at 14:00). If Powell confirms the Fed's desire to further raise rates in the US, then gold will continue to decline in price. In conditions of an increase in the interest rate, the investment attractiveness of the dollar is growing, and of gold is falling. The likelihood that the Fed will raise rates this year four times rose to 60%. This is one of the highest levels this year. *)An advanced fundamental analysis is available on the Tifia Forex Broker website at tifia.com/analytics Support and resistance levels With the opening of the trading day on Monday, the XAU / USD is growing against the background of a weakening dollar. Nevertheless, below the resistance levels of 1250.00 (EMA200 on the 1-hour chart), 1248.00 (the Fibonacci level of 50% of the correction to the wave of decline since July 2016), the downward trend predominates. The signal for purchases will be a breakdown of the short-term resistance level of 1250.00. In this case, corrective growth can last up to resistance level 1268.00 (EMA200 on the 4-hour chart). The breakdown of the support level of 1237.00 (annual lows) will confirm the return of XAU / USD to the global downtrend, which began in October 2012. Support levels: 1237.00, 1220.00 Resistance levels: 1248.00, 1250.00, 1268.00, 1277.00, 1283.00, 1295.00 Trading Scenarios Sell in the market. Stop-Loss 1252.00. Take-Profit 1273.00, 1220.00, 1200.00 Buy Stop 1252.00. Stop-Loss 1239.00. Take-Profit 1268.00, 1277.00, 1283.00, 1295.00 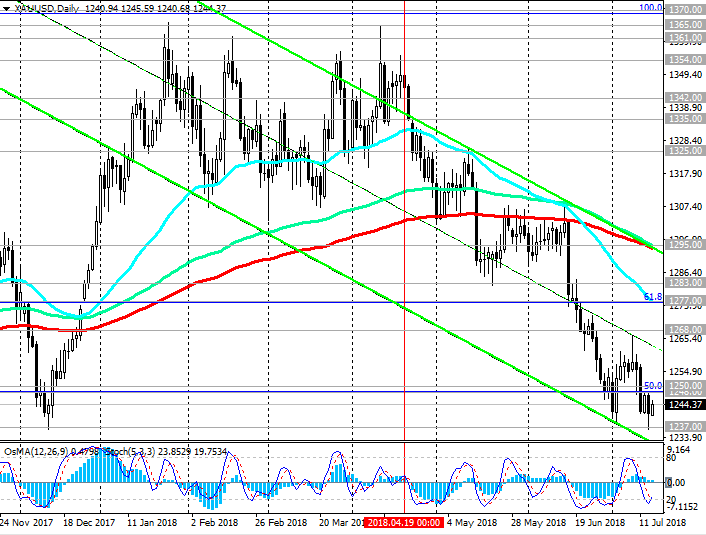 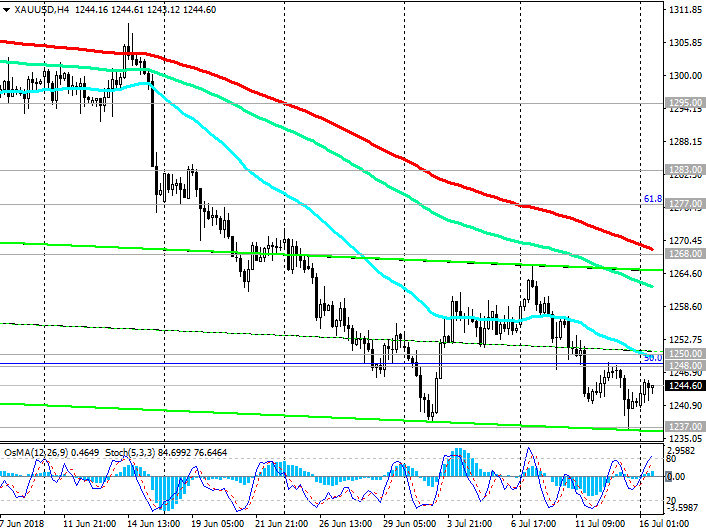 *) For up-to-date and detailed analytics and news on the forex market visit Tifia Forex Broker website tifia.com
|
|
#287
24-07-2018, 11:51
|
||||
|
||||
|
AUD/USD: Corrective Decline
24/07/2018 Support and resistance levels The US dollar is declining on Tuesday. Nevertheless, so far this reduction should be regarded as correctional. The different focus of monetary policy of central banks in the US and Australia will be the main most important long-term factor in favor of weakening the AUD / USD pair. The negative dynamics is prevailing. Short positions are preferred. The immediate goal of the decline is the support level of 0.7330 (lows of the year). In the event of a breakdown of the support level of 0.7330, the targets will be the support levels of 0.7200, 0.7150 (the bottom line of the descending channel on the daily chart). Only if the AUD / USD returns above the key resistance level of 0.7620 (EMA200 on the daily chart) can long-term long positions be considered with targets at the resistance level of 0.7820 (Fibonacci level 23.6% of the correction to the fall wave of the pair since August 2011 and the level of 1.1030 The minimum of this wave is near the level of 0.6830), 0.7860 (EMA200 on the weekly chart). The signal for purchases may be a breakdown of the short-term resistance level 0.7430 (EMA200 on the 4-hour chart). *)An advanced fundamental analysis is available on the Tifia Forex Broker website at tifia.com/analytics Support levels: 0.7395, 0.7330, 0.7270, 0.7155, 0.7025 Resistance levels: 0.7430, 0.7500, 0.7620, 0.7700, 0.7820, 0.7860 Trading Scenarios Sell in the market. Stop-Loss 0.7440. Take-Profit 0.7330, 0.7300, 0.7270, 0.7155, 0.7025 Buy Stop 0.7440. Stop-Loss 0.7385. Take-Profit 0.7500, 0.7620 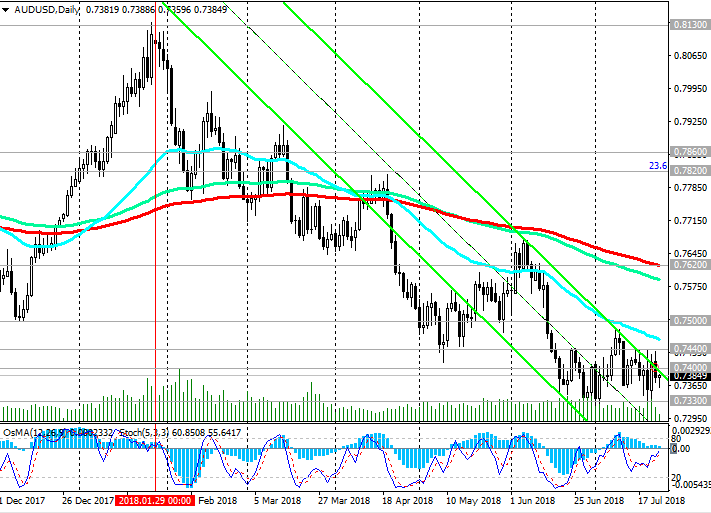 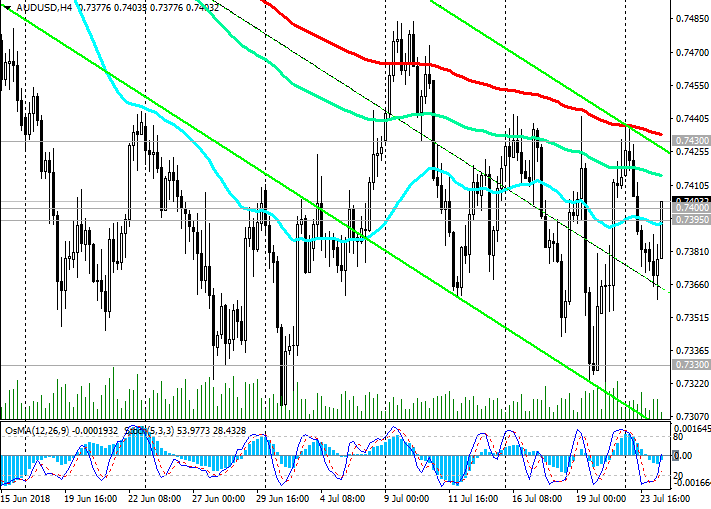 *) For up-to-date and detailed analytics and news on the forex market visit Tifia Forex Broker website tifia.com
|
|
#288
26-07-2018, 11:19
|
||||
|
||||
|
EUR/USD: Trading Scenarios
26/07/2018 Since mid-April, EUR / USD has been trading in a downward channel on the weekly chart, the lower limit of which is near the support level 1.1285 (Fibonacci level 23.6% of the correction to the fall from 1.3900, which began in May 2014). The signal for the resumption of short positions will be the break of the short-term support level 1.1690 (EMA200 on the 1-hour chart). The target of the decline is the level of support 1.1520 (lows of the year). In case of breakdown of the support level 1.1520, the target of further decline will be the level of support 1.1285. The prevailing negative dynamics. An alternative scenario will be connected with the breakdown of the resistance level 1.1750 (EMA200 on the weekly chart) and the rise to the resistance level 1.1850 (EMA200 on the daily chart). Nevertheless, the different orientation of the monetary policies of the Fed and the ECB is the main negative driver for EUR / USD. Short positions are preferred. Today, all the attention of market participants will be focused on the ECB meeting. The decision on the rates will be published at 11:45 (GMT) of the decision on rates. At 12:30 a press conference will begin. ECB President Mario Draghi will give an assessment of the prospects for the European economy and monetary policy of the ECB and explain the decision of the ECB on rates. Any hints of Mario Draghi on the approach of the start of the curtailment of the QE program in the Eurozone will cause the growth of the euro and the EUR / USD. *)An advanced fundamental analysis is available on the Tifia Forex Broker website at tifia.com/analytics Support levels: 1.1700, 1.1690, 1.1600, 1.1575, 1.1520, 1.1400, 1.1285 Resistance levels: 1.1740, 1.1750, 1.1790, 1.1850 Trading Scenarios Sell Stop 1.1680. Stop-Loss 1.1760. Take-Profit 1.1600, 1.1575, 1.1520, 1.1400, 1.1285 Buy Stop 1.1760. Stop-Loss 1.1680. Take-Profit 1.1790, 1.1850 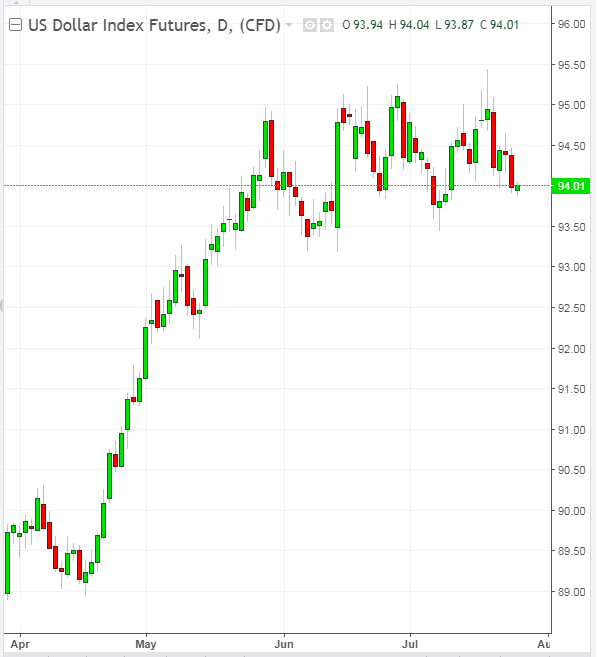 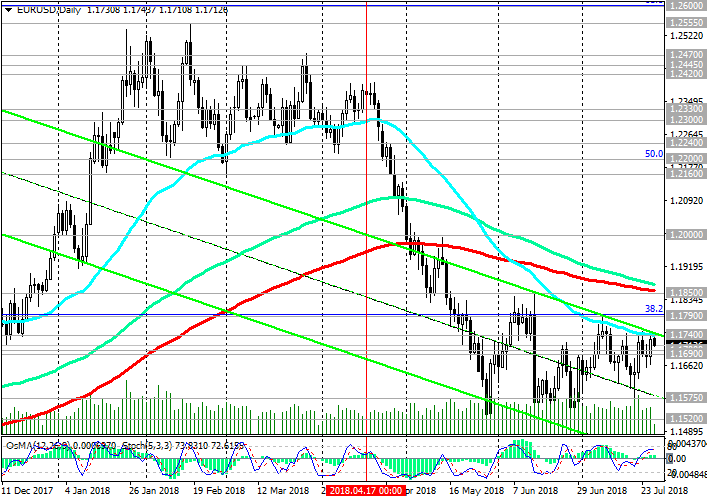 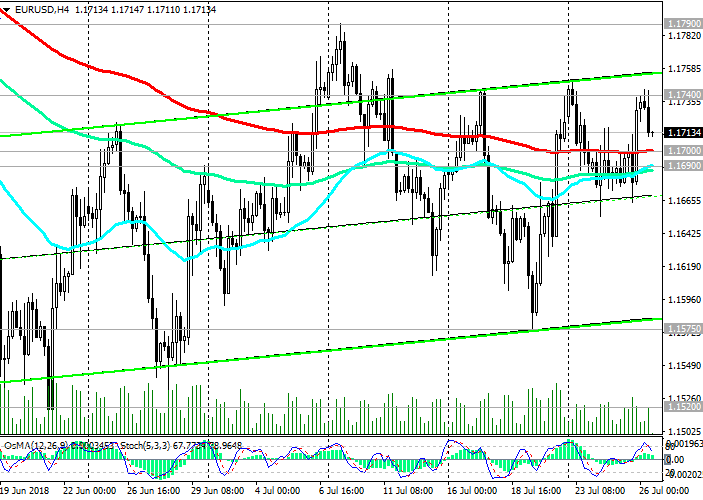 *) For up-to-date and detailed analytics and news on the forex market visit Tifia Forex Broker website tifia.com
|
|
#289
31-07-2018, 11:19
|
||||
|
||||
|
USD/JPY: SUPPORT AND RESISTANCE LEVELS
31/07/2018 The yen fell on Tuesday after the decision of the Bank of Japan to maintain its current monetary policy unchanged. The Bank of Japan retained the key short-term rate at the level of -0.1% and the zero target level of 10-year government bonds yield. A statement by the central bank of Japan said that the bank "intends to maintain current extremely low levels of short-term and long-term interest rates for an extended period". The Bank of Japan reiterated that it wants to achieve the target inflation rate of 2% as soon as possible, although acknowledged that inflation will not reach the target level, at least until the end of 2021. By the beginning of the US trading session, the USD / JPY rose 0.45% to 111.60. The USD / JPY is rising in the upward channel on the daily chart, continuing to trade above the key support levels of 110.20 (the Fibonacci level 38.2% of the pair's correction since August last year and the level of 99.90), 110.00 (EMA200 and lower line of the ascending channel on the daily chart). The further growth of USD / JPY with the nearest target at resistance level 113.10 (Fibonacci level 50% and maximums of the year) is probably. Long-term growth targets - the level of resistance 116.00 (Fibonacci level 61.8%), 118.60 (highs in January 2017). The alternative scenario will be connected with breakdown of short-term support levels of 111.30 (EMA200 on the 1-hour chart), 111.00 (EMA200 on the 4-hour chart) and further decline to the support levels 110.20, 110.00. Nevertheless, against the background of a different focus of monetary policies of the Fed and the Bank of Japan, the upward trend is predominant. Long positions are preferred. *)An advanced fundamental analysis is available on the Tifia Forex Broker website at tifia.com/analytics Support levels: 111.30, 111.00, 110.20, 110.00 Resistance levels: 112.00, 112.25, 113.10, 113.70, 114.00, 114.40, 115.00, 116.00 Trading Scenarios Buy Stop 111.65. Stop Loss 111.20. Take-Profit 112.00, 112.25, 113.10, 113.70, 114.00, 114.40, 115.00, 116.00 Sell Stop 111.20. Stop Loss 111.65. Take-Profit 111.00, 110.20, 110.00 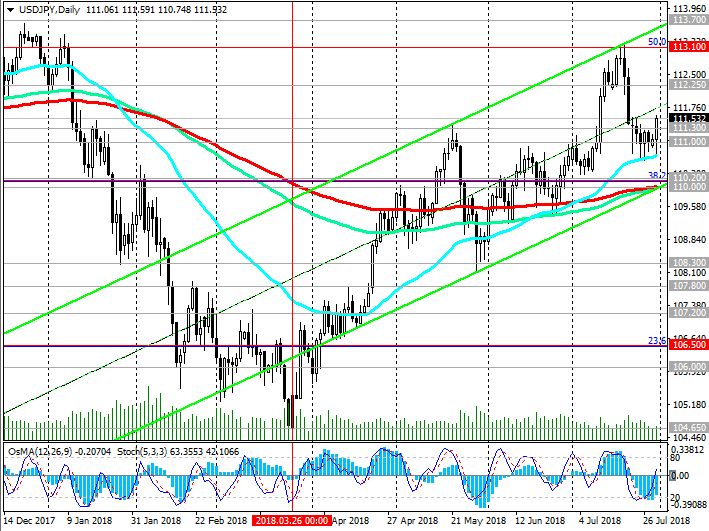 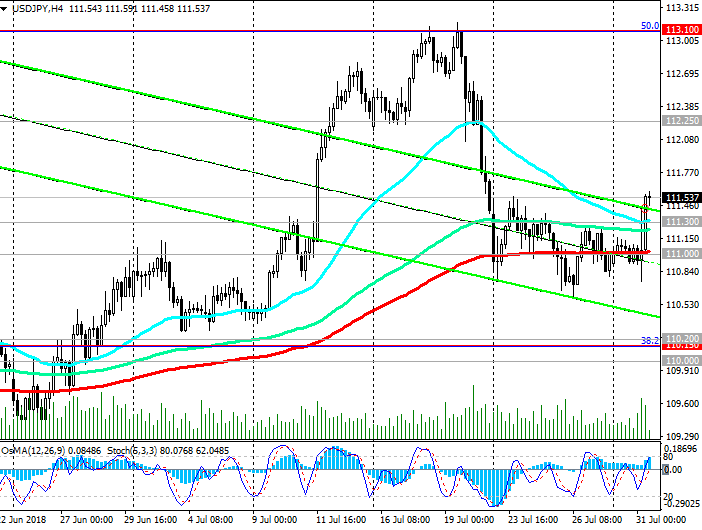 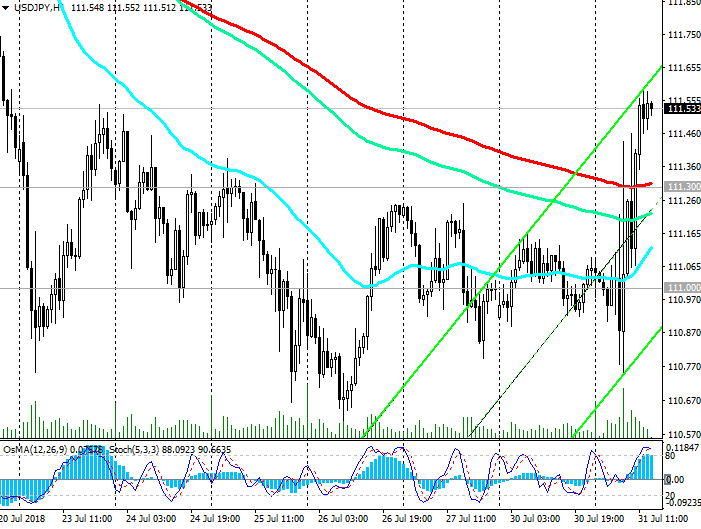 *) For up-to-date and detailed analytics and news on the forex market visit Tifia Forex Broker website tifia.com
|
|
#290
02-08-2018, 09:31
|
||||
|
||||
|
GBP/USD: Support and resistance levels
02/08/2018 From the middle of April and from the level of 1.4340, the GBP / USD fell sharply. The decrease to current levels was almost 10%. Starting in May, GBP / USD is traded in a downward channel on the daily chart, the lower limit of which is near the support level of 1.2900. Below the nearest resistance levels 1.3213 (the Fibonacci level of 23.6% of the correction to the GBP / USD decline in the wave, which began in July 2014 near the level of 1.7200), 1.3248 (EMA50 and the upper limit of the descending channel on the daily chart), only short positions should be considered. The negative dynamics is maintained, and if the decline continues, the 1.2900 mark will be the immediate target. The further target of the decline is the level of 1.2590 (June 2017 lows). The signal for corrective growth will be a confirmed short-term resistance level of 1.3127 (EMA200 on the 1-hour chart) breakdown. In this case, the corrective growth can continue to the resistance levels 1.3213, 1.3248. Short positions are preferred, long-term bearish trend is maintained. *)An advanced fundamental analysis is available on the Tifia Forex Broker website at tifia.com/analytics Support levels: 1.3055, 1.3000, 1.2960, 1.2900 Resistance levels: 1.3127, 1.3213, 1.3248, 1.3335, 1.3445 Trading Scenarios Sell in the market. Stop-Loss 1.3140. Take-Profit 1.3055, 1.3000, 1.2960, 1.2900 Buy Stop 1.3140. Stop-Loss 1.3090. Take-Profit 1.3213, 1.3248, 1.3335, 1.3445 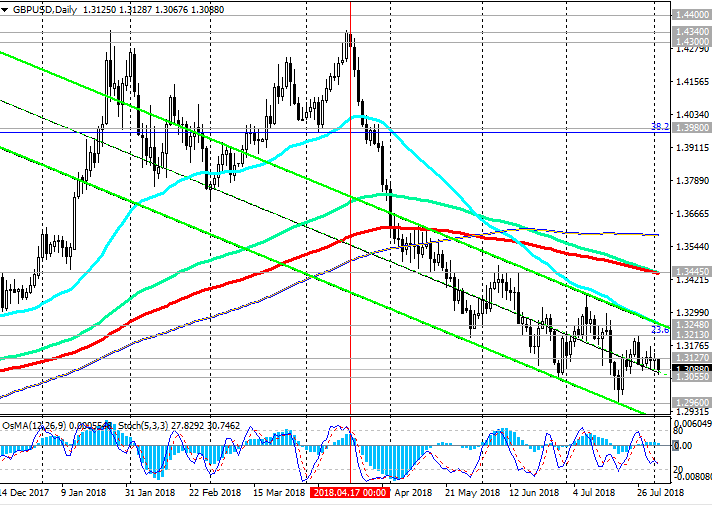 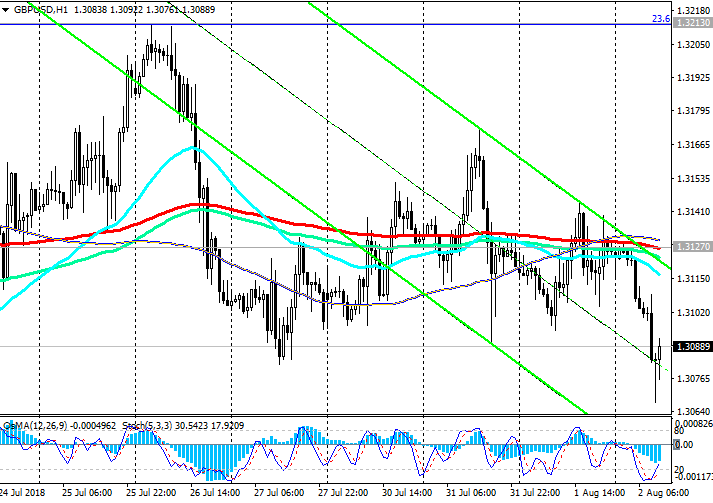 *) For up-to-date and detailed analytics and news on the forex market visit Tifia Forex Broker website tifia.com
|
|
#291
08-08-2018, 12:07
|
||||
|
||||
|
NZD/USD: Trading Scenarios on the eve of the RBNZ meeting
08/08/2018 Since mid-April, the NZD / USD has been trading in a downward channel, falling from the level of 0.7380. After the breakdown of the important support levels of 0.7240 (the Fibonacci level 38.2% of the upward correction to the global wave of decline of the pair from the level of 0.8800, which began in July 2014; the wave minimums are near the level of 0.6260), 0.7200 (EMA200 on the weekly chart) the NZD / USD decline accelerated. In July, NZD / USD reached multi-month lows near the 0.6690 mark. However, later, NZD / USD "fell into a drift", having spent July in the range between the levels of 0.6725, 0.6865 (Fibonacci level of 23.6%). The negative trend persists, and NZD / USD is traded in the descending channel on the daily chart. In case of breakdown of support levels of 0.6725, 0.6690 NZD / USD will target at May 2016 lows near the 0.6675 mark. A signal for the development of an upward correction may be a breakdown of the short-term resistance level 0.6762 (EMA200 on a 1-hour chart). The correction target may be the level of resistance 0.6865 (Fibonacci level of 23.6% and the upper limit of the range formed in July). The strong negative dynamics prevails. Indicators OsMA and Stochastics on the daily, weekly, monthly charts are on the side of sellers. Below the resistance level 0.6865 short positions are preferred. The global downtrend, which began in July 2014, resumed. Today at 22:00 (GMT) the decision of the RBNZ on the interest rate will be published. Probably, the interest rate will remain at the same level of 1.75%. If, during a press conference that starts at 11:00 pm (GMT), signals about the possibility of tightening monetary policy in the near future will sound, then the New Zealand dollar may strengthen, including against the US dollar. Nevertheless, the growth of NZD against the USD will be short-term. *)An advanced fundamental analysis is available on the Tifia Forex Broker website at tifia.com/analytics Support levels: 0.6725, 0.6700, 0.6690, 0.6675 Resistance levels: 0.6762, 0.6807, 0.6865, 0.6900, 0.6965, 0.7010 Trading Scenarios Sell Stop 0.6720. Stop-Loss 0.6765. Take-Profit 0.6700, 0.6690, 0.6675, 0.6600 Buy Stop 0.6765. Stop-Loss 0.6720. Take-Profit 0.6805, 0.6865, 0.6900, 0.6965, 0.7010  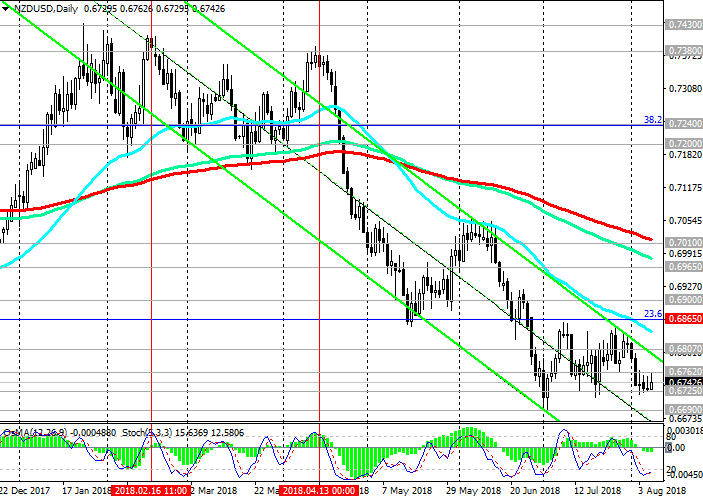 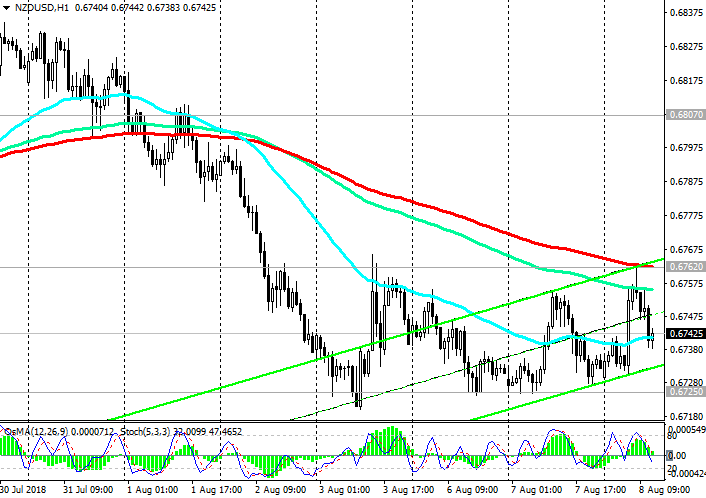 *) For up-to-date and detailed analytics and news on the forex market visit Tifia Forex Broker website tifia.com
|
|
#292
09-08-2018, 10:42
|
||||
|
||||
|
WTI: Support and resistance levels
09/08/2018 After in July, the prices for WTI oil reached the next annual maximum near the mark of 73.85 dollars per barrel, later prices fell sharply. As a result of a sharp decline on Wednesday, the price reached the first important support level of 65.87 (EMA144 on the daily chart). If downward dynamics develop, the targets will be support levels of 65.50 (Fibonacci level 23.6% of the correction to the wave of growth, which began in June 2017 with a support level near the 42.00 mark), 64.15 (EMA200 on the daily chart). Indicators OsMA and Stochastics on the 4-hour, daily, weekly, monthly charts are on the side of sellers. The bullish trend persists until WTI oil trades above the key support level 64.15 (EMA200 on the daily chart). In case of return to the zone above the resistance level of 68.50 (EMA200 on a 4-hour grafik, as well as EMA50 and the lower boundary of an ascending channel on the daily chart), the price increase will resume. Support levels: 65.87, 65.50, 64.15, 63.00, 61.00 Resistance levels: 68.50, 69.50, 70.00, 72.80, 75.00 *)An advanced fundamental analysis is available on the Tifia Forex Broker website at tifia.com/analytics Trading Scenarios Sell Stop 65.70. Stop-Loss 66.80. Take-Profit 65.50, 64.15, 63.00, 61.00 Buy Stop 66.80. Stop-Loss 65.70. Take-Profit 68.50, 69.50, 70.00, 72.80, 75.00 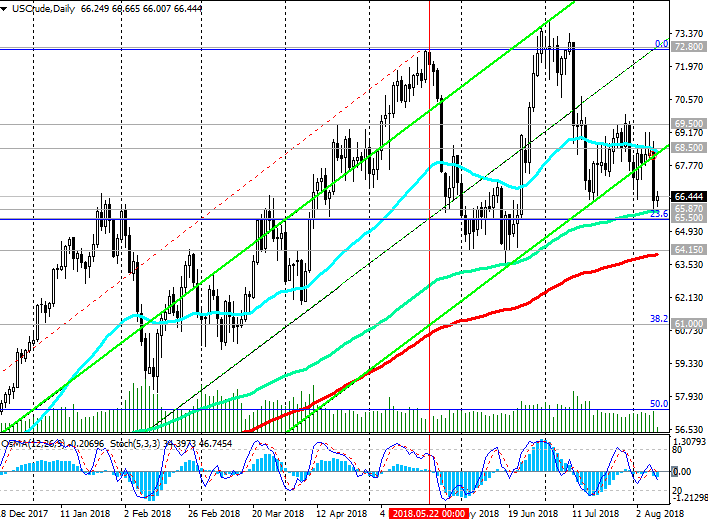 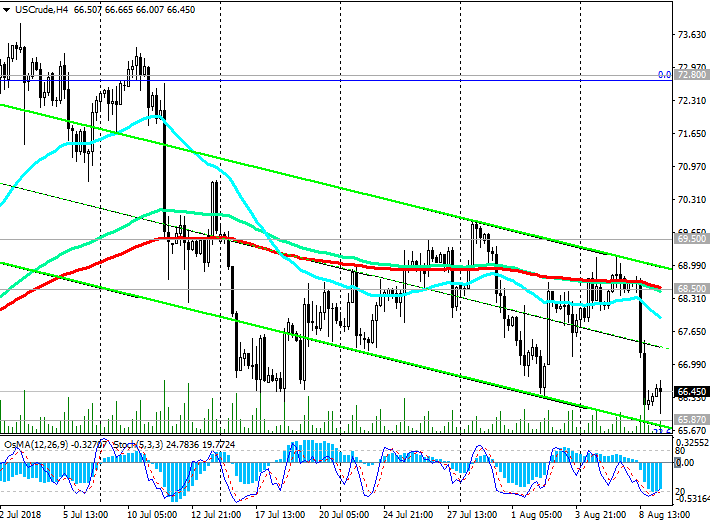 *) For up-to-date and detailed analytics and news on the forex market visit Tifia Forex Broker website tifia.com
|
|
#293
14-08-2018, 12:14
|
||||
|
||||
|
AUD/USD: Prospects for AUD
14/08/2018 Prospects for AUD look negative against the US dollar. The unfavorable external background (the intensification of international trade conflicts), as well as the different orientation of the monetary policies of the Fed and the RBA (economists believe that the RBA will not raise rates by the end of 2020), create fundamental prerequisites for further decline of the AUD / USD. It is necessary to consider the possibility of entering into the short positions on AUD / USD. This is best done by rolling back to the nearest resistance levels of 0.7290 (EMA200 on the 15-minute chart), 0.7320 (EMA200 on the 30-minute chart), 0.7350 (EMA200 on the 1-hour chart). The immediate goal of the decline is the support level of 0.7155 (the lows of 2017 and May 2016). The alternative scenario involves a breakdown of the resistance level of 0.7395 (EMA200 on the 4-hour chart) and the continuation of the growth to resistance levels of 0.7500 (minima of December), 0.7580 (EMA200 on the daily chart). The downward global trend that began in July 2014 predominates. Short positions are preferred. *)An advanced fundamental analysis is available on the Tifia Forex Broker website at tifia.com/analytics Support levels: 0.7200, 0.7155, 0.7100 Resistance levels: 0.7290, 0.7320, 0.7355, 0.7395, 0.7500, 0.7580 Trading Scenarios Sell in the market. Sell Limit 0.7290, 0.7320, 0.7350. Stop-Loss 0.7370. Take-Profit 0.7200, 0.7155, 0.7100 Buy Stop 0.7410. Stop-Loss 0.7370. Take-Profit 0.7500, 0.7580 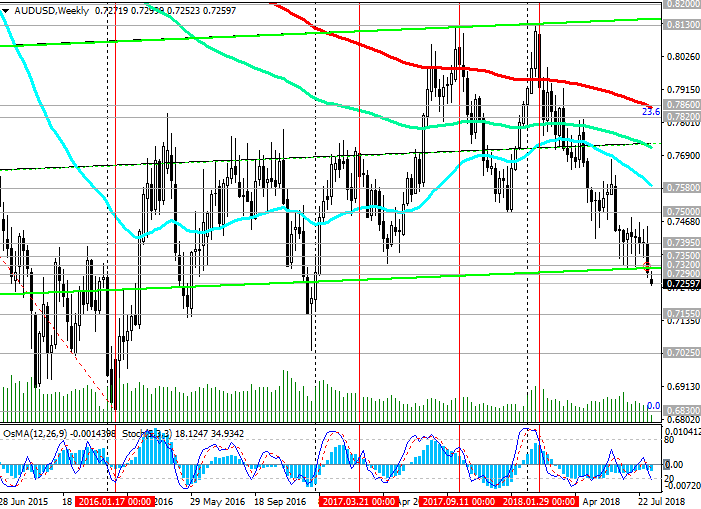 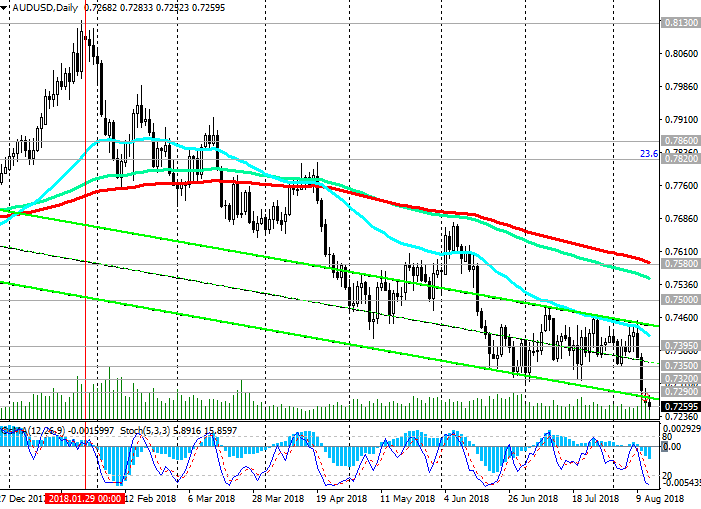 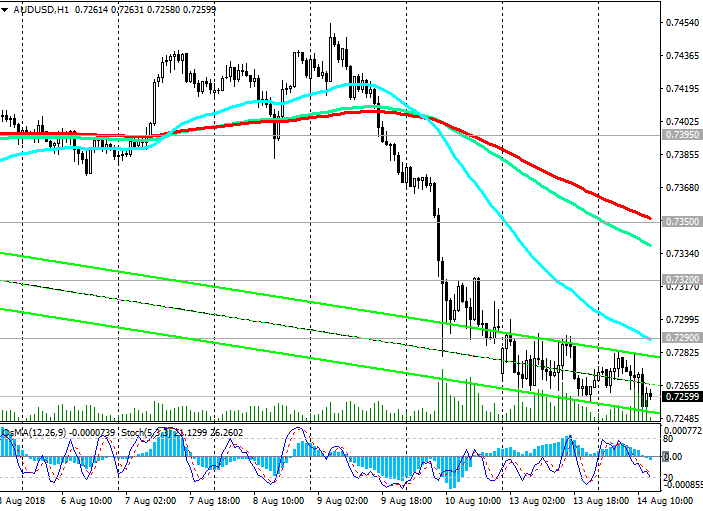 *) For up-to-date and detailed analytics and news on the forex market visit Tifia Forex Broker website tifia.com
|
|
#294
16-08-2018, 11:47
|
||||
|
||||
|
XAU/USD: Support and resistance levels
16/08/2018 Since mid-April, XAU / USD is trading in a downtrend. Below the key resistance level of 1277.00 (EMA200 on the daily chart and the Fibonacci level of 61.8%) is dominated by a downward trend. On Thursday, the pair XAU / USD moved into the corrective phase, consolidating to the nearest resistance level at 1185.00 (Fibonacci level of 23.6% of the correction to the wave of decline since July 2016). The signal for buying and developing an alternative scenario will be a breakdown of the short-term resistance level 1200.00 (EMA200 on the 1-hour chart). In this case, corrective growth can last up to resistance level 1220.00 (EMA200 on the 4-hour chart and Fibonacci level of 38.2%). Below this level, sales look safe. Short positions are preferred. The XAU / USD on Wednesday broke the last strong support level at 1185.00 (the Fibonacci level 23.6% of the correction to the wave of decline since July 2016). The breakdown of the support level of 1185.00 (the Fibonacci level of 23.6%) could mean the return of XAU / USD to the global downtrend, which began in October 2012. *)An advanced fundamental analysis is available on the Tifia Forex Broker website at tifia.com/analytics Support levels: 1175.00, 1160.00, 1128.00 Resistance levels: 1185.00, 1200.00, 1220.00, 1237.00, 1248.00, 1268.00, 1277.00 Trading Scenarios Sell Stop 1174.00. Stop-Loss 1186.00. Take-Profit 1170.00, 1160.00, 1120.00, 1128.00 Buy Stop 1186.00. Stop-Loss 1174.00. Take-Profit 1200.00, 1220.00, 1237.00, 1248.00, 1268.00, 1277.00  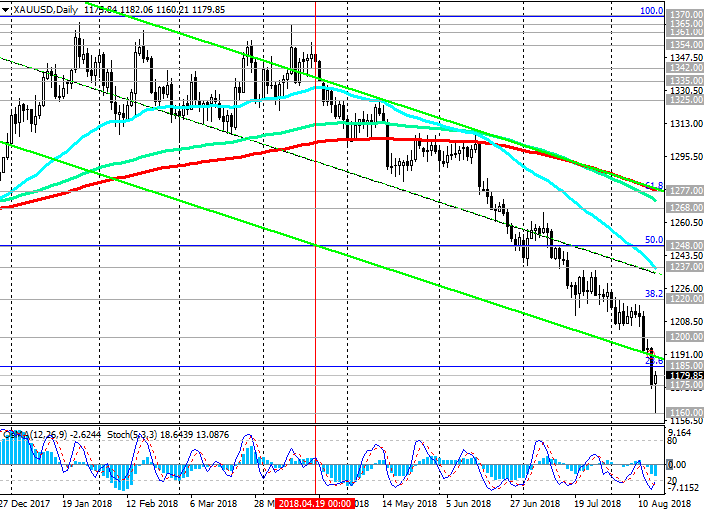 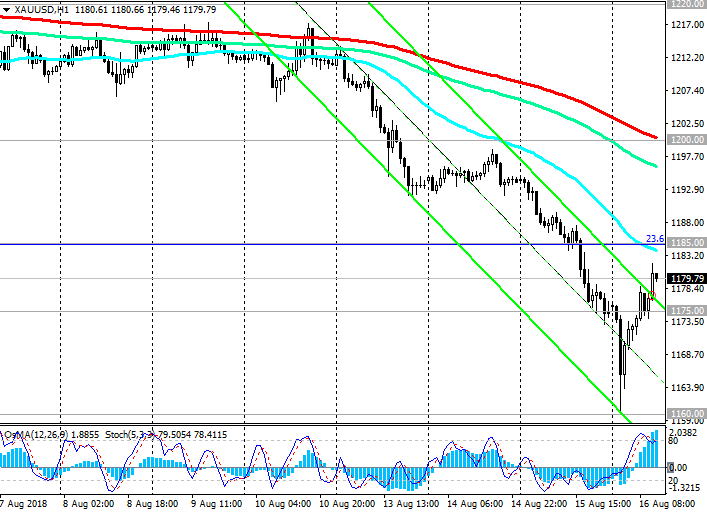 *) For up-to-date and detailed analytics and news on the forex market visit Tifia Forex Broker website tifia.com
|
|
#295
20-08-2018, 12:32
|
||||
|
||||
|
AUD/USD: Support and resistance levels
20/08/2018 The different focus of monetary policy of central banks in the US and Australia will be the main most important long-term factor in favor of weakening the AUD / USD pair. Since the beginning of the year, the AUD / USD has been actively declining. AUD / USD develops a downward trend, trading in the downward channel on the daily chart, the lower limit of which near the support level of 0.7155 passes. Indicators OsMA and Stochastics on long-term periods (weekly and monthly) indicate short positions. In case of further decrease in AUD / USD, the targets will be support levels of 0.7235 (August lows), 0.7155 (the bottom line of the descending channel on the daily chart). Only in case of the return of AUD / USD to the zone above the key resistance level of 0.7570 (EMA200 on the daily chart) long-term long positions can be considered with targets at the levels of 0.7820 (EMA200 on the weekly chart and Fibonacci level of 23.6% of the correction to the fall wave from August 2011 year and level 1.1030. The minimum of this wave is near the level of 0.6830). The signal for purchases may be a breakdown of the short-term resistance level 0.7370 (EMA200 on the 4-hour chart). So far, negative dynamics prevails. Short positions are preferred. The immediate goal of the decline is the support level of 0.7235 (the lows of the year and August). The AUD / USD is returning to the global downtrend, which began in August 2011. *)An advanced fundamental analysis is available on the Tifia Forex Broker website at tifia.com/analytics Support levels: 0.7300, 0.7235, 0.7200, 0.7155, 0.7100 Resistance levels: 0.7320, 0.7350, 0.7370, 0.7500, 0.7570 Trading Scenarios Sell Stop 0.7290. Stop-Loss 0.7330. Take-Profit 0.7235, 0.7200, 0.7155, 0.7100 Buy Stop 0.7330. Stop-Loss 0.7290. Take-Profit 0.7350, 0.7370, 0.7500, 0.7570 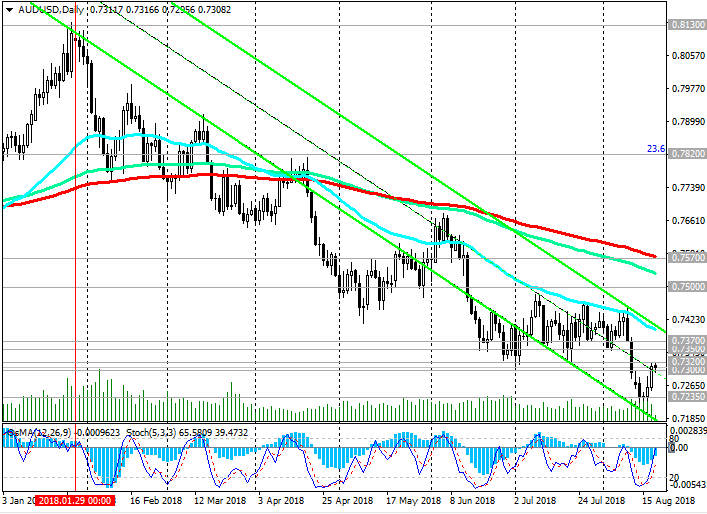 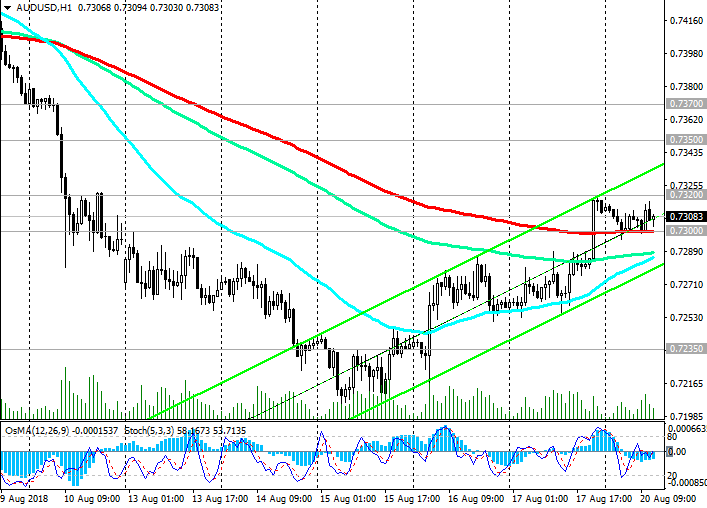 *) For up-to-date and detailed analytics and news on the forex market visit Tifia Forex Broker website tifia.com
|
|
#296
21-08-2018, 10:59
|
||||
|
||||
|
DJIA: stock markets are growing
21/08/2018 Current situation US and world stock indexes continue to grow. Investors were encouraged by reports of the resumption of negotiations between the US and China with a view to resolving the trade conflict between the countries. Market participants also expect that strong US economic data and financial results of companies will continue to support the indices. DJIA rose on Monday by 0.3%, to 25758.69 points, the highest level of closure since February 1. S&P500 added 0.2%, reaching 2857.05 points, which is 0.6% lower than the January record. Nasdaq Composite increased by 0.1%, to 7821.01 points. All three major US indices are growing on Tuesday for 4 consecutive days. The main risk for the economy and the stock market at the moment are trade conflicts. As they weaken, the growth of US stock indices is likely to accelerate. *)An advanced fundamental analysis is available on the Tifia Forex Broker website at tifia.com/analytics Support and resistance levels DJIA retains positive dynamics, trading in the ascending channels on the daily and weekly charts. Above the short-term support level of 25260.0 (EMA200 on the 4-hour chart and the bottom line of the rising channel on the daily chart), only long positions should be considered. The breakdown of the support level of 25260.0 may provoke a deeper correction decrease to the key support levels 24775.0 (EMA144 on the daily chart), 24450.0 (EMA200 on the daily chart). Near these levels also passes the bottom line of the rising channel on the weekly chart. In general, the positive dynamics remains. Only the breakdown of the support level of 24050.0 (the Fibonacci retracement level of 23.6% of the correction to the growth from the level of 15650.0 in the wave that began in January 2016. The maximum of this wave and the 0% Fibonacci level are near the 26620.0 mark) may call into question the DJIA's bullish trend. DJIA is growing, heading toward resistance level 26620.0 (absolute and annual highs). Support levels: 25670.0, 25260.0, 25000.0, 24775.0, 24450.0, 24050.0 Resistance levels: 26000.0, 26200.0, 26620.0 Trading Scenarios Buy in the market. Stop-Loss 25650.0. Take-Profit 26200.0, 26620.0 Sell Stop 25650.0. Stop-Loss 25800.0. Take-Profit 25260.0, 25000.0, 24775.0, 24450.0 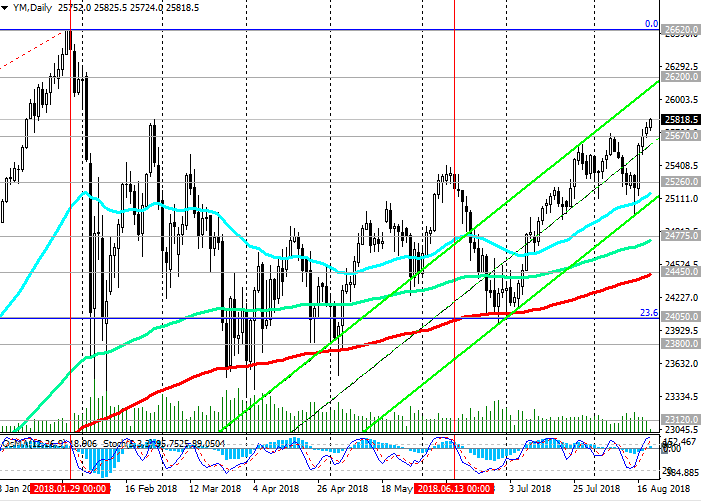 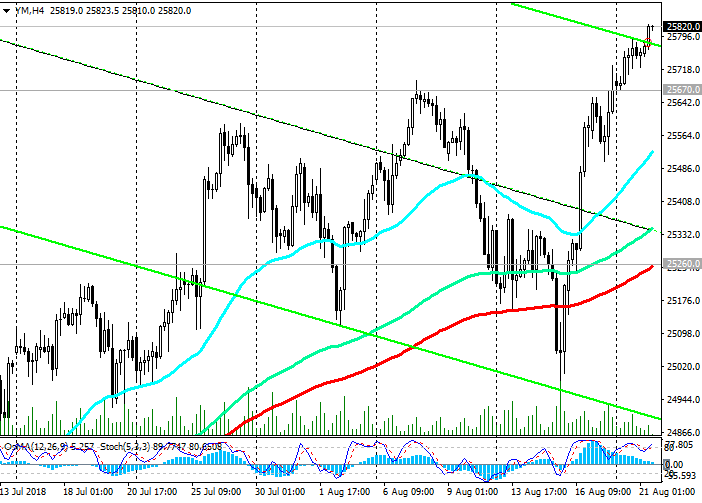 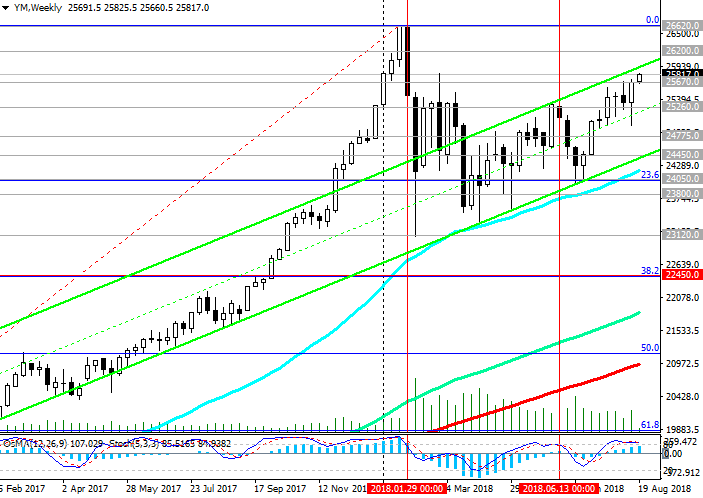 *) For up-to-date and detailed analytics and news on the forex market visit Tifia Forex Broker website tifia.com
|
|
#297
24-08-2018, 12:14
|
||||
|
||||
|
NZD/USD: Support and resistance levels
24/08/2018 Since mid-April, the NZD / USD has been trading in a downward channel, falling from the level of 0.7380. In August, NZD / USD reached multi-month lows near the 0.6548 mark. The negative trend persists, and NZD / USD is traded in the descending channel on the daily chart. In the event of a breakdown of the support level of 0.6548, NZD / USD will target at lows 2015 near the 0.6260 mark. The objective of the upward correction after the breakdown of the resistance level 0.6715 (EMA200 on the 4-hour chart) may be the resistance level of 0.6865 (Fibonacci level of 23.6% of the upward correction to the global wave of the pair's decline from the level of 0.8800, which began in July 2014, level of 0.6260 and the upper limit of the range formed in July). The prevailing negative dynamics. Short positions are preferred. The global downtrend, which began in July 2014, resumed. Investors are preparing for the speech of Federal Reserve Chairman Jerome Powell at a symposium in Jackson Hole on Friday (14:00 GMT). Investors are interested in Powell's opinion about the growing US-China trade confrontation and the prospects for the monetary policy of the Fed. *)An advanced fundamental analysis is available on the Tifia Forex Broker website at tifia.com/analytics Support levels: 0.6600, 0.6548, 0.6500, 0.6410 Resistance levels: 0.6650, 0.6715, 0.6750, 0.6865, 0.6900, 0.6965 Trading Scenarios Sell Stop 0.6620. Stop-Loss 0.6665. Take-Profit 0.6600, 0.6548, 0.6500, 0.6410 Buy Stop 0.6665. Stop-Loss 0.6620. Take-Profit 0.6715, 0.6750, 0.6865, 0.6900, 0.6965 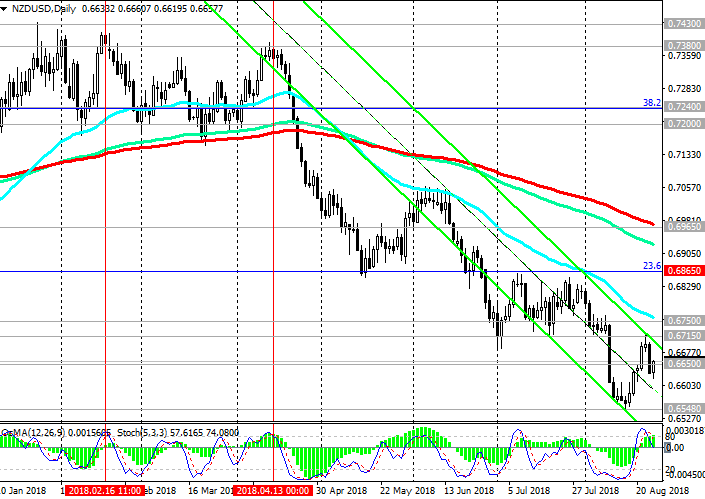 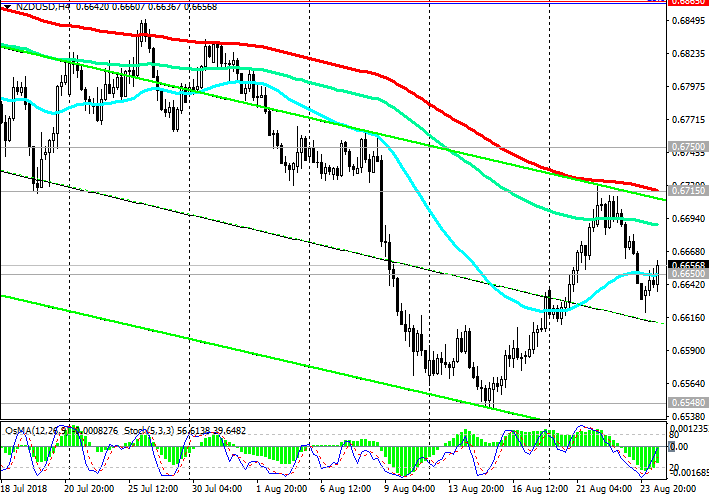 *) For up-to-date and detailed analytics and news on the forex market visit Tifia Forex Broker website tifia.com
|
|
#298
28-08-2018, 12:16
|
||||
|
||||
|
DJIA: stock markets are growing
28/08/2018 Current situation US and world stock indexes continue to grow. Investors were encouraged by reports that the US and Mexico were approaching the conclusion of a treaty on the revision of the North American Free Trade Agreement (NAFTA), ignoring the possibility of excluding Canada from the trade union. On the eve of Nasdaq, in which the technological sector has a lot of weight, for the first time overcame the mark of 8,000 points. The S&P 500 also reached new absolute record levels. DJIA rose from the beginning of the week by 1.16% to 26105.0, the mark at which it traded at the beginning of the European session on Tuesday. All three major US indices are growing on Tuesday for 3 consecutive days after Friday, Fed Chairman Jerome Powell said that the gradual increase in interest rates remains appropriate. However, Powell did not signal that the central bank will accelerate rates of rate hikes in the coming months. He said that the Fed plans to raise rates to a level that will neither stimulate nor slow economic growth. The main risk for the economy and the stock market at the moment are trade conflicts. As they weaken, the growth of US stock indices is likely to accelerate. *)An advanced fundamental analysis is available on the Tifia Forex Broker website at tifia.com/analytics Support and resistance levels DJIA retains positive dynamics, trading in the ascending channels on the daily and weekly charts. Above the short-term support level 25420.0 (EMA200 on the 4-hour chart and the bottom line of the upward channel on the daily chart), only long positions should be considered. The breakdown of the support level of 25420.0 may provoke a deeper correction decrease to the key support levels of 24830.0 (EMA144 on the daily chart), 24530.0 (EMA200 on the daily chart). Near these levels also passes the bottom line of the rising channel on the weekly chart. In general, the positive dynamics remains. Only the breakdown of the support level of 24050.0 (Fibonacci level of 23.6% of the correction to the increase with the level of 15650.0 in a wave that began in January 2016. The maximum of the wave and Fibonacci level of 0% are near the mark 26620.0) could jeopardize the bullish trend of the DJIA. DJIA is growing, heading toward resistance level 26620.0 (absolute and annual highs). Support levels: 26000.0, 25750.0, 25420.0, 25000.0, 24830.0, 24530.0, 24050.0 Resistance levels: 26200.0, 26620.0 Trading Scenarios Buy in the market. Stop-Loss 26000.0. Take-Profit 26200.0, 26620.0 Sell Stop 26000.0. Stop-Loss 26140.0. Take-Profit 25750.0, 25420.0, 25000.0, 24830.0, 24530.0, 24050.0 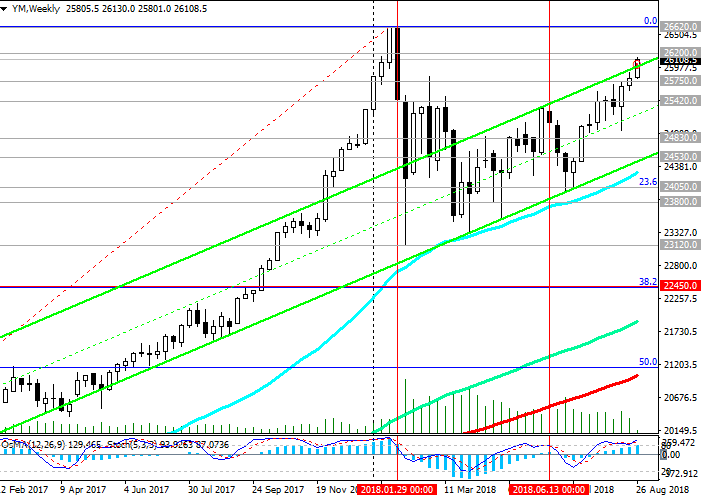 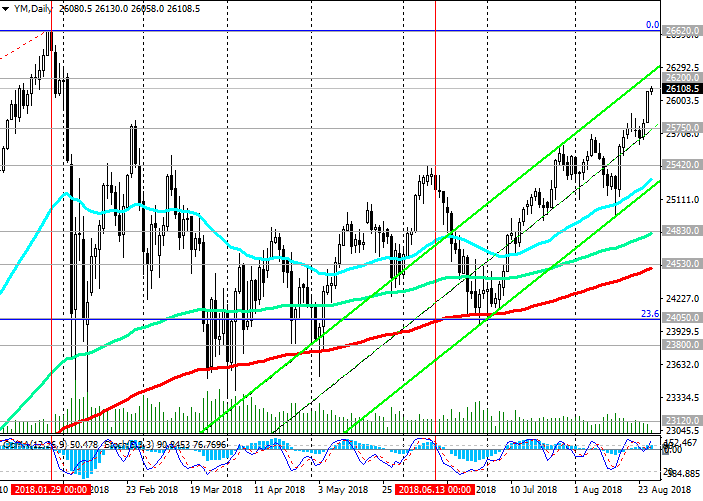 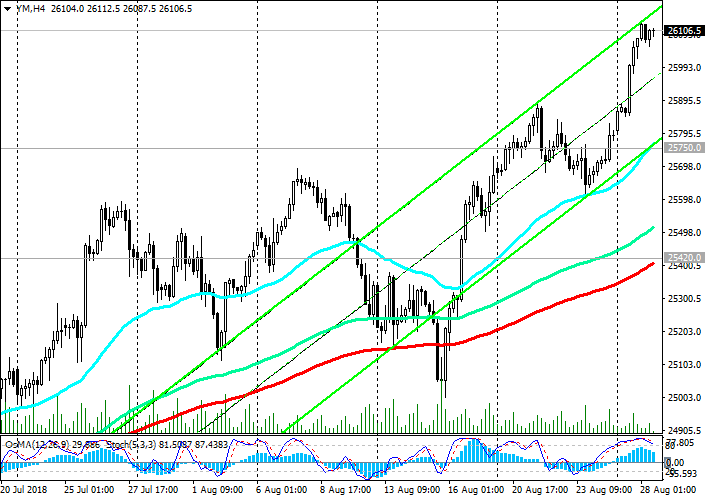 *) For up-to-date and detailed analytics and news on the forex market visit Tifia Forex Broker website tifia.com
|
|
#299
30-08-2018, 11:36
|
||||
|
||||
|
USD/CAD: Support and resistance levels
30/08/2018 The USD / CAD keeps the medium-term negative dynamics, trading in the downward channel on the daily chart. At the same time, USD / CAD remains in the upward channel on the weekly chart, the upper limit of which passes near the resistance level 1.3600 (the highs of November, December 2016). While USD / CAD is trading above the important support level of 1.2930 (200-period moving average on the daily chart), long-term positive dynamics remain. In the vicinity of this support level 1.2930, the bottom line of the upward channel and EMA50 on the weekly chart also pass. Thus, the support level of 1.2930 is the key. In case of its breakdown, USD / CAD will go to support levels 1.2800 (EMA144 on the weekly chart), 1.2740 (Fibonacci level 38.2% of the downward correction to the pair's growth in the global uptrend from September 2012 and the 0.9700 mark). The breakdown of the support level 1.2625 (EMA200 on the weekly chart) raises the risks of the final breakdown of the bullish USD / CAD trend. The growth scenario is related to the breakdown of the resistance level 1.3050 (EMA200 on the 4-hour chart) and the resumption of positive dynamics within the rising channel on the weekly chart. The first signal for purchases will be the breakdown of the nearest short-term resistance level of 1.2995 (EMA200 on the 1-hour chart). *)An advanced fundamental analysis is available on the Tifia Forex Broker website at tifia.com/analytics Support levels: 1.2930, 1.2900, 1.2800, 1.2740, 1.2625 Resistance levels: 1.2995, 1.3050, 1.3130, 1.3200, 1.3285, 1.3380, 1.3450 Trading Scenarios Sell Stop 1.2890. Stop-Loss 1.2945. Take-Profit 1.2800, 1.2740, 1.2625 Buy Stop 1.2945. Stop-Loss 1.2890. Take-Profit 1.2995, 1.3050, 1.3130, 1.3200, 1.3285, 1.3380, 1.3450 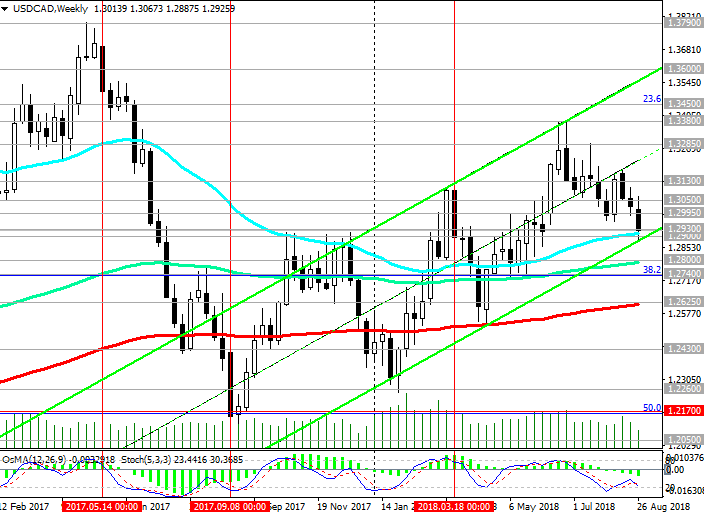 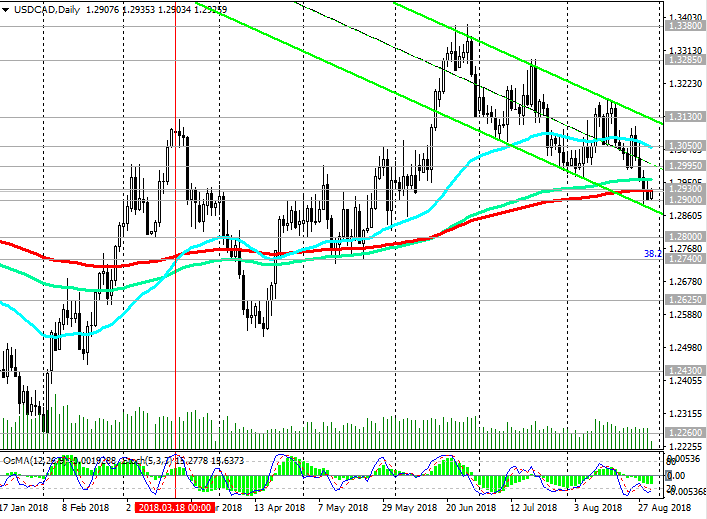 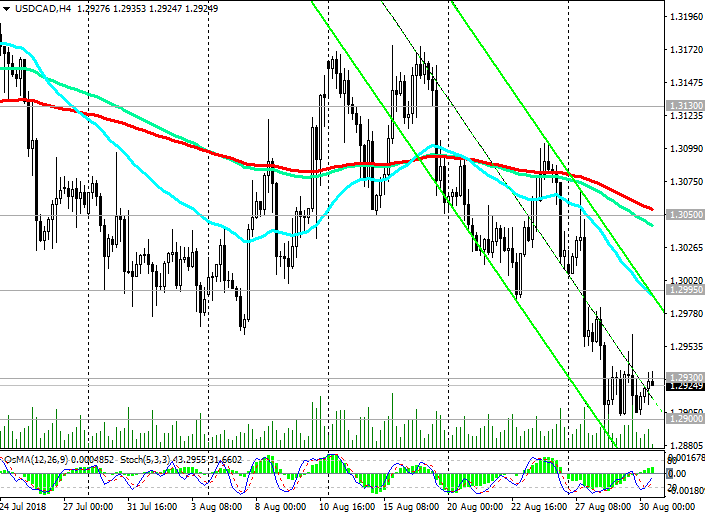 *) For up-to-date and detailed analytics and news on the forex market visit Tifia Forex Broker website tifia.com
|
|
#300
04-09-2018, 11:32
|
||||
|
||||
|
USD/CAD: Support and resistance levels
04/09/2018 On Wednesday (14:00 GMT) the Bank of Canada decision on rates will be published. It is likely that in the face of the unresolved issue on NAFTA, the Bank of Canada is unlikely to decide to change its monetary policy. The interest rate is likely to remain at 1.50%. On Tuesday, USD / CAD broke the upper limit of the downward channel on the daily chart, thus breaking the medium-term negative dynamics. Indicators OsMA and Stochastics on the 4-hour, daily, weekly charts went to the side of buyers. Above the short-term support level 1.3055 (EMA200 on the 4-hour chart, EMA50 on the daily chart) long positions are preferred. In general, long-term upward dynamics persist, and USD / CAD is rising in the upward channel on the weekly chart, the upper limit of which is near the resistance level 1.3600 (highs of November, December 2016). The support level of 1.2930 (200-period moving average on the daily chart) is the key, long-term positive dynamics remain above it. Long positions are relevant. The first signal for the development of an alternative scenario may be a decline to a zone below the 1.3112 mark, through which the upper limit of the descending channel on the daily chart passes. The breakdown of the support level 1.3055 will confirm this scenario. However, only the breakdown of the support level 1.2625 (EMA200 on the weekly chart) will signal a final break of the bullish USD / CAD trend. *)An advanced fundamental analysis is available on the Tifia Forex Broker website at tifia.com/analytics Support levels: 1.3112, 1.3100, 1.3055, 1.2970, 1.2930, 1.2900 Resistance levels: 1.3175, 1.3200, 1.3285, 1.3380, 1.3450 Trading Scenarios Sell Stop 1.3080. Stop-Loss 1.3160. Take-Profit 1.3055, 1.2970, 1.2930, 1.2900 Buy Stop 1.3160. Stop-Loss 1.3080. Take-Profit 1.3175, 1.3200, 1.3285, 1.3380, 1.3450  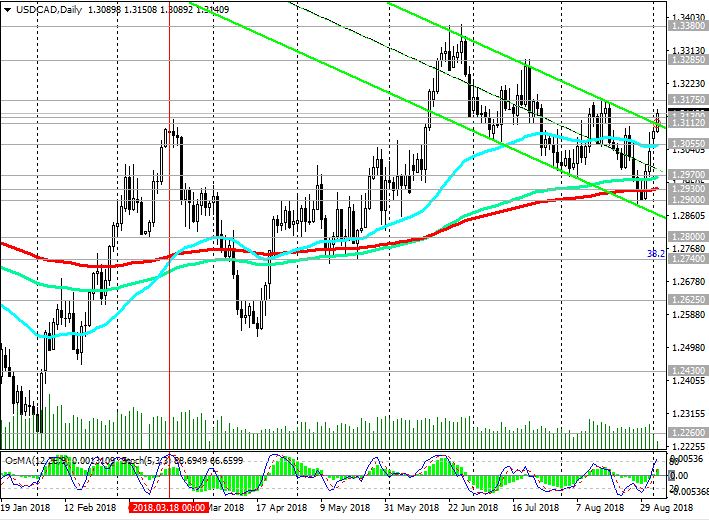 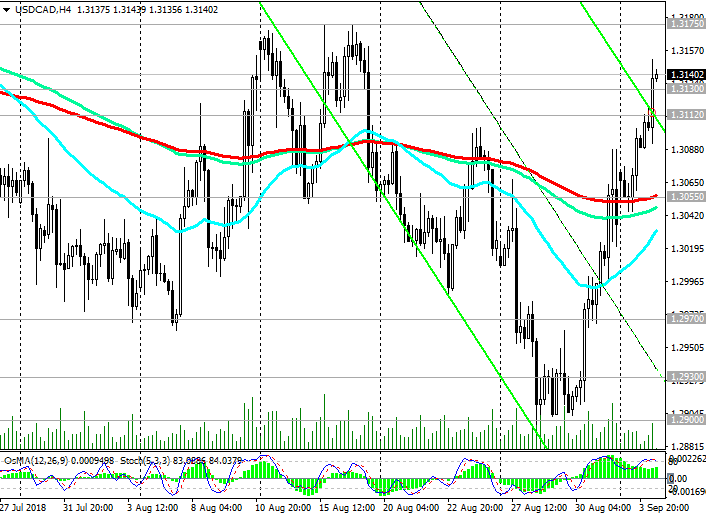 *) For up-to-date and detailed analytics and news on the forex market visit Tifia Forex Broker website tifia.com
|
|
#301
11-09-2018, 12:07
|
||||
|
||||
|
GBP/USD: on the eve of the meeting of the Bank of England
11/09/2018 Current dynamics The US dollar declined on Monday. The driver of its decline was the message that the UK and the EU have made progress on Brexit negotiations. The EU's chief negotiator for Brexit, Michel Barnier, said that an agreement with the UK could be reached in the next six to eight weeks. In response to this message, the pound rose sharply, including against the dollar, carrying with it other currencies, primarily European ones. On Tuesday, with the opening of the trading day, the decline in the dollar continued. However, closer to the beginning of the US trading session, the decline in the dollar slowed, and the dollar index DXY, which tracks the rate of the US currency against the basket of 6 other major currencies, shifted to positive territory near 95.20, 6 points higher than the opening level of the trading day. This week, investors will follow the meeting of the Bank of England, which will be held on Thursday September 13, and at 11:00 (GMT) will publish the decision on the interest rate. It is expected that the rate will remain at the same level of 0.75%. Economists believe that the next rate increase will occur no earlier than May next year. The main risks for the UK after Brexit are associated with expectations of a slowdown in the country's economic growth, as well as a large current account deficit in the UK's balance of payments. Meanwhile, the Fed is likely to continue tightening monetary policy. As Federal Reserve President Boston Rosengren said in an interview with the WSJ on Monday, "The US economy has good performance, and there is no need to slow or accelerate the current rate of quarterly rate increases". Rosengren sees no reason to pause the rate hike until economic growth and inflation slows. And this means, in his opinion, the Fed will raise the rate this year 2 more times. This is a bullish factor for the dollar. *)An advanced fundamental analysis is available on the Tifia Forex Broker website at tifia.com/analytics Support and resistance levels Since the beginning of the week, the GBP / USD pair has grown amid reports of the possibility of a favorable outcome of the Brexit talks. At the beginning of the European session on Tuesday, GBP / USD was trading near the 1.3085 mark. However, in the future, GBP / USD moved to negative territory, trading closer to the opening of the US trading session near the mark of 1.3015. Starting in May, GBP / USD is traded in a downward channel on the daily chart, the lower limit of which is near 1.2300. Corrective growth may continue to resistance levels 1.3215 (Fibonacci retracement level of 23.6% of the correction to the GBP / USD decline in the wave, which began in July 2014 near the level of 1.7200), 1.3300 (EMA200 on the daily chart). Nevertheless, short positions are preferable, a long bearish trend persists, and the GBP / USD pair may fall towards the August and annual lows near the support level of 1.2670, and 1.2365 mark, through which the lower border of the descending channel on the weekly chart is passing. Support levels: 1.3000, 1.2910, 1.2800, 1.2670, 1.2590, 1.2365 Resistance levels: 1.3085, 1.3100, 1.3215, 1.3300 Trading Scenarios Sell Stop 1.2990. Stop-Loss 1.3050. Take-Profit 1.2910, 1.2800, 1.2670, 1.2590, 1.2365 Buy Stop 1.3050. Stop-Loss 1.2990. Take-Profit 1.3100, 1.3215, 1.3300 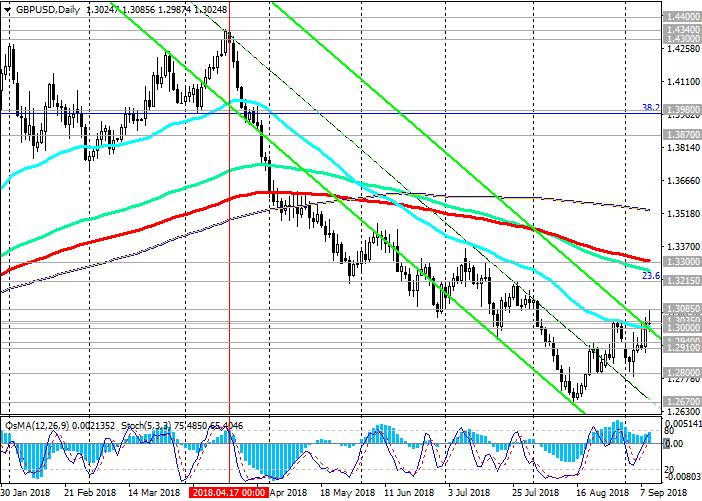 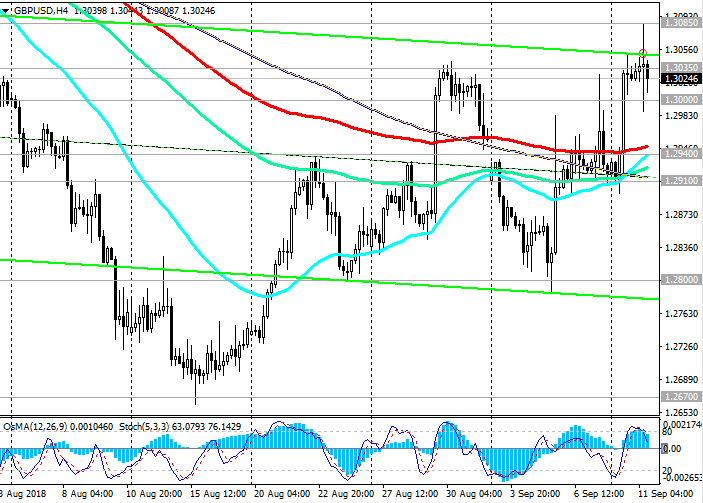 *) For up-to-date and detailed analytics and news on the forex market visit Tifia Forex Broker website tifia.com
|
|
#302
12-09-2018, 11:36
|
||||
|
||||
|
WTI: oil and oil products stocks rose
12/09/2018 Current dynamics As the American Petroleum Institute (API) reported late Tuesday, oil and oil products stocks fell 8.636 million barrels last week. On the eve of oil prices have been growing on reports of riots in Libya and in connection with the hurricane Florence approaching to the US. After the publication of the API data, the growth of oil quotes increased. As a result, a barrel of oil WTI worth at the end of the trading day on Tuesday 69.66 dollars. Since the opening of the trading day on Wednesday, oil prices have remained almost unchanged, and investors are waiting for the publication (at 14:30 GMT) of weekly official data on US stocks from the Energy Ministry of this country. It is expected to reduce inventories by 0.805 million barrels, which should positively affect oil prices. *)An advanced fundamental analysis is available on the Tifia Forex Broker website at tifia.com/analytics Support and resistance levels The price of WTI crude oil remains in an upward trend. While the price is above the key support levels of 66.35 (Fibonacci level of 23.6% of the correction to the wave of growth, which began in June 2017 with the support level near the 42.00 mark), 64.80 (EMA200 and the bottom line of the upward channel on the daily chart), long-term upward dynamics persist . The nearest growth target is 71.00 (highs of August), through which the upper line of the ascending channel on the daily chart passes. Support levels: 68.10, 67.00, 66.35, 64.80, 64.15 Resistance levels: 70.00, 71.00, 72.80, 73.85 Trading Scenarios Sell Stop 68.90. Stop-Loss 70.10. Take-Profit 68.10, 67.00, 66.35, 64.80, 64.15 Buy Stop 70.10. Stop-Loss 68.90. Take-Profit 71.00, 72.80, 73.85 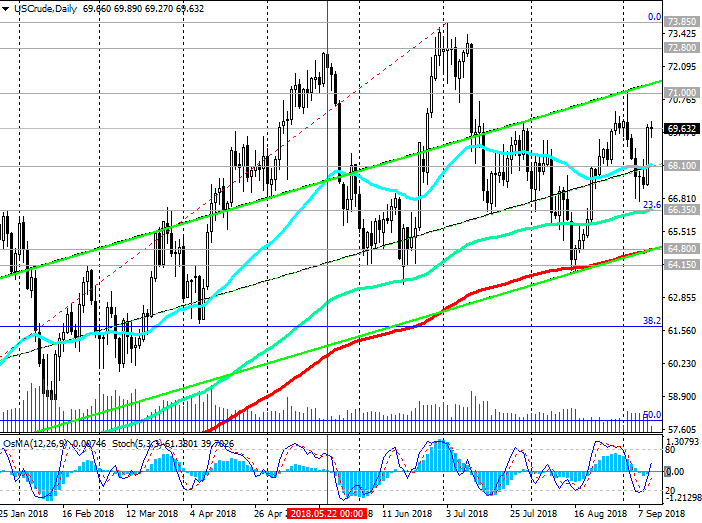 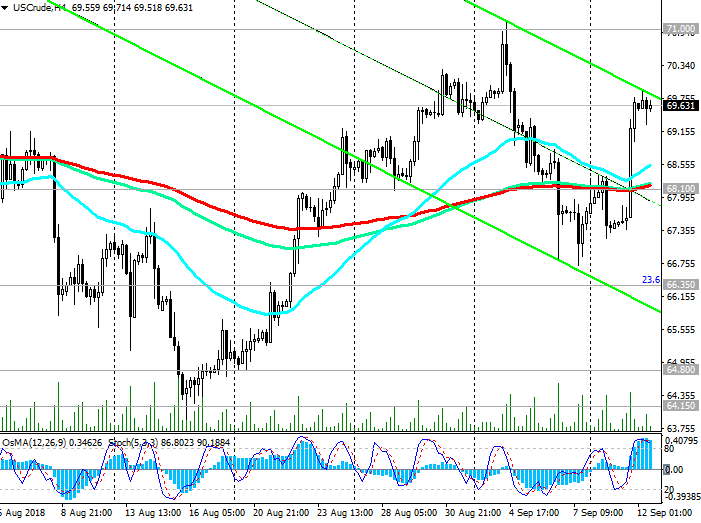 *) For up-to-date and detailed analytics and news on the forex market visit Tifia Forex Broker website tifia.com
|
|
#303
14-09-2018, 11:18
|
||||
|
||||
|
EUR/USD: Technical Analysis
14/09/2018 Since April 2018, EUR / USD remains within the descending channel on a weekly chart, the lower limit of which is close to the support level of 1.1150. However, at the moment the upward correction continues. On Thursday, the European Central Bank retained the key interest rate at 0%, and on deposits - at the level of -0.40%. The ECB confirmed its intention to keep interest rates unchanged until the summer of 2019 and lowered its forecasts for GDP growth for 2018 and 2019, from 2.1% to 2.0% and from 1.9% to 1.8%, respectively. Nevertheless, EUR / USD rose against the background of publication (at 12: 30 GMT) of weak inflationary indicators of the USA. The dollar index DXY also trades lower, at 94.45 against 94.56 at the opening of the trading day, and EUR / USD at the beginning of the European trading session is trading slightly above the 1.1700 mark. In case of breakdown of the local resistance level 1.1730 (August highs and EMA200 on the weekly chart), EUR / USD is likely to grow to resistance levels 1.1770 (EMA200 on the daily chart), 1.1790 (Fibonacci level 38.2% of the correction to the fall from the level of 1.3900, which began in May 2014). However, above the resistance level 1.1790, growth is unlikely. The key interest rate of the Fed is in the range of 1.75% -2% and it will be much higher than the ECB rate by the time the ECB starts its policy tightening cycle. The difference between interest rates in the US is an important fundamental factor in favor of dollar purchases against the euro. The breakdown of the important support levels 1.1625 (EMA50 on the daily chart), 1.1605 (EMA200 on the 4-hour chart) will open the way for further decline with a long target at the support level of 1.1150 (the lower boundary of the descending channel on the weekly chart). *)An advanced fundamental analysis is available on the Tifia Forex Broker website at tifia.com/analytics Support levels: 1.1660, 1.1625, 1.1605, 1.1535, 1.1510, 1.1400, 1.1345, 1.1285, 1.1150 Resistance levels: 1.1730, 1.1770, 1.1790 Trading Scenarios Sell Stop 1.1650. Stop-Loss 1.1740. Take-Profit 1.1625, 1.1605, 1.1535, 1.1510, 1.1400, 1.1345, 1.1285, 1.1150 Buy Stop 1.1740. Stop-Loss 1.1650. Take-Profit 1.1770, 1.1790 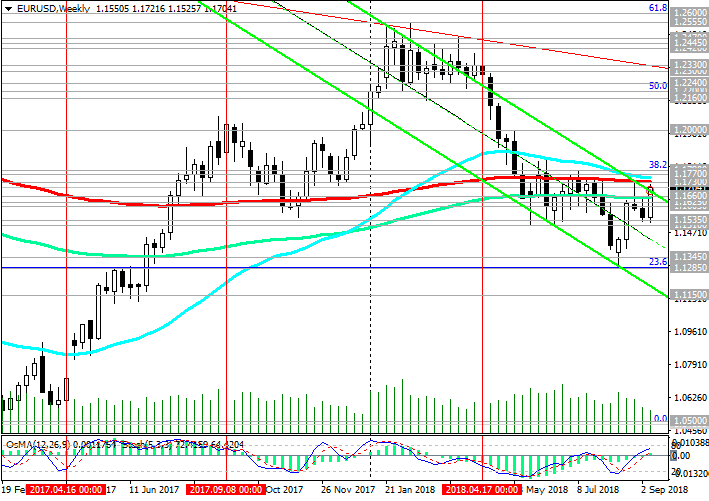 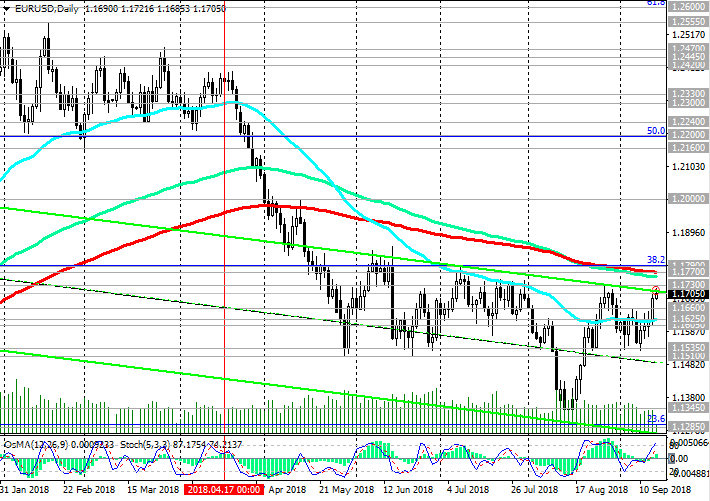 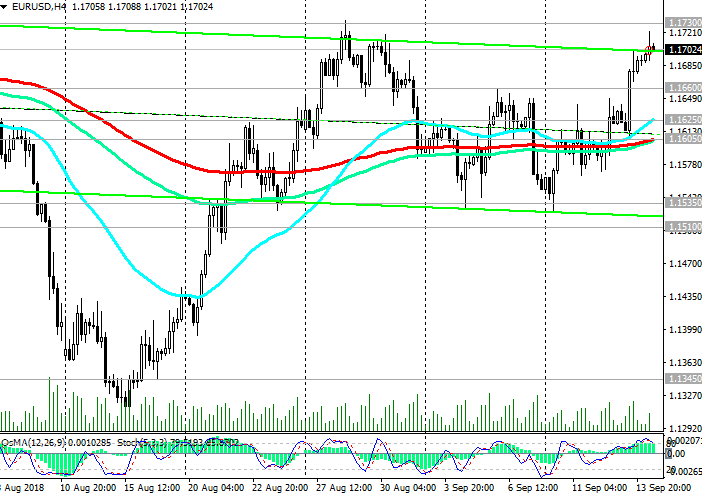 *) For up-to-date and detailed analytics and news on the forex market visit Tifia Forex Broker website tifia.com
|
|
#304
18-09-2018, 11:50
|
||||
|
||||
|
GBP/USD: Brexit will remain the focus of attention
18/09/2018 US President Donald Trump on Monday said that the United States for many years had suffered huge losses in foreign trade, and can not continue like this. As it became known, the administration of the US President Donald Trump intends to introduce new duties on goods from China worth a total of $ 200 billion. The new tariffs will come into force on September 24 and will be 10%, and by the end of the year they will be raised to 25%. The Chinese authorities reported that they will introduce reciprocal duties on American imports. European currencies reacted quite restrainedly to this news, as it did not become unexpected. Last week, the Bank of England kept the interest rate at 0.75%. In the Bank of England's reports, it was noted that Brexit remains the key risk to the British economy. News on Brexit will continue to be in the center of attention of market participants and most strongly influence the dynamics of the pound. *)An advanced fundamental analysis is available on the Tifia Forex Broker website at tifia.com/analytics Support and resistance levels The GBP / USD pair is declining at the beginning of the European trading session, but continues to trade above 1.3100, near the upper line of the rising channel on the daily chart. Since mid-August, GBP / USD has been developing an upward trend, which can be described as a correction after months of decline. The growth may continue to the levels of resistance 1.3215 (Fibonacci level 23.6% of the correction to the fall of the GBP / USD in the wave, which began in July 2014 near the level of 1.7200), 1.3300 (EMA200 on the daily chart). Nevertheless, the long-term bearish trend persists, and the GBP / USD pair may decline towards the August and annual lows near the support level of 1.2670 and the lower boundary of the downward channel on the weekly chart passing through the 1.2365 mark. The breakdown of the local support level 1.3055 will be a signal to resume the decline. Support levels: 1.3085, 1.3055, 1.3000, 1.2985, 1.2800, 1.2670, 1.2590, 1.2365, 1.2110, 1.2000 Resistance levels: 1.3200, 1.3215, 1.3300 Trading Scenarios Sell Stop 1.3050. Stop-Loss 1.3175. Take-Profit 1.3000, 1.2974, 1.2800, 1.2670, 1.2590, 1.2365, 1.2110, 1.2000 Buy Stop 1.3175. Stop-Loss 1.3050. Take-Profit 1.3200, 1.3215, 1.3300 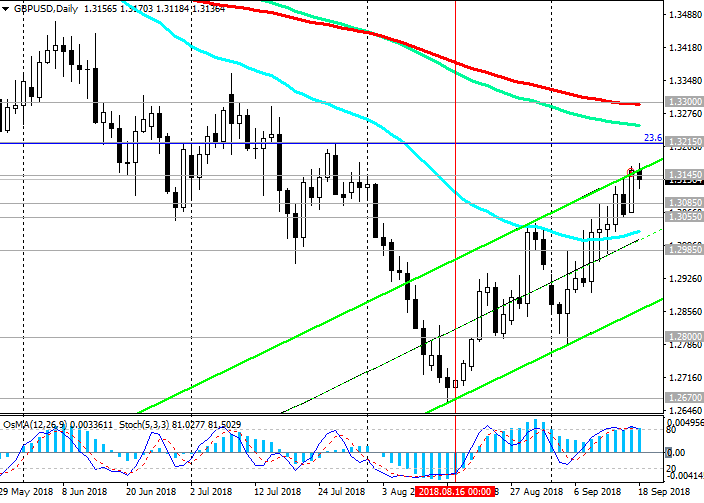 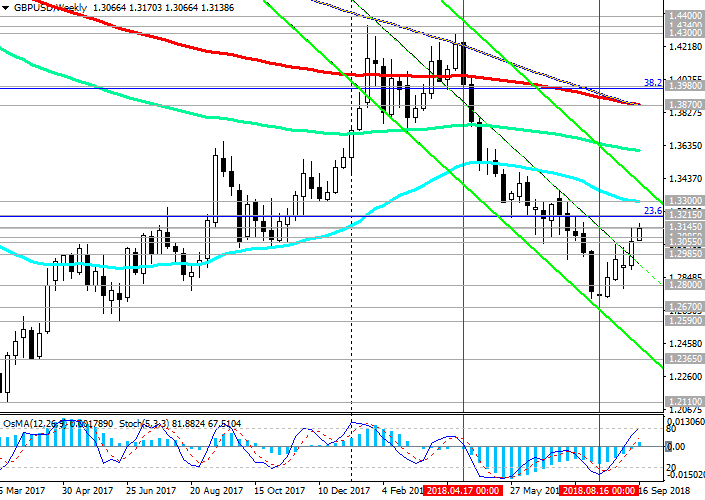 *) For up-to-date and detailed analytics and news on the forex market visit Tifia Forex Broker website tifia.com
|
|
#305
21-09-2018, 12:15
|
||||
|
||||
|
XAU/USD: the price of gold rose against the background of a weakening dollar
21/09/2018 Current dynamics Prices for gold increased by $ 3 to $ 1277.00 per troy ounce on Thursday. The sale of the dollar and its weakening contributed to higher prices for commodities and precious metals. On Friday, during the Asian and early European sessions, the dollar's decline continued, however, closer to the beginning of the US trading session, the dollar moved to a positive territory. The dollar index DXY, which tracks the rate of the US currency against the basket of 6 other major currencies, after rising sharply on Thursday to the June 2018 mark, is growing on Friday at the beginning of the US trading session near the 93.61 mark. The pair XAU / USD also declines after rising yesterday. At the same time, XAU / USD continues to trade in the range between resistance levels 1212.00 (EMA50 on the daily chart) and 1185.00 (Fibonacci level 23.6% of the correction to the wave of decline since July 2016), pending the meeting of the Federal Reserve System, which will take place at the next week (September 25 - 26) to assess the prospects for the monetary policy of the Fed. With an increase in the Fed's interest rate, the price of gold usually falls. The overall trend of XAU / USD, still remains bearish. Another test of the resistance level 1212.00 (EMA50 on the daily chart) is possible. However, further growth is unlikely, unless, of course, the dollar will not resume a decline. Investors take into account the 100% probability of an increase in the Fed's interest rate in September. In conditions of an increase in the interest rate, the investment attractiveness of the dollar is growing, and gold is falling. *)An advanced fundamental analysis is available on the Tifia Forex Broker website at tifia.com/analytics Support and resistance levels Since mid-April, XAU / USD is trading in a downward channel on the daily chart, the lower limit of which is near the support level of 1128.00 (the low of 2016). Below the key resistance level of 1259.00 (EMA200 on the daily chart), the downside dynamics prevails. The breakdown of the support level of 1185.00 (the Fibonacci level 23.6% of the correction to the wave of decline since July 2016) will confirm the return of XAU / USD to the global downtrend that began in October 2012. The signal for medium-term purchases and the development of an alternative scenario will be a breakdown of the resistance level at 1212.00. In this case, the corrective growth can last up to resistance level 1220.00 (Fibonacci level 38.2%). Short positions are preferred below this level. Support levels: 1200.00, 1198.00, 1185.00, 1175.00, 1160.00, 1128.00 Levels of resistance: 1212.00, 1220.00, 1237.00, 1248.00, 1259.00, 1266.00, 1277.00 Trading Scenarios Sell Stop 1206.00. Stop-Loss 1213.00. Take-Profit 1200.00, 1198.00, 1185.00, 1175.00, 1160.00, 1128.00 Buy Stop 1213.00. Stop-loss 1206.00. Take-Profit 1220.00, 1225.00, 1237.00, 1248.00, 1259.00, 1266.00 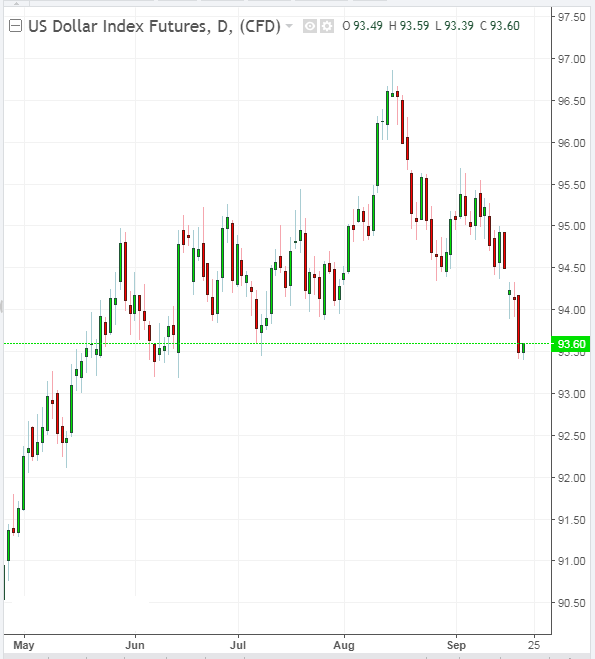 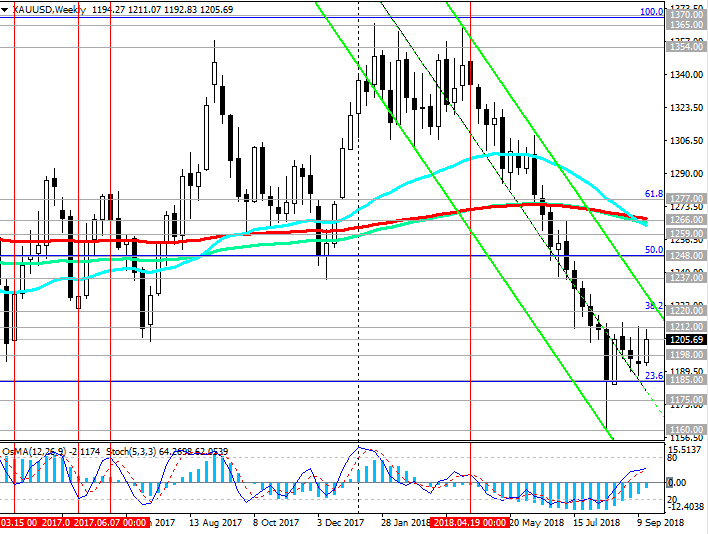 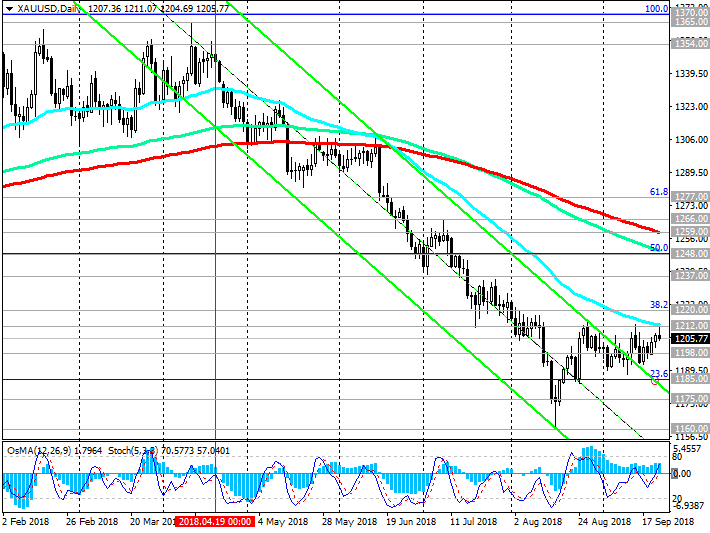 *) For up-to-date and detailed analytics and news on the forex market visit Tifia Forex Broker website tifia.com
|
|
#306
25-09-2018, 11:47
|
||||
|
||||
|
NZD/USD: market expectations in connection with the meetings of the Fed and the RBNZ
25/09/2018 Current dynamics On Wednesday, the two largest world central banks will hold meetings and decide on the interest rate. The Federal Reserve's decision on the interest rate will be published at 18:00 (GMT). It is widely expected that the rate will be increased by 0.25% to 2.25%, and this increase is already included in the price. Investors are more interested in the press conference and the opinion of Federal Reserve Chairman Powell on the prospects for monetary policy for 2019. If Powell signals about the possibility of a faster increase in the interest rate, this will cause the dollar to strengthen and the US stock markets fall. Any hint of Powell that the Fed can pause, will bring down the dollar. On the part of the RB of New Zealand, investors do not expect a change in the current monetary policy, despite strong macro data published last week. As the Bureau of Statistics of New Zealand reported, the country's GDP grew by 1.0% in the second quarter or by 2.8% in annual terms (the forecast was + 0.8% and + 2.5%, respectively). The pace of economic growth exceeded the expectations of the central bank by two times. Moreover, the comments of the bank may indicate the possibility of lowering interest rates if economic growth does not accelerate. Probably, the head of RBNZ Adrian Orr will once again confirm the bank's desire to pursue a soft monetary policy, which will lead to pressure on the New Zealand currency. In any case, the volatility in the New Zealand dollar trade is expected to grow during the RBNZ press conference, which will begin on Wednesday at 22:00 (GMT). The different focus of monetary policy in the US and New Zealand will further increase the difference between interest rates in the US and New Zealand. And this is the main fundamental factor for further reduction of NZD / USD. The main global trend of the pair NZD / USD, is still bearish. *)An advanced fundamental analysis is available on the Tifia Forex Broker website at tifia.com/analytics Trading scenarios On Thursday, the NZD / USD attempted a breakdown of a strong resistance level of 0.6668 (EMA50 on the daily chart). Nevertheless, the breakdown of this level turned out to be false, and NZD / USD again declines, heading down the descending channel on the daily chart. Its lower limit passes below the local support level of 0.6505 (the lows of the year and September). A confirmation of the resumption of the main scenario is the breakdown of the short-term support levels 0.6638 (EMA200 on the 4-hour chart), 0.6627 (EMA200 on the 1-hour chart). A signal for the development of an upward correction may be a breakdown of the local resistance level of 0.6700. The correction target can be resistance levels of 0.6725, 0.6740. Long-term growth targets are resistance levels of 0.6865 (Fibonacci level 23.6% of the upward correction to the global wave of the pair's decline from the level of 0.8800, which began in July 2014; the minimums of the wave are near 0.6260), 0.6900 (EMA200 on the daily chart). Nevertheless, short positions are preferable. Support levels: 0.6638, 0.6627, 0.6600, 0.6585, 0.6505, 0.6410 Resistance levels: 0.6700, 0.6725, 0.6740, 0.6800, 0.6865, 0.6900 Trading Scenarios Sell Stop 0.6625. Stop-Loss 0.6670. Take-Profit 0.6600, 0.6585, 0.6505, 0.6410 Buy Stop 0.6670. Stop-Loss 0.6625. Take-Profit 0.6700, 0.6725, 0.6740, 0.6800, 0.6865, 0.6900 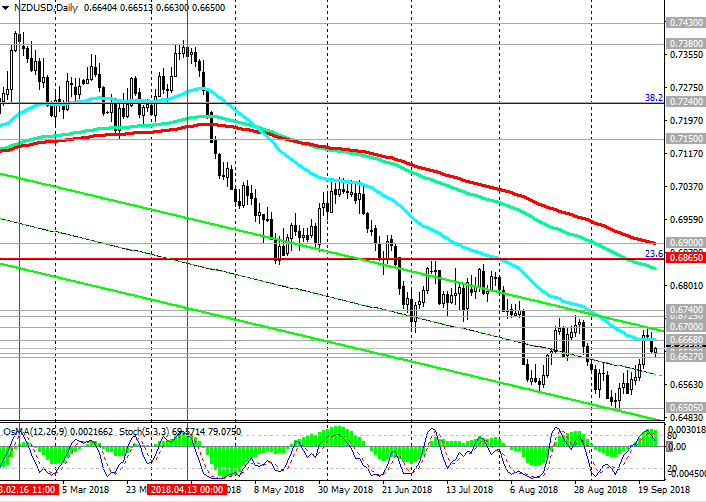 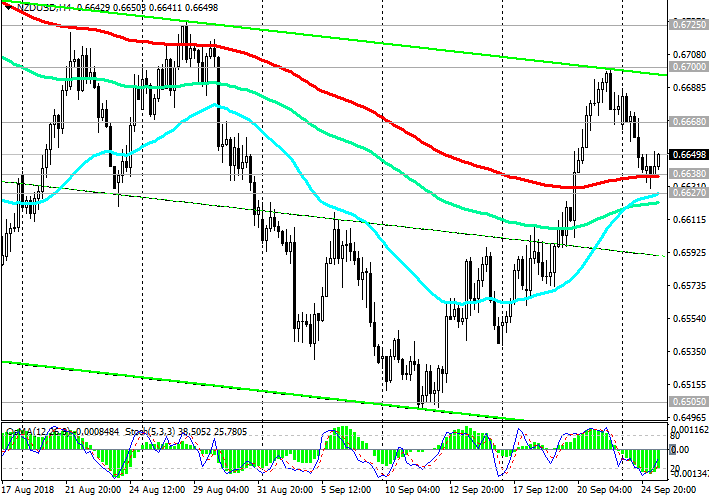 *) For up-to-date and detailed analytics and news on the forex market visit Tifia Forex Broker website tifia.com
|
|
#307
26-09-2018, 12:55
|
||||
|
||||
|
USD/JPY: the divergence of the monetary policy of the Fed and the Bank of Japan will intensify
26/09/2018 Current situation "We do not plan to curtail mitigation until inflation reaches 2%", Bank of Japan head Haruhiko Kuroda said at a press conference on Tuesday, adding that "the possible side effects of mitigation will not prevent further softening of the policy if necessary". The yen continues to weaken after Kuroda's speech, and the USD / JPY came close to 113.00 before publication (at 18:00 GMT) of the Fed decision on the rate. It is expected that the rate will be increased by 0.25% to 2.25%, and this increase is already included in the price. Investors are waiting for a press conference and Powell's speech to understand the prospects for monetary policy for 2019. Any hints Powell on the possibility of a more rapid increase in the interest rate will cause the strengthening of the dollar. Soft Powell rhetoric will bring down the dollar. Nevertheless, the difference between the monetary policy of the Bank of Japan and the Fed remains the main fundamental factor for the further growth of the pair USD / JPY. Probably, the USD / JPY will keep positive dynamics and will continue to grow, despite the speech of Powell. *)An advanced fundamental analysis is available on the Tifia Forex Broker website at tifia.com/analytics Trading scenarios Since the end of March, the USD / JPY has been growing, currently trading above the key support levels of 110.15 (Fibonacci level 38.2% of the correction of the pair's growth since August last year and the level of 99.90), 110.50 (EMA200 on the daily chart). Ascending dynamics prevails. Long positions are preferred. The nearest growth targets are 113.10 levels (Fibonacci level 50% and maximums of the year), 113.70 (December highs). Long-term growth targets are the level of resistance 116.00 (Fibonacci level 61.8%), 118.60 (highs in January 2017). The signal for the decline will be the breakdown of short-term support levels of 112.83 (EMA200 on the 15-minute chart), 112.43 (EMA200 on the 1-hour chart). The purpose of the downward correction is the support level of 111.68 (EMA200 on the 4-hour chart). Support levels: 112.83, 112.43, 111.68, 111.00, 110.50, 110.15 Levels of resistance: 113.10, 113.70, 114.00, 114.40, 115.00, 116.00 Trading Scenarios Buy Stop. Stop Loss 112.70. Take-Profit 113.70, 114.00, 114.40, 115.00, 116.00 Sell Stop 112.70. Stop Loss 113.20. Take-Profit 112.43, 112.00, 111.68, 111.40, 111.00, 110.50, 110.15  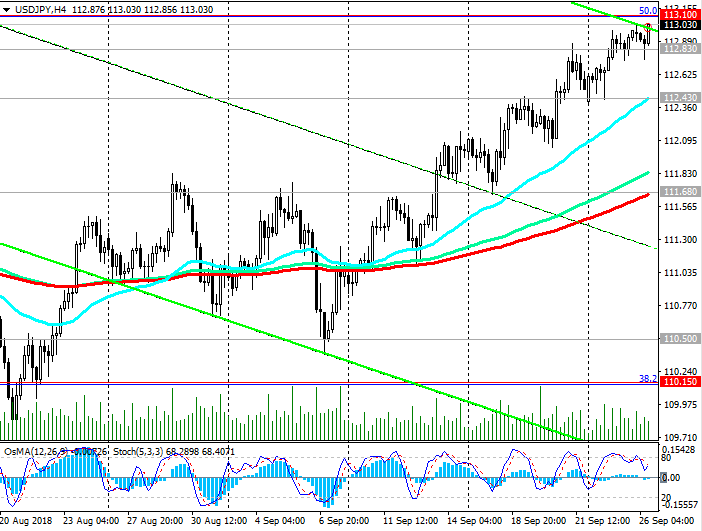 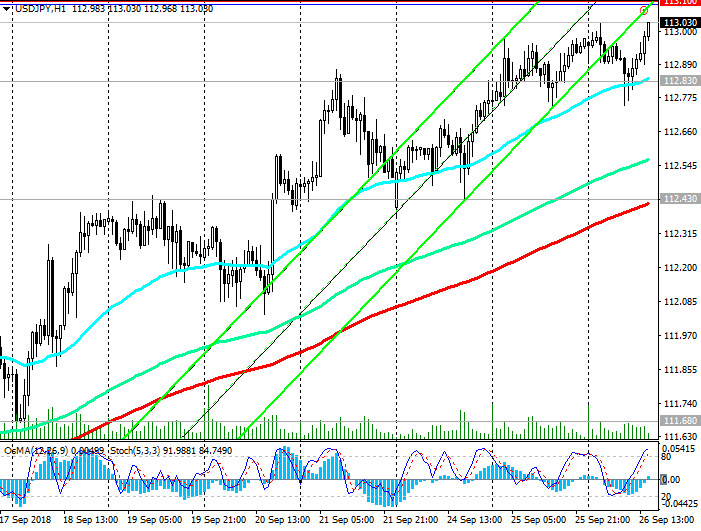 *) For up-to-date and detailed analytics and news on the forex market visit Tifia Forex Broker website tifia.com
|
|
#308
01-10-2018, 12:07
|
||||
|
||||
|
USD/CHF: Current dynamics_01/10/2018
Despite the decline against the Canadian dollar, the US dollar maintains a positive momentum in the foreign exchange market. Futures on the dollar index DXY, which tracks the rate of the US currency against the basket of 6 other major currencies, is trading with a slight increase at the beginning of the European session, near the 94.77 mark. This week, the attention of traders will be focused on the publication on Friday of data from the American labor market. According to the forecast, strong data is expected. The average hourly wage of Americans increased by 0.3% in September, the number of new jobs created outside the agricultural sector increased by 188 00 (against +201 000 in August), the unemployment rate in September was 3.8% (against 3.9% in August). Forecasting the market reaction to the publication of indicators is often difficult. In any case, when these indicators are published, a surge in volatility is expected in the trades not only in USD, but throughout the financial market. Probably the most cautious investors will prefer to stay out of the market in this time period. Nevertheless, if the data coincides with the forecast or will go better, then this will have a positive effect on the USD. Last Wednesday, the Fed raised its benchmark interest rate by 0.25% to 2.25%, and Federal Reserve Chairman Powell confirmed the Fed's plans for another interest rate hike in 2018 and 3 rate increases in 2019. The Fed, therefore, remains the world's single largest central bank, which is tightening monetary policy. And this, in the long run, should return to the dollar an upward trend. At the meeting held in September, the Swiss National Bank kept its negative interest rates unchanged: the deposit rate was at -0.75%, the range for the 3-month LIBOR rate was between -1.25% and -0.25%. "The bank still considers it necessary to have a negative interest rate and is ready to intervene in the foreign exchange market, if the situation requires it",- the NBS said. Frank still enjoys the status of a refugee currency, especially recently, amid a worsening trade conflict between the US and China. Nevertheless, the increasing discrepancy in interest rates in the US and Switzerland will increase the investment attractiveness of the dollar against the franc, which will further increase USD / CHF. *)An advanced fundamental analysis is available on the Tifia Forex Broker website at tifia.com/analytics Support and resistance levels The pair USD / CHF broke through last week an important resistance level of 0.9785 (EMA200 on the daily chart) and continues to grow on Monday. The upper limit of the downtrend channel, in which the USD / CHF was declining since the middle of August USD / CHF, is also broken. Thus, there was a strong signal, indicating a further increase in USD / CHF. The OsMA and Stochastic indicators on the 4-hour, daily, weekly charts turned to long positions, confirming the rising dynamics of USD / CHF. Break into the zone above the resistance level 0.9875 (the Fibonacci level of 61.8% of the upward correction to the last global wave of decline since December 2016 and from the level of 1.0300) will create prerequisites for further growth. The targets in this case will be the resistance levels 1.0100, 1.0300. The signal for sales will be a return to the zone below the support level 0.9770 (EMA50 on the daily chart). The goals of the decline are 0.9575, 0.9520, 0.9445 (the Fibonacci level is 23.6%). Support levels: 0.9785, 0.9770, 0.9745, 0.9640, 0.9610, 0.9575, 0.9520, 0.9445 Resistance levels: 0.9875, 0.9965, 1.0030, 1.0060 Trading Scenarios Buy Stop 0.9850. Stop-Loss 0.9790. Take-Profit 0.9875, 0.9965, 1.0030, 1.0060 Sell Stop 0.9790. Stop-Loss 0.9850. Take-Profit 0.9770, 0.9745, 0.9640, 0.9610, 0.9575, 0.9520, 0.9445 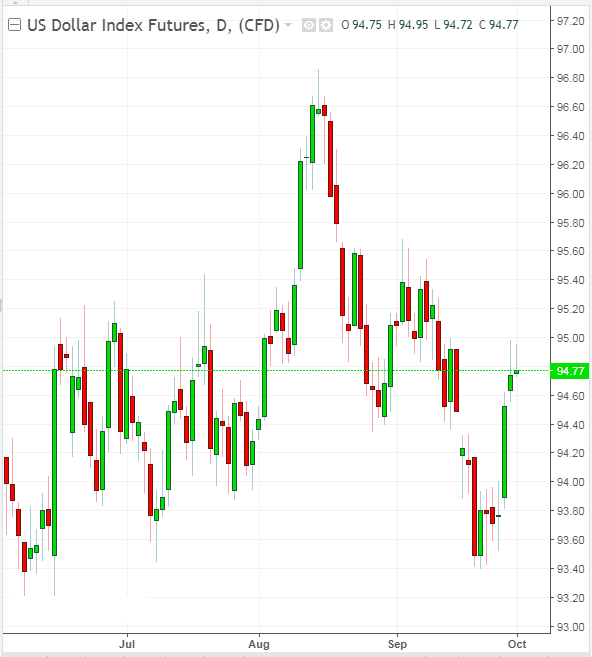 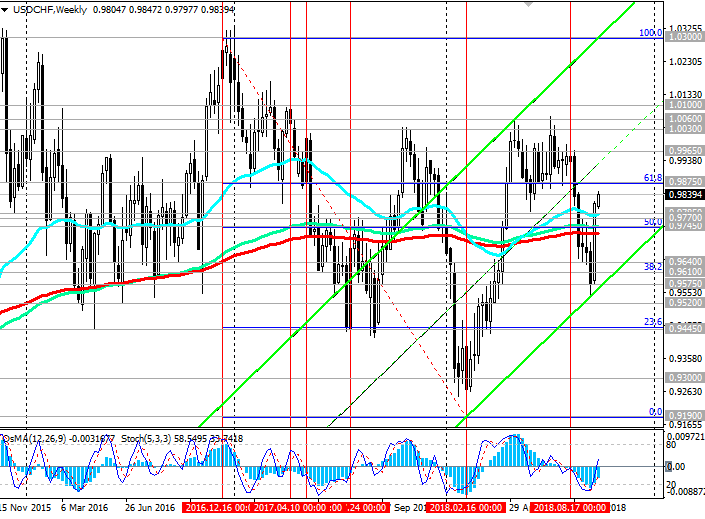 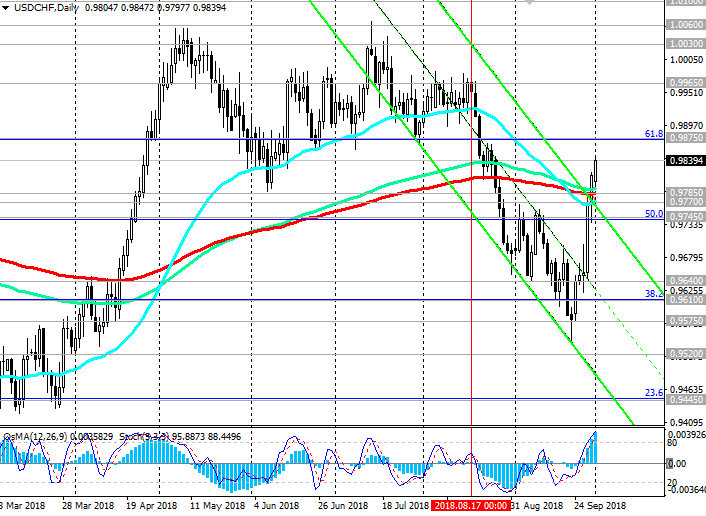 *) For up-to-date and detailed analytics and news on the forex market visit Tifia Forex Broker website tifia.com
|
|
#309
02-10-2018, 12:32
|
||||
|
||||
|
EUR/USD: Euro remains under pressure. Trading recommendations
02/10/2018 Current situation The euro remains under pressure due to problems in Italy. Last week, the Italian government presented a plan for the state budget, which investors fear may cause disapproval of the EU authorities. This time, the euro is falling after the comments of the head of the budget committee of the lower house of parliament, Claudio Borghi, that Italy could solve most of the internal (economic) problems with the help of its national currency. The yield of government bonds in Italy jumped to the highest level in 4.5 years. By the beginning of the US trading session, the EUR / USD pair was trading near the 1.1525 mark, which is 55 points lower than the opening price of the trading day. Meanwhile, the US dollar continues to rise from the opening of today's trading day. The DXY dollar index, which tracks the US currency against a basket of 6 other major currencies, has been rising 4 days in a row after the Fed raised its main interest rate by 0.25% to 2.25% last week, and Fed Chairman Powell confirmed plans for another interest rate increase in 2018 and 3 interest rate increases in 2019. At the beginning of the European trading session, DXY futures traded with an increase of 28 points, near the mark of 95.24. On Tuesday, investors will pay attention to Powell's speech, which will begin at 16:45 (GMT). Most likely, the reaction to his speech will be minimal. But, if he makes unexpected statements about the monetary policy of the Fed, then volatility in trading in financial markets may increase. Any hint of Powell's for a cautious approach to raising the interest rate will cause the dollar to fall and the growth of US stock markets. *)An advanced fundamental analysis is available on the Tifia Forex Broker website at tifia.com/analytics Trading scenarios During the 5-day decline, the EUR / USD pair reached a local support level of 1.1510 (May, June lows). The trend line at the support level of 1.1645 (ЕМА200 on the 4-hour chart, ЕМА50 on the daily chart) is broken. Indicators OsMA and Stochastic on the 4-hour and daily, weekly charts went to the side of the sellers. Negative dynamics persist. In this situation, short positions are preferred. The farther target of the decline is at the support level of 1.1100 (lower limit of the downward channel on the weekly chart). Consideration of long positions is possible only after returning EUR / USD to the zone above the resistance level of 1.1645. Support Levels: 1.1535, 1.1510, 1.1400, 1.1345, 1.1285, 1.1100 Resistance Levels: 1.1645, 1.1700, 1.1725, 1.1760, 1.1790, 1.1815 Trading recommendations Sell in the market. Stop Loss 1.1610. Take-Profit 1.1510, 1.1400, 1.1345, 1.1285, 1.1100 Buy Stop 1.1610. Stop-Loss 1.1490. Take-Profit 1.1645, 1.1700, 1.1725, 1.1760, 1.1790, 1.1815 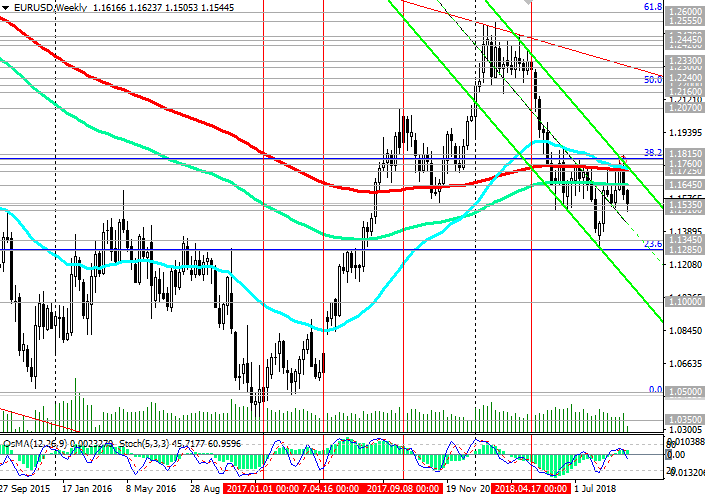 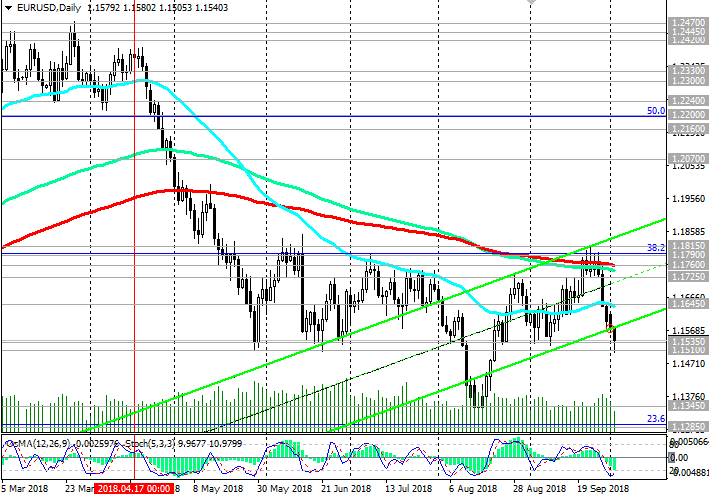 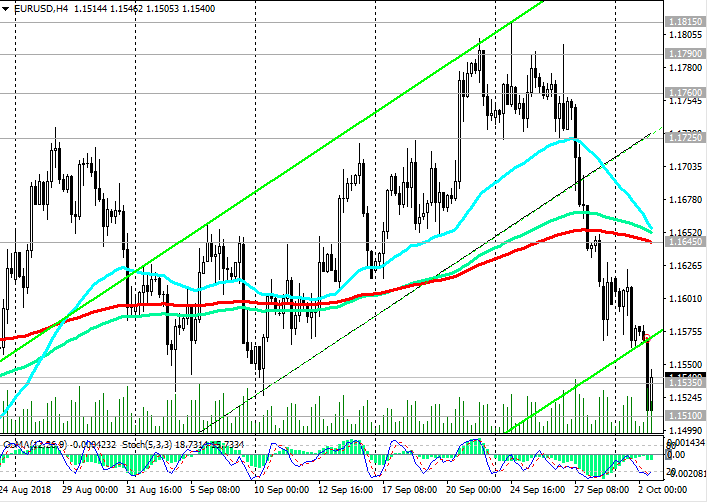 *) For up-to-date and detailed analytics and news on the forex market visit Tifia Forex Broker website tifia.com
|
|
#310
08-10-2018, 11:58
|
||||
|
||||
|
GBP/USD: pressure on the pound has resumed
08/10/2018 Current Dynamics The pound strengthened significantly at the end of last week, and the GBP / USD jumped 170 points in two days to 1.3112. The growth of the pound contributed mainly by two news regarding Brexit. EU's main Brexit negotiator, Michelle Barnier, said the EU and Britain had reached the final stage of negotiations. On Friday, Bloomberg reported that the European Union intends to offer the UK a very favorable free trade agreement. Brussels intends to propose an agreement that goes much further than any previous agreements. The EU proposal will provide for 30% -40% of what May requires from a large-scale transaction, which should cover aspects ranging from trade to security, the report says. The pound was the only currency hardened against the dollar last week. Other major dollar competitors have fallen against it. The data on the US labor market, received on Friday from the US Department of Commerce, strengthened investors' opinion that the Fed will continue to tighten monetary policy. In September, unemployment in the United States fell to 3.7%, which increases inflation expectations, especially with regard to wage growth. At a press conference in September, Fed Chairman Powell confirmed plans for another interest rate increase in 2018 and 3 rate increases in 2019. The Fed is currently the single largest global central bank tightening monetary policy, and this will be the main fundamental driver for the growth of the dollar. The DXY dollar index, which tracks the US currency against a basket of 6 other major currencies, has been rising since the opening of today's trading day. DXY futures traded at the beginning of the European session near the level of 95.65, 43 points higher than the opening price of the trading day. However, the Brexit theme remains central to the definition of further pound dynamics. In the case of a hard Brexit, the probability of which is still there, the Bank of England can go on reducing the rate to compensate for the damage. The long-term outlook for the British pound is still uncertain. In the short term, the resumption of the decline in GBP / USD is expected. *)An advanced fundamental analysis is available on the Tifia Forex Broker website at tifia.com/analytics Support and Resistance Levels On Monday, GBP / USD attempts to break through the support level of 1.3038 (ЕМА50 on the daily chart, ЕМА200 on the 4-hour chart). In case of its breakdown, the upward GBP / USD correction will end. In this case, short positions are again preferred. A long-term bearish trend persists, and the GBP / USD pair may decline to August and annual lows near the support level of 1.2670, and the lower border of the downward channel on the weekly chart, which passing through the 1.2000 mark. The alternative scenario assumes a resumption of the upward correction and growth to resistance levels of 1.3215 (Fibonacci level 23.6% of the correction to the decline of GBP / USD in a wave that began in July 2014 near the level of 1.7200), 1.3270 (ЕМА200 on the daily chart). The signal for the development of this scenario will be the breakdown of the short-term resistance level of 1.3058 (ЕМА200 on the 15-minute chart). Farther growth targets are resistance levels of 1.3870 (ЕМА200 on the weekly chart), 1.3980 (Fibonacci level 38.2%). Support levels: 1.3038, 1.3000, 1.2900, 1.2800, 1.2670, 1.2590, 1.2365, 1.2110, 1.2000 Resistance Levels: 1.3058, 1.3125, 1.3215, 1.3270, 1.3300, 1.3420, 1.3620 Trading Scenarios Sell Stop 1.2990. Stop Loss 1.3070. Take-Profit 1.2900, 1.2800, 1.2670, 1.2590, 1.2365, 1.2110, 1.2000 Buy Stop 1.3070. Stop Loss 1.2990. Take-Profit 1.3125, 1.3215, 1.3270, 1.3300, 1.3420, 1.3620 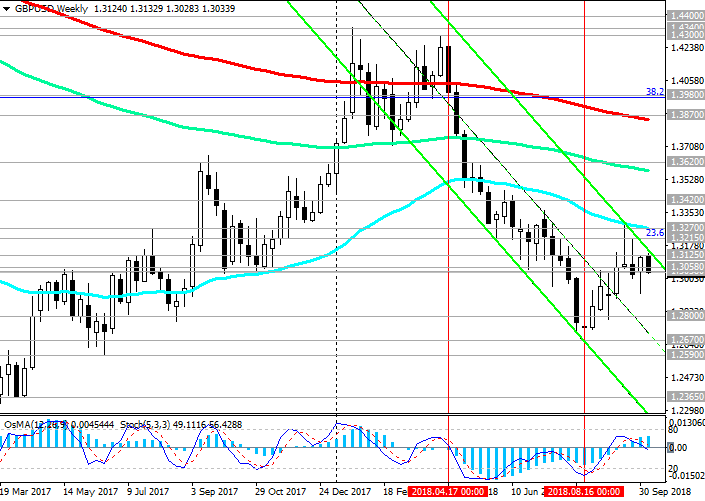 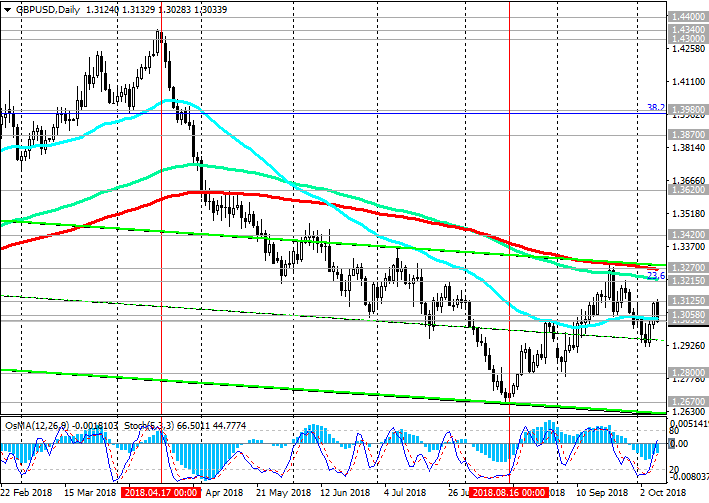 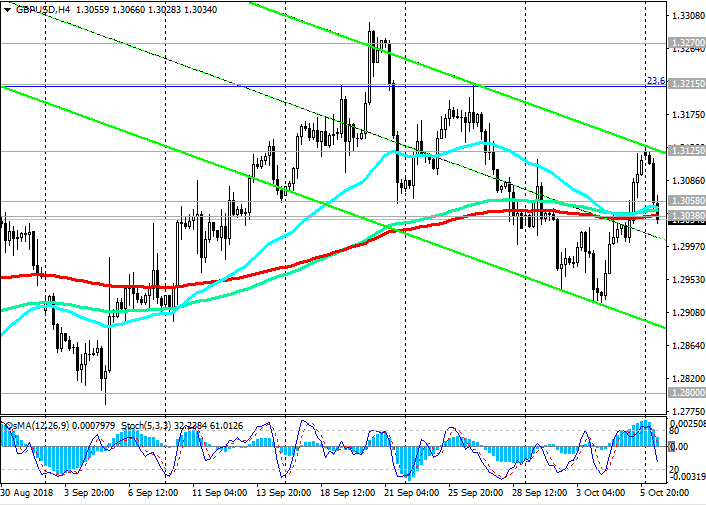 *) For up-to-date and detailed analytics and news on the forex market visit Tifia Forex Broker website tifia.com
|
|
#311
09-10-2018, 12:20
|
||||
|
||||
|
DJIA: US stock indexes are falling
09/10/2018 Current situation Leading US indices since last week are under pressure against the backdrop of rising government bond yields to multi-year marks. On Tuesday, the yield on 10-year US Treasury bonds reached 3.261%, the highest in 7.5 years. The growth of profitability is worrying investors. Many of them believe that the US stock market still has room for growth due to good economic data and high levels of business and consumer confidence. However, against the background of further increases in interest rates, there will be more and more doubts about the prospects for further growth of the market. Increasing bond yields reduce the attractiveness of riskier assets, including stocks, and may trigger a slowdown in economic growth. Investors are also analyzing the development of the trade conflict between the United States and China. If the White House will levy duties on all of Chinas imports to the United States, markets and the economy will take it negatively. Before the resolution of the trade conflict between these two largest economies in the world is still far away, investors are eager to understand how the customs duties they have introduced will affect the global economy. European and Asian indices are also declining after the US. European Stoxx Europe 600 fell by 0.4%, the shares of automotive and chemical companies dropped the hardest. The Japanese Nikkei Stock Average Index declined by 1.3%. Hong Kong's Hang Seng Index decreased 0.1%. After the Dow Jones Industrial Average rose at the beginning of the month to a new record high of 26953.0, DJIA futures fell from the opening of the trading day on Tuesday, reaching 26390.0 by the beginning of the American session. *)An advanced fundamental analysis is available on the Tifia Forex Broker website at tifia.com/analytics Support and Resistance Levels The DJIA so far maintains a long-term positive trend, trading in the ascending channels on the daily and weekly charts. Only the long positions should be considered above the support level of 26245.0 (ЕМА200 on the 4-hour chart). Breakdown of this support level may provoke a deeper correctional decrease to key support levels of 25350.0 (ЕМА144 on the daily chart), 25000.0 (ЕМА200 on the daily chart). The bottom line of the ascending channel on the weekly chart also passes near these levels. In general, positive dynamics remain, and long positions are preferable. Only a breakdown of the support level of 24200.0 (Fibonacci level 23.6% of the correction to growth from 15650.0 in the wave that began in January 2016. The maximum of this wave and the Fibonacci level 0% are close to 26620.0) can again threaten the bull trend. Support Levels: 26245.0, 26000.0, 25750.0, 25350.0, 25000.0, 24930.0, 24200.0 Resistance Levels: 26560.0, 26840.0, 27000.0, 28000.0, 29000.0 Trading Scenarios Buy Stop 26580.0. Stop Loss 26200.0. Take-Profit 26840.0, 27000.0, 28000.0, 29000.0 Sell Stop 26200.0. Stop Loss 26580.0. Take-Profit 26000.0, 25750.0, 25350.0, 25000.0 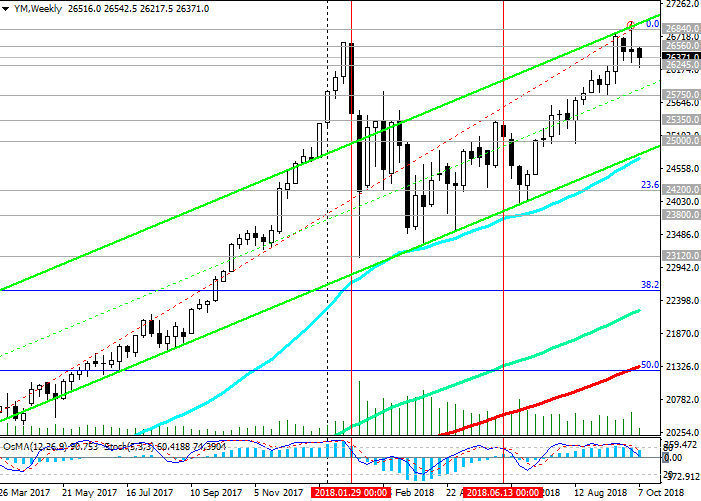 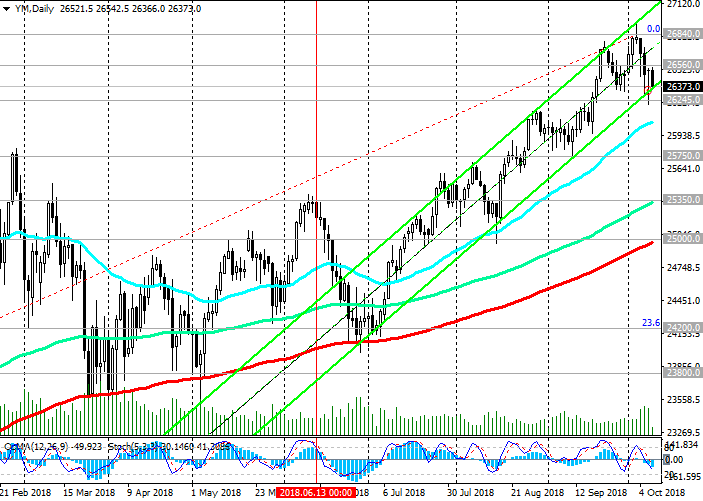 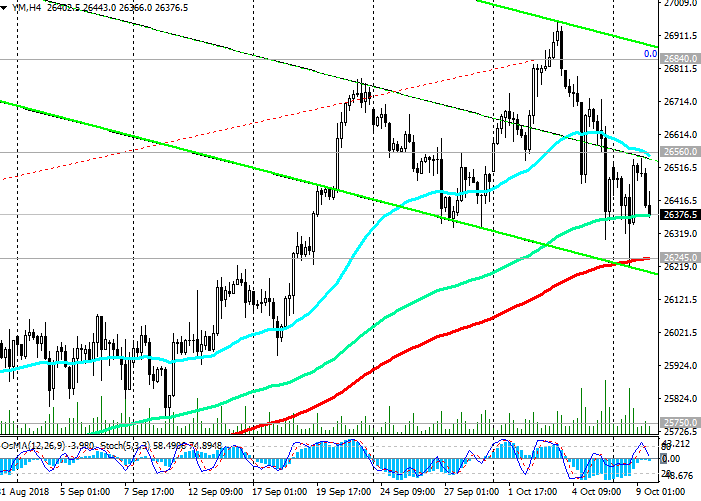 *) For up-to-date and detailed analytics and news on the forex market visit Tifia Forex Broker website tifia.com
|
|
#312
11-10-2018, 13:00
|
||||
|
||||
|
AUD/USD: Short positions are relevant.
11/10/2018 Current Dynamics The US dollar is falling after stock indexes. The DXY dollar index, which tracks the US currency against a basket of 6 other major currencies, has been dropping on Thursday for the third day in a row. DXY futures traded at the beginning of the American session near the 94.74 mark, 40 points lower than the opening price of the trading day. Nevertheless, the dollar, in general, maintains its position and upward trend against the background of good economic data and high levels of business and consumer confidence. His current decline should be considered so far as corrective. The dollar also receives support from a $ 1.5 trillion tax cut in December. Investors expect growth this year to be a sustainable fiscal stimulus. Markets expect the Fed to raise interest rates again this year, as well as three times next year. Amid further increases in interest rates, the investment attractiveness of the dollar will grow. However, on Thursday, the US dollar fell, including against the Australian dollar. "The Fed is making a mistake", Trump told reporters after the worst fall in stock markets in more than seven months. "I think the Fed has lost its head", he added. Trump made this statement amid falling American stock market. According to Trump, the fall in the stock market is "a correction that we have been waiting for a long time. Nevertheless, I really disagree with the actions of the Fed", he said. At the same time, the Australian dollar remains under pressure. According to Lucy Ellis, senior economist at the Reserve Bank of Australia, monetary policy should remain soft to reduce unused production capacity. "Removing reserve capacity may take some time. In this regard, for several years, a stimulating monetary policy may be needed," Ellis added. RBA has kept its key interest rate at a record low of 1.5% for more than two years. Some economists expect the Central Bank to keep rates at such levels until 2020. Thus, the different orientation of the monetary policies of the Fed and the RBA remains the main fundamental factor in favor of further reducing the pair AUD / USD. In the long run, the pair is likely to decline. The most pessimistic forecasts suggest a fall to the support level of 0.6300 (2009 lows). *)An advanced fundamental analysis is available on the Tifia Forex Broker website at tifia.com/analytics Support and Resistance Levels Despite the upward correction, negative dynamics persist and prevail. Breakdown of the local support level of 0.7045 will resume the decline of AUD / USD with targets at the support levels of 0.6910 (lows of September 2015), 0.6830 (2016 lows). AUD / USD is in a global downtrend that began in August 2011. Short positions are preferred. Only if AUD / USD returns to the zone above the key resistance level of 0.7450 (ЕМА200 on the daily chart) can we consider long-term long positions with targets at 0.7820 (ЕМА200 on the weekly chart and Fibonacci level 23.6% of the correction to the decline wave of the pair since August 2011 years and the level of 1.1030. The minimum of this wave is near the level of 0.6830). The signal for the development of this scenario will be the breakdown of the short-term resistance level of 0.7113 (ЕМА200 on the 1-hour chart). Support Levels: 0.7075, 0.7045, 0.7025, 0.6910, 0.6830 Resistance Levels: 0.7100, 0.7113, 0.7150, 0.7200, 0.7235, 0.7300, 0.7400, 0.7450, 0.7700, 0.7820 Trading Scenarios Sell in the market. Stop Loss 0.7140. Take-Profit 0.7045, 0.7025, 0.6910, 0.6830 Buy Stop 0.7140. Stop Loss 0.7070. Take-Profit 0.7200, 0.7235, 0.7300, 0.7400, 0.7450  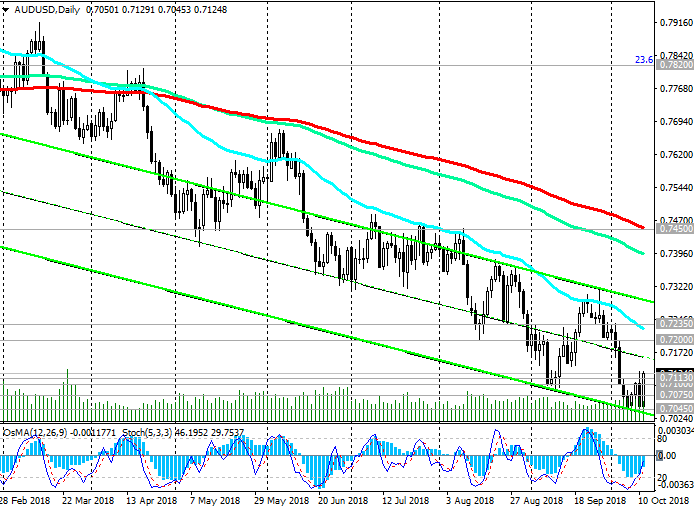 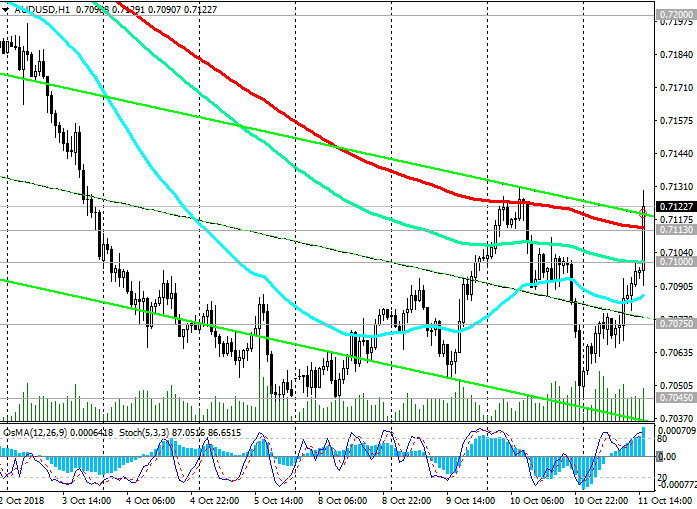 *) For up-to-date and detailed analytics and news on the forex market visit Tifia Forex Broker website tifia.com
|
|
#313
15-10-2018, 12:40
|
||||
|
||||
|
WTI: price maintains positive momentum
15/10/2018 Current Dynamics After US President Donald Trump announced that severe punitive measures would be imposed against Riyadh, oil prices rose during the Asian session on Monday. At the heart of the conflict between the United States and Saudi Arabia are the charges of the murder of Saudi journalist and dissident Jamal Hashoggi. On Sunday, Saudi Arabia promised to respond if Washington imposes sanctions. The kingdom also noted that the largest exporter of oil "plays a significant and active role in the global economy". Mutual threats by the United States and Saudi Arabia increase concerns on the oil market, which contributes to the resumption of rising oil prices At the end of last week, oil prices fell amid a collapse in the stock market, and also as a result of the revision of forecasts by OPEC and the International Energy Agency for Demand this year and next, downward. At the beginning of the European trading session, WTI crude oil traded near the mark of 71.80 dollars per barrel. Positive dynamics of oil prices persists, despite the decline last week. *)An advanced fundamental analysis is available on the Tifia Forex Broker website at tifia.com/analytics Support and Resistance Levels The price of WTI crude oil is in an uptrend, maintaining a long-term positive trend and trading in the ascending channels on the daily and weekly charts. On Thursday, the price of oil found support at 70.70 (EMA50 on the daily chart). Having repulsed from this level, the price attempts to grow above the important support level of 71.55 (ЕМА200 on the 4-hour chart). The overall trend is still bullish. Immediate growth targets are located at resistance levels of 72.80 (May highs), 73.85 (July highs), 75.00, 76.80 (annual and multi-year highs). In the case of the breakdown of the support level of 70.70, the targets will be the support levels of 68.60 (Fibonacci level 23.6% of the correction to the growth wave that started in June 2017 with the support level near the 42.00 mark), 68.10 (ЕМА144 on the daily chart), 66.35 (ЕМА200 on the daily). chart). While the price is above the key support level of 66.35, a long-term upward trend remains. Support levels: 71.55, 70.70, 68.60, 68.10, 66.35 Resistance levels: 72.80, 73.85, 75.00, 76.80 Trading Scenarios Sell Stop 70.20. Stop Loss 72.90. Take-Profit 68.60, 68.10, 66.35 Buy Stop 72.90. Stop Loss 70.20. Take-Profit 72.80, 73.85, 75.00, 76.80 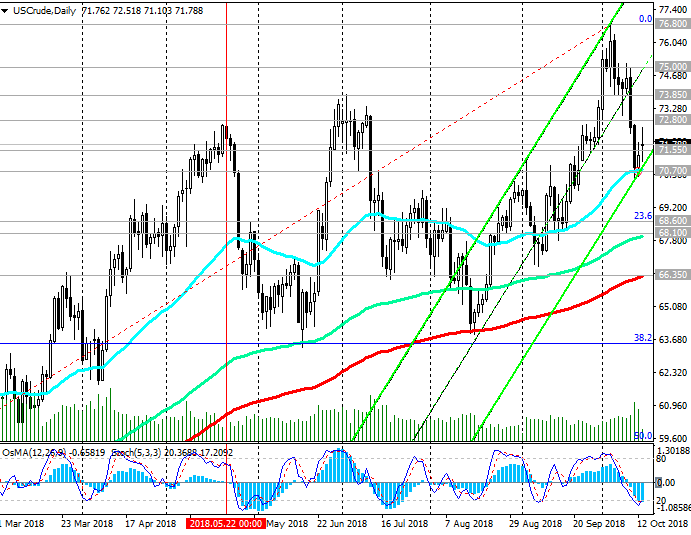 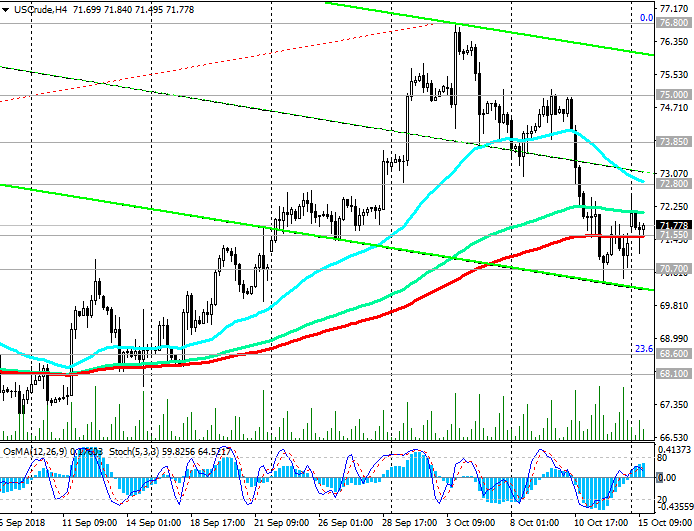 *) For up-to-date and detailed analytics and news on the forex market visit Tifia Forex Broker website tifia.com
|
|
#314
16-10-2018, 12:04
|
||||
|
||||
|
XAU/USD: correction after a long period of decline
16/10/2018 Current Dynamics Against the background of the continuing instability of stock markets, as well as weaker than expected macro data coming from the US, and the weakening dollar, investors are buying gold again. Last Monday, gold prices peaked from the end of July. Gold futures on COMEX rose on Monday to $ 1233.00 per ounce. A weaker dollar makes gold more attractive to holders of other currencies. However, the current growth in gold prices should be considered as a correction after a long period of decline. American stock indices in general are holding near record levels this year, and a strong dollar and high yield of treasury bonds have a negative impact on gold. After new strong financial reports and economic data, stock indexes and the dollar will start to grow again, and this will limit the potential for gold price growth. Despite the recent increase in gold quotes, it is necessary to look for an opportunity to enter short positions in the XAU / USD pair. The general trend of XAU / USD is still bearish. In the face of rising interest rates, the investment attractiveness of the dollar is rising, and of gold - is falling. *)An advanced fundamental analysis is available on the Tifia Forex Broker website at tifia.com/analytics Support and Resistance Levels From mid-April, XAU / USD has been trading in a downward channel on a weekly chart, the lower limit of which is near the support level of 1050.00 (2015 lows). Below the key resistance level of 1248.00 (EMA200 on the daily chart and the Fibonacci level of 50% of the correction to the wave of decline since July 2016), the downward trend prevails. The breakdown of the support level of 1220.00 (Fibonacci level 38.2%) confirms the return of XAU / USD to the global downtrend, which began in October 2012, and into the downward channel on the daily chart. Correctional growth may still continue to resistance levels of 1239.00 (EMA144 on the daily chart), 1248.00. However, in the long run, short positions are preferred below these levels. Levels of support: 1220.00, 1208.00, 1204.00, 1185.00, 1171.00, 1160.00, 1128.00, 1085.00, 1050.00 Resistance Levels: 1239.00, 1248.00, 1265.00, 1277.00 Trading Scenarios Sell Stop 1224.00. Stop Loss 1234.00. Take-Profit 1220.00, 1208.00, 1204.00, 1185.00, 1171.00, 1160.00, 1128.00, 1085.00, 1050.00 Buy Stop 1234.00. Stop Loss 1224.00. Take-Profit 1239.00, 1248.00, 1265.00, 1277.00 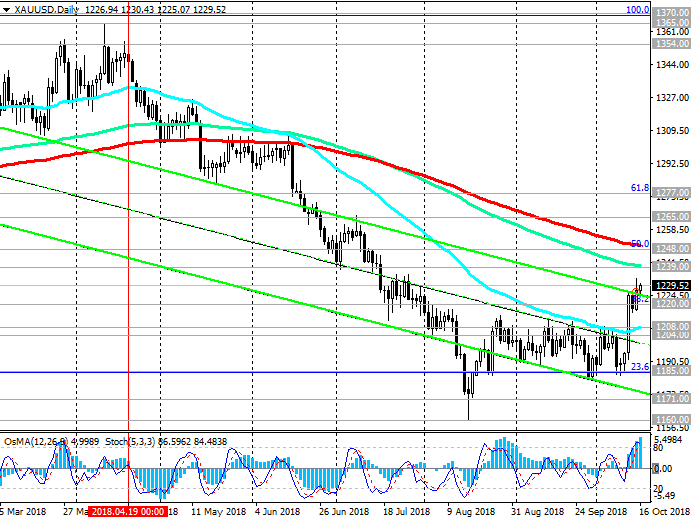 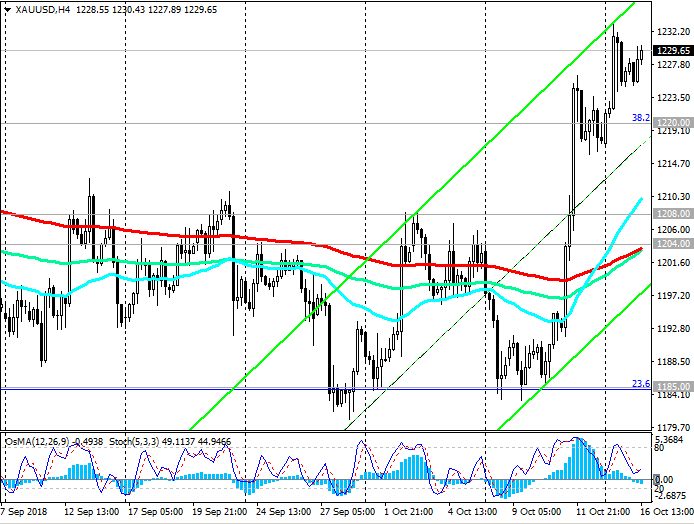 *) For up-to-date and detailed analytics and news on the forex market visit Tifia Forex Broker website tifia.com
|
|
#315
18-10-2018, 09:38
|
||||
|
||||
|
USD: Fed and EU Brexit Summit
10/18/2018 Current Dynamics The US dollar strengthened significantly on Wednesday against the background of uncertainties on Brexit, and after the publication of the minutes from the September Fed meeting. According to protocols published on Wednesday, the US central bank is going to continue to raise interest rates until the economy slows down. Despite the fact that two participants (FOMC) noted that they will not support the introduction of a restraining policy in the absence of obvious signs of overheating of the economy and inflation, in general, the Fed leaders are inclined to believe that the rates are low enough to stimulate lending, investment and expenses that support economic growth. In the minutes of the September meeting, published Wednesday, the Fed signaled the possibility of another rate increase in 2018 and three increases in 2019. According to the leaders of the Fed, raising rates will prevent overheating of the economy and keep inflation at a target level of 2%. Higher interest rates usually increase the demand for national currency. Investors also prefer the dollar during the period of trade instability, as this currency gets support due to faster economic growth than in other countries. US economic growth is now higher than a couple of years ago. At the same time, representatives of the UK and the EU, according to press reports, find it difficult to come to a consensus to make progress in the Brexit talks, and this raises doubts that the parties will be able to reach an agreement at all. The EU is ready to extend by one year the transition period for the UK to break the deadlock. The achievement of a trade agreement remains questionable, and the parties argue that they are stepping up preparations for the case of a British exit from the EU without an agreement. Against this background, the pound remains under pressure. A spokesman for the Bank of England, Canliff, said on Wednesday that the British pound may experience a "strong fall" in the event of a "bad Brexit". As a result, the growth of the US dollar on Wednesday was the strongest in the last two weeks. The DXY dollar index, which tracks the US currency against a basket of 6 other major currencies, rose 57 points to 95.35 on Wednesday. The yield on 10-year US Treasury bonds on Thursday is kept in the area of maximum marks (3.203%) after last week it reached 3.261%, the highest mark in 7.5 years. It also helps to strengthen the dollar.  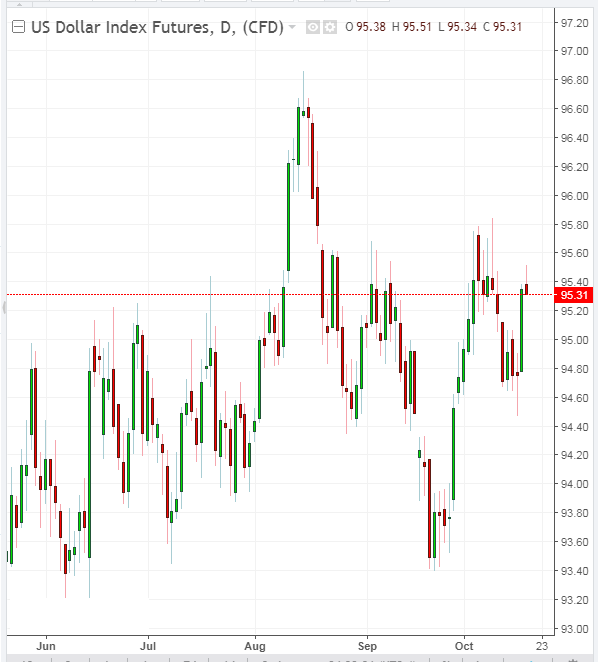 *) For up-to-date and detailed analytics and news on the forex market visit Tifia Forex Broker website tifia.com
|
|
#316
19-10-2018, 11:53
|
||||
|
||||
|
WTI: Current dynamics
10/19/2018 On Friday, the price of WTI crude oil reached an important support level of 68.60 (Fibonacci level 23.6% of the correction to the growth wave that started in June 2017 from the level of support near the 42.00 mark), after which an upward correction began. Just below is another strong support level of 68.10 (EMA144 on the daily chart). As long as the price is above the key support level of 66.40 (ЕМА200 on the daily chart and the bottom line of the ascending channel on the weekly chart), the long-term uptrend remains. If the price returns to the zone above the resistance level of 70.70, long positions will again become relevant. The overall trend is still bullish. The growth targets in the event of a resumption of positive dynamics are located at the resistance levels of 73.85 (July highs), 75.00, 76.80 (annual and multi-year highs). We are awaiting publication (at 17:00 GMT) of the weekly report of the American oilfield service company Baker Hughes on the number of active oil drilling rigs in the USA. If the report indicates a further increase in the number of drilling rigs (at the moment their number is 869 units), this will have an additional negative impact on oil quotations. Support Levels: 68.60, 68.10, 66.40 Resistance Levels: 70.70, 71.50, 72.00, 72.80, 73.85, 75.00, 76.80 Trading Scenarios Sell Stop 68.50. Stop Loss 69.80. Take-Profit 68.10, 66.40 Buy Stop 69.80. Stop Loss 68.50. Take-Profit 70.70, 71.50, 72.00, 72.80, 73.85, 75.00, 76.80 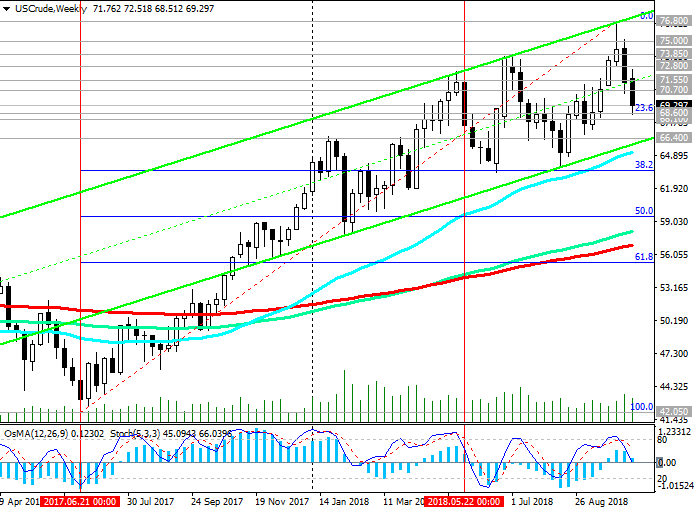 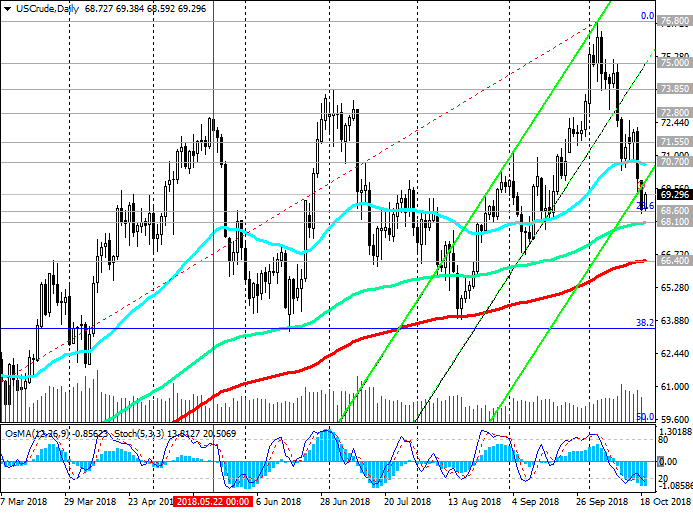 *) For up-to-date and detailed analytics and news on the forex market visit Tifia Forex Broker website tifia.com
|
|
#317
25-10-2018, 12:26
|
||||
|
||||
|
EURUSD: ECB. Press conference
10/25/2018 Current situation As expected, the European Central Bank left monetary policy unchanged on Thursday; the key rate remained unchanged at 0% and the ECB deposit rate for commercial banks at -0.4%. The ECB management said: Net asset purchases will end at the end of December 2018, depending on the incoming data. We will be reinvesting for a long period after the completion of net purchases. Net asset purchases will be 15 billion euros per month until the end of December 2018, and rates will remain at current levels at least until the end of the summer of 2019 Now the attention of market participants will be focused on the speech of the ECB President Mario Draghi, which will begin at 12:30 (GMT). If Mario Draghi makes unexpected statements, then volatility will increase dramatically. It is famous for its ability to expand its financial markets with its comments. If Mario Draghi announces the possibility of extending the QE program after December, the euro could be under additional pressure and decline. Meanwhile, EUR / USD remains under pressure, trading below the key resistance level of 1.1720 (EMA200, as well as the upper limit of the downward channels on the daily and weekly charts). The triggering of stop-losses at resistance levels 1.1450 (ЕМА200 on the 30-minute chart) and 1.1480 (ЕМА200 on the 1-hour chart) may accelerate the corrective growth of EUR / USD, up to the resistance level of 1.1565. However, negative dynamics prevail against the background of important fundamental factors. Recommended short positions. Support Levels: 1.1400, 1.1385, 1.1345, 1.1285, 1.1100 Resistance Levels: 1.1428, 1.1450, 1.1480, 1.1565, 1.1700, 1.1720, 1.1790, 1.1815 Trading recommendations Sell Stop 1.1380. Stop-Loss 1.1435. Take-Profit 1.1345, 1.1285, 1.1100 Buy Stop 1.1435. Stop-Loss 1.1380. Take-Profit 1.1450, 1.1480, 1.1565, 1.1700, 1.1720 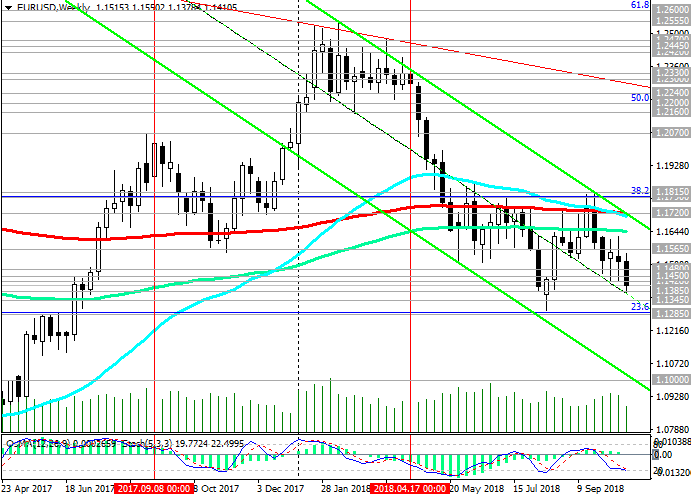 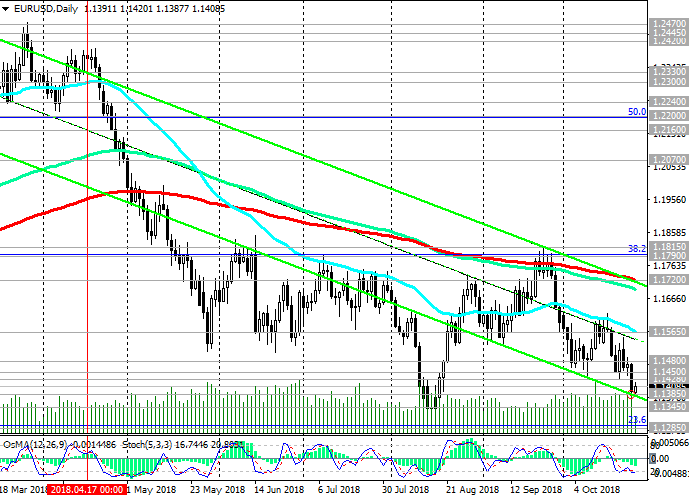 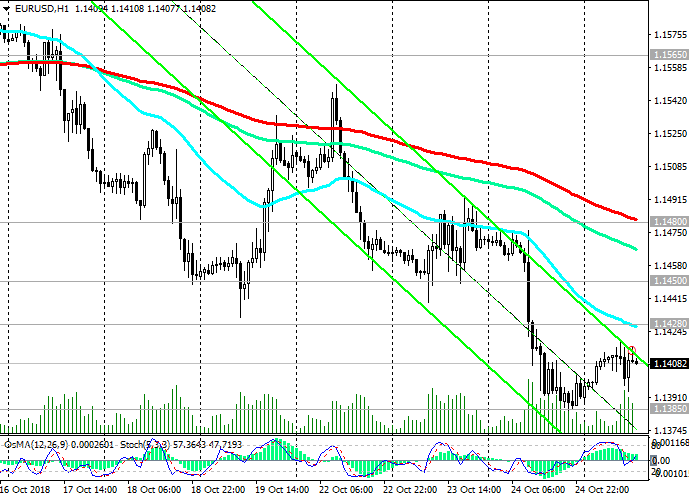 *) For up-to-date and detailed analytics and news on the forex market visit Tifia Forex Broker website tifia.com
|
|
#318
26-10-2018, 12:35
|
||||
|
||||
|
WTI: prices have reached important levels of support.
10/26/2018 Current Dynamics As the Energy Information Administration of the US Department of Energy reported on Wednesday, oil reserves in the country rose again (+6.35 million barrels against the forecast of 3.69 million barrels and after growing by 6.49 million barrels two weeks earlier). Oil prices predictably fell in response to this publication. Investors in the oil market are closely monitoring the situation in the stock markets after large-scale sales occurring this month. The S&P500 index, for example, has lost 9.5% since the beginning of the month; the Nasdaq Composite has rolled back more than 10% from its recent maximum, and the DJIA - by 7.2%. Oil prices are falling against the backdrop of prospects for increasing supply, due to concerns about global economic growth, as well as the strengthening of the dollar. Saudi Arabian Energy Minister Khaled Al-Falih said Monday that his country could increase oil production to 11 million barrels per day against the current average production level of 10.7 million barrels per day. So far, there has been a negative trend in oil prices. However, a political factor may appear in the dynamics of oil prices. If the United States and other Western countries impose sanctions on Saudi Arabia in connection with the murder of journalist Jamal Hashoggi, the Saudis, in response, can respond with an oil embargo that would lead to a price spike. On Friday, oil market participants will follow the publication (at 17:00 GMT) of the weekly report of the American oilfield service company Baker Hughes on the number of active oil drilling rigs in the United States. At the moment, their number is 873 units against 869 units and 861 units two and three weeks earlier. If the report indicates a further increase in the number of drilling rigs, this will have an additional negative impact on oil quotes. As long as oil prices remain high, American oil companies have a significant prospect and incentive to increase production, which, in turn, is another deterrent to oil price growth. On the whole, the long-term positive dynamics of oil prices persists, despite a three-week decline. Prices have reached important support levels, from which a rebound is most likely. Since November 1, sanctions against Iran by the United States come into force, which increases the likelihood of price growth due to the expected drop in Iranian exports by 2 million barrels per day. High likelihood of disruptions in oil supplies from Venezuela and Libya can also support prices. *)An advanced fundamental analysis is available on the Tifia Forex Broker website at tifia.com/analytics Support and Resistance Levels As a result of a three-week decline, the price of WTI crude oil reached an important support level of 66.50 (ЕМА200 on the daily chart and the lower line of the rising channel on the weekly chart). Above this level there is a long-term upward trend. The signal for the resumption of long positions will be the return of prices to the zone above the resistance levels of 68.00 (ЕМА144 on the daily chart), 68.60 (ЕМА200 on the 1-hour chart). The overall trend is still bullish. Growth targets in the event of a resumption of positive dynamics are located at resistance levels of 72.80 (May highs), 73.80 (July highs), 76.70 (annual and multi-year highs). Support Levels: 66.50, 66.00 Resistance Levels: 68.00, 68.60, 70.00, 70.70, 71.50, 72.00, 72.80, 73.80, 75.00, 76.70 Trading Scenarios Sell Stop 65.80. Stop Loss 68.70. Take-Profit 65.00, 64.00 Buy Stop 68.70. Stop-Loss 65.80. Take-Profit 70.00, 70.70, 71.50, 72.00, 72.80, 73.80, 75.00, 76.70    *) For up-to-date and detailed analytics and news on the forex market visit Tifia Forex Broker website tifia.com
|
|
#319
30-10-2018, 11:09
|
||||
|
||||
|
GBP/USD: Brexit - the main problem for the pound
10/30/2018 Current Dynamics Investors continue to analyze the budget submitted on Monday. Finance Minister Philip Hammond announced the completion of the savings regime, signaling an increase in government spending in the coming years. He expects that by the end of the fiscal year ending in March 2024, the budget deficit will be reduced to 19.8 billion pounds. This view is partly based on higher forecasts for economic growth and tax revenues over the next two years. Nevertheless, the ongoing negotiations on Brexit create a high level of uncertainty about the prospects for the economy. Brexit hard probability, i.e. UK exit from the EU without any agreement, puts pressure on the pound and the British stock market. The budget presented on Monday depends on reaching a favorable Brexit agreement. And until the agreement on Brexit has been reached, the realization of the largest spending in eight years remains in question. In the case of a hard Brexit, a deeper drop in pounds is likely. On Thursday, a meeting of the Bank of England will be held, and at 12:00 (GMT) the decision on rates will be published. It is expected that the rate will remain at the current level of 0.75%. A speech by Bank of England CEO Mark Carney, scheduled for 12:30 (GMT), could stir up markets if he makes unexpected statements. The soft rhetoric of Carney will further lower the pound and the pair GBP / USD. *)An advanced fundamental analysis is available on the Tifia Forex Broker website at tifia.com/analytics Support and Resistance Levels Long-term negative dynamics prevails below the key resistance level of 1.3210 (ЕМА200 on the daily chart and the Fibonacci level of 23.6% of the correction to the decline of GBP / USD in the wave that started in July 2014 near the level of 1.7200). In the case of a confirmed breakdown of the support level of 1.2780 (bottom line of the downward channel on the daily chart) GBP / USD will go inside the downward channel on the weekly chart, the lower limit of which near the 1.2000 mark (2017 lows) is passing. The immediate goal of reducing GBP / USD is at the support level of 1.2660 (2018 lows). The signal for the start of corrective growth will be the breakdown of the short-term resistance level of 1.2915 (ЕМА200 on the 1-hour chart). The maximum correctional growth is possible not above the resistance level of 1.3010 (ЕМА200 on the 4-hour chart, ЕМА50 on the daily chart). Support Levels: 1.2700, 1.2660, 1.2590, 1.2365, 1.2110, 1.2000 Resistance Levels: 1.2855, 1.2915, 1.3010, 1.3210 Trading Scenarios Sell in the market. Stop Loss 1.2860. Take-Profit 1.2700, 1.2660, 1.2590, 1.2365, 1.2110, 1.2000 Buy Stop 1.2860. Stop Loss 1.2750. Take-Profit 1.2915, 1.3010, 1.3210   *) For up-to-date and detailed analytics and news on the forex market visit Tifia Forex Broker website tifia.com
|
|
#320
31-10-2018, 12:42
|
||||
|
||||
|
XAU/USD: correctional growth is over
10/31/2018 Current Dynamics On Wednesday, global stock indices are rising for the second day in a row, although October will be completed with significant losses. In October, the DJIA lost 6%, S&P500 - 8%, and the Nasdaq - 11%. European and Asian indices in October suffered the strongest losses, however, most of all investors are worried about the American markets, where active sales were also observed. Market participants focused on concerns about trade conflicts between the United States and China and the Fed's harsh rhetoric about further raising interest rates. Investors are waiting for ADP data on jobs in the US private sector. The forecast is expected to increase by 189,000 employees, against +230,000 in September. On Friday, official data from the Ministry of Labor on Employment for October will be published. In general, strong data are expected to help investors see the strength of the American economy and the stability of the labor market. This, in turn, will give a positive impetus to US stock indexes, as well as positively affect the dollar quotes. If the data on the labor market is confirmed or will be better than the forecast, the dollar will continue to strengthen, which could adversely affect the gold quotes. Gold and dollar tend to move in opposite directions. In the face of an increase in interest rates, as a rule, the investment attractiveness of the dollar increases, and gold - falls. Recently, gold prices have risen due to the influence of a number of fundamental factors. The overall trend of gold, as before, remains bearish, despite the fact that since the beginning of the month the XAU / USD pair has risen by almost 4% to the mark of 1240.00 dollars per ounce. At the beginning of the US trading session, the XAU / USD pair is trading near the mark of 1217.00. *)An advanced fundamental analysis is available on the Tifia Forex Broker website at tifia.com/analytics Support and Resistance Levels Corrective XAU / USD growth, provoked at the beginning of the month by falling stock markets, seems to have ended. Having tested a strong resistance level of 1238.00 (ЕМА144 on the daily chart), above which the key resistance level of 1248.00 is located (ЕМА200 on the daily chart and the Fibonacci level 50% of the correction to the decline wave since July 2016), XAU / USD has been decreasing for the third day in a row. Breakdown of support levels of 1220.00 (Fibonacci 38.2%), 1215.00 (EMA200 on the 4-hour chart, EMA50 on the daily chart) will return XAU / USD to the global downward trend that began in October 2012. Breaking the resistance level of 1248.00 would increase the risk of breaking the bearish trend. Nevertheless, long-term downward dynamics prevails. In the long run below the level of 1215.00 preferred short positions. Support Levels: 1215.00, 1207.00, 1200.00, 1185.00, 1171.00, 1160.00, 1128.00, 1085.00, 1050.00 Resistance Levels: 1220.00, 1226.00, 1238.00, 1248.00, 1260.00, 1266.00, 1277.00 Trading Scenarios Sell Stop 1213.00. Stop Loss 1222.00. Take-Profit 1207.00, 1200.00, 1185.00, 1171.00, 1160.00 Buy Stop 1222.00. Stop Loss 1213.00. Take-Profit 1226.00, 1238.00, 1248.00 *) For up-to-date and detailed analytics and news on the forex market visit Tifia Forex Broker website tifia.com
|
|
|
|
 Similar Threads
|
||||
| Thread | Thread Starter | Forum | Replies | Last Post |
| Tifia Daily Market Analytics | TifiaFX | Forex Analysis | 0 | 22-03-2017 14:17 |
| Tifia Daily Market Analytics | TifiaFX | Forex Analysis | 0 | 16-03-2017 14:48 |
| Tifia Daily Market Analytics | TifiaFX | Forex Analysis | 0 | 14-03-2017 09:52 |
| Daily Market Analysis by FxGrow | FxGrow10 | Forex Analysis | 0 | 06-05-2015 01:03 |
| Daily Market update by UWC | effexx | Trading Journals | 156 | 01-03-2012 10:40 |


