Forex Forums | ForexLasers.com |
|
|||||||
 |
|
|
LinkBack | Thread Tools | Search this Thread |
|
#1
 30-05-2015, 22:13
|
||||
|
||||
|
Dear Forum Members!
Here you can find Daily Market Analysis of Currencies, Indexes, Metals, Oil and others. We hope that this information will be helpful for your trading. Best Regards FxGrow Support ----------------------------------------------------------------------------- 
|
|
#2
23-02-2016, 17:26
|
||||
|
||||
|
FxGrow Daily Technical Analysis 13th Feb, 2016
By FxGrow Research & Analysis Team EURUSD - movement towards 1.1160 support Supply at EURUSD took over control after Thursday's test of resistance at 1.1380. First support at 1.1320 wasn't able to stop decline and today for the first minutes of trading downward movement is continuing. Nearest support is at 1.1160 but if it breaks stronger support will be located at 1.1100. One of that levels should make rebound. There will be not many macroeconomic data in next few days that could increase volatility at EURUSD. Next important data will be protocols of last FOMC meeting. So-called FOMC minutes will be published on Thursday Time-frame M30 Note: This analysis is intended to provide general information and does not constitute the provision of INVESTMENT ADVICE. Investors should, before acting on this information, consider the appropriateness of this information having regard to their personal objectives, financial situation or needs. We recommend investors obtain investment advice specific to their situation before making any financial investment decision.
|
|
#3
23-02-2016, 17:30
|
||||
|
||||
|
FxGrow Daily Technical Analysis 15th Feb, 2016
By FxGrow Research & Analysis Team USDJPY - sharp return above 114.00 In previous analysis from February 9 I indicated weakness of the bulls at USDJPY and possibility of price movement towards 109.80. I wrote: 'Demand is weak and support at 116.10 wasn't defended. Nearest supports are at 114.00, 112.30. However it is likely that even support at 109.80 may be tested'. Indeed price fell below support 112.30, however rebound occurred earlier at 111.00. Demand's reaction was strong and price returned sharply above 112.30. Today price is continuing upward movement and resistance at 114.00 was broken. Target for current upward movement is at 116.10. Return above 116.10 will be a bullish signal, but rebound from that level will give better chance for the bears. Time-frame D1 Note: This analysis is intended to provide general information and does not constitute the provision of INVESTMENT ADVICE. Investors should, before acting on this information, consider the appropriateness of this information having regard to their personal objectives, financial situation or needs. We recommend investors obtain investment advice specific to their situation before making any financial investment decision.
|
|
#4
23-02-2016, 17:37
|
||||
|
||||
|
FxGrow Daily Technical Analysis 16th Feb, 2016
By FxGrow Research & Analysis Team EURGBP - bulls offensive in progress EURGBP moves in uptrend since lows from November 2015. Upward movement is very dynamic. Corrections which occurred during this period retraced only 23.6% of main trend. Struggle between demand and supply can be seen at 0.7760 - 0.7800. Because it lasts since a week it shows the determination of the bulls and the strength of that level. It can be found at weekly TF how important that level was in the past. It is likely that this level won't break and rebound will occur. Nearest support is at 0.7700 however more important level were potential declines should reach is 0.7540. This level coincides with Fibonacci 38.2% of previous upward movement. Alternatively if bulls are strong enough next resistances will be at 0.7900, 0.8030. Note: This analysis is intended to provide general information and does not constitute the provision of INVESTMENT ADVICE. Investors should, before acting on this information, consider the appropriateness of this information having regard to their personal objectives, financial situation or needs. We recommend investors obtain investment advice specific to their situation before making any financial investment decision.
|
|
#5
23-02-2016, 17:39
|
||||
|
||||
|
FxGrow Daily Technical Analysis 17th Feb, 2016
By FxGrow Research & Analysis Team GBPUSD returned to declines, after short correction Previous GBPUSD analysis gave almost 300 pips profit. I wrote: "If price stays above 1.4500 first target for falls will be at 1.4400. Next goal for bears will be 1.4200". First indicated level was reached very fast and second level could be tested today. Current chart pattern supports declines. After downward movement which lasted since December 11 to January 21 rebound occurred. Corrections which occurred after this period retraced 50% of previous declines. Price returned to main trend and yesterday support at 1.4380 was broken below. Today GBPUSD continues downward movement, nearest supports are located at 1.4200, 1.4080. When that last level will be broken (January 2016 low) next important levels are located at: 1.3720, 1.3500 (2009 historical low). Note: This analysis is intended to provide general information and does not constitute the provision of INVESTMENT ADVICE. Investors should, before acting on this information, consider the appropriateness of this information having regard to their personal objectives, financial situation or needs. We recommend investors obtain investment advice specific to their situation before making any financial investment decision.
|
|
#6
19-06-2017, 02:12
|
||||
|
||||
|
FxGrow Daily Technical Analysis 16th June, 2017
By FxGrow Research & Analysis Team USD/JPY Testing 50-EMA Ahead of BOJ Statement As expected, BOJ has maintained Interest Rates at current -0.1% with 44-pips price action movement for Friday trading session. USD/JPY rallied to to 111.27 high, currently trading 111.15, flirting with 50-EMA at 111.19. Currently, U.S Index is still pushing higher with 97.54 June record high, giving bull hand to USD/JPY with expectations for further incline for the pair. The pair still awaits BOJ's press conference shortly and market will have to wait for Gov. Kuroda statement with expectation for more ... Note: This analysis is intended to provide general information and does not constitute the provision of INVESTMENT ADVICE. Investors should, before acting on this information, consider the appropriateness of this information having regard to their personal objectives, financial situation or needs. We recommend investors obtain investment advice specific to their situation before making any financial investment decision.
|
|
#7
19-06-2017, 02:15
|
||||
|
||||
|
FxGrow Daily Technical Analysis 14th June, 2017
By FxGrow Research & Analysis Team Crude Oil Desperately Pushes higher With Failure, U.S Inventories Eyed Crude Oil traded below $50 bp benchmark for the past two weeks, still receiving mixed signals by both OPEC and increasing U.S inventories output and with that, traders are taking precaution measures, avoiding the black gold commodity trading. On Monday, oil peek recorded $46.69 bp weekly high but failed to hold soft gains, still closing below 46.00 level. Recent political tension in middle east including Qatar and Saudi Arabia fueled oil prices with $48.20 bp high, but as both opponents pledged for the market that despite the rift that's still going on will, OPEC deal or output production still runs ... Note: This analysis is intended to provide general information and does not constitute the provision of INVESTMENT ADVICE. Investors should, before acting on this information, consider the appropriateness of this information having regard to their personal objectives, financial situation or needs. We recommend investors obtain investment advice specific to their situation before making any financial investment decision.
|
|
#8
19-06-2017, 02:22
|
||||
|
||||
|
FxGrow Daily Technical Analysis 14th June, 2017
By FxGrow Research & Analysis Team FOMC: Fundamental and Technical Overview Markets is anticipating a definite rate hike with an additional 0.25% to current 1.00%. Currently, odds are at 100%, confirmed by major sources. In case FOMC delivered a rate increase, the question that follows is how will the FOMC's statement address Inflation and balance sheet. Job sector is out performing recently but inflation last reported in April shows 2.2%, still on gradual decline last reported on Feb 2017 at 2.7%, not stable at 2% target as U.S Fed sees ultimate. Beside (Inflation??), Yellen will have to answer for $4.5 trillion balance sheet supporting US Reserve needs with a surplus, far from market requirement. In case the statement kept asset purchasing without a reduction or setting a specific date, this could send a negative shock to market that could limit U.S Dollar gains Another matter still revolves in mind, Yellen promised three rate hikes for 2017. Once was delivered on March, second is expected ... Note: This analysis is intended to provide general information and does not constitute the provision of INVESTMENT ADVICE. Investors should, before acting on this information, consider the appropriateness of this information having regard to their personal objectives, financial situation or needs. We recommend investors obtain investment advice specific to their situation before making any financial investment decision.
|
|
#9
19-06-2017, 02:25
|
||||
|
||||
|
FxGrow Daily Technical Analysis 15th June, 2017
By FxGrow Research & Analysis Team Gold Downtrend To Be Confirmed Today, Eyes on U.S data Gold peeked yesterday to 1281.13 after disappointing multiple inflation U.S key figures that decreased Sept Fed hike odds down to 38% after being at 54%. After that, eyes were centered at FOMC meeting yesterday with high anticipation for a definite rate increase with 0.25%, followed by a statement by Yellen which turned hawkish more than expectations. As a result, U.S Index was strengthening, adding pressure on gold, pushing the precious metal downward with almost -$21 (1257.16 low) before closing the session. Currently gold is trading 1255.49, after plunging to 1253 low (S1), below 50-EMA daily at 1259 which is 100% confirmation for ... Note: This analysis is intended to provide general information and does not constitute the provision of INVESTMENT ADVICE. Investors should, before acting on this information, consider the appropriateness of this information having regard to their personal objectives, financial situation or needs. We recommend investors obtain investment advice specific to their situation before making any financial investment decision.
|
|
#10
19-06-2017, 02:31
|
||||
|
||||
|
FxGrow Daily Technical Analysis 16th June, 2017
By FxGrow Research & Analysis Team USD/JPY Testing 50-EMA Ahead of BOJ Statement 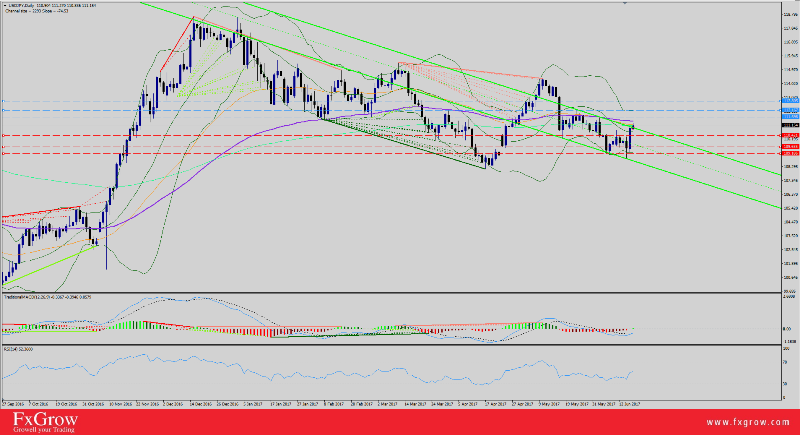 As expected, BOJ has maintained Interest Rates at current -0.1% with 44-pips price action movement for Friday trading session. USD/JPY rallied to to 111.27 high, currently trading 111.15, flirting with 50-EMA at 111.19. Currently, U.S Index is still pushing higher with 97.54 June record high, giving bull hand to USD/JPY with expectations for further incline for the pair. The pair still awaits BOJ's press conference shortly and market will have to wait for Gov. Kuroda statement with expectation for more ... For more in depth Research & Analysis please visit FxGrow. Note: This analysis is intended to provide general information and does not constitute the provision of INVESTMENT ADVICE. Investors should, before acting on this information, consider the appropriateness of this information having regard to their personal objectives, financial situation or needs. We recommend investors obtain investment advice specific to their situation before making any financial investment decision.
|
|
#11
19-06-2017, 02:35
|
||||
|
||||
|
FxGrow Daily Technical Analysis 16th June, 2017
By FxGrow Research & Analysis Team EUR/USD Inches Higher Ahead of Local Data 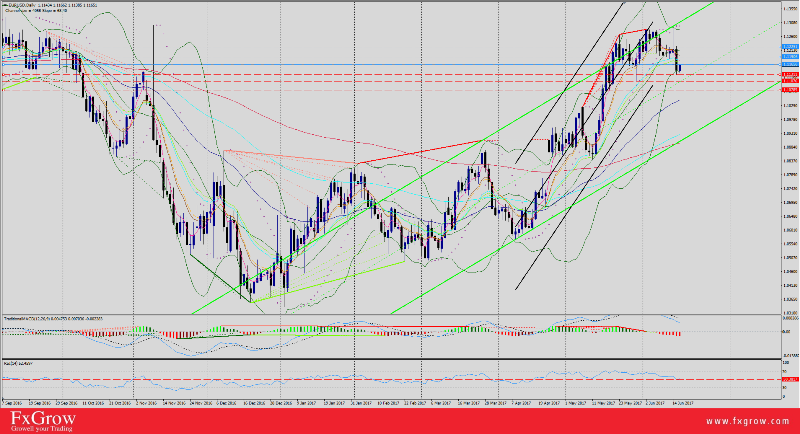 EUR/USD lost 96-pips value yesterday after plunging to 1.1132. Still the pair pressured by recovering U.S Dollar with 97.54 June record after hawkish FOMC meeting on Wednesday. Currently the pair is trading 1.1156 intraday, still below its 20-EMA at 1.1170. Overall, signs of bearish momentum revolves for EUR/USD taking into consideration boosted U.S Dollar with June hike, but EURO awaits local data shortly, which can give some solid ground to re-climb the 1.1200 again, still market has to see how ... For more in depth Research & Analysis please visit FxGrow. Note: This analysis is intended to provide general information and does not constitute the provision of INVESTMENT ADVICE. Investors should, before acting on this information, consider the appropriateness of this information having regard to their personal objectives, financial situation or needs. We recommend investors obtain investment advice specific to their situation before making any financial investment decision.
|
|
#12
19-06-2017, 10:11
|
||||
|
||||
|
FxGrow Daily Technical Analysis 19th June, 2017
By FxGrow Research & Analysis Team EUR/USD Under Pressure By Recovering U.S Dollar 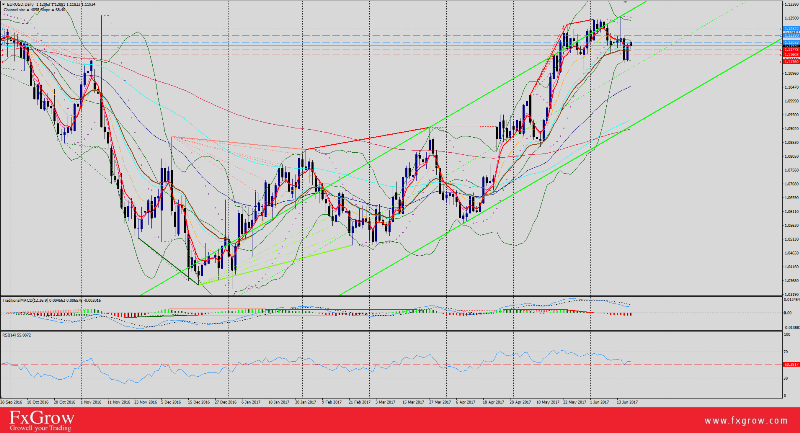 EUR/USD inaugurated Monday's trading session with 26-pips loss and 1.1182 low. Currently, U.S Dollar is showing signs of recovery, inching higher with 97.24 high for today. Technically, the pair is still trading above 20-EMA at 1.1175 which keeps the market in an uptrend destination. Closing above 1.1200 level, suggests for more attacks and the pair will test R1 at 1.1228, then 1.1252. On the other hand, if EUR/USD closed below 20-EMA, expectations for a correction phase within Friday's range at 1.1130+. Fundamentally, Macron's victory for French Parliament should give a boost for the pair and keeping the ... For more in depth Research & Analysis please visit FxGrow. Note: This analysis is intended to provide general information and does not constitute the provision of INVESTMENT ADVICE. Investors should, before acting on this information, consider the appropriateness of this information having regard to their personal objectives, financial situation or needs. We recommend investors obtain investment advice specific to their situation before making any financial investment decision.
|
|
#13
20-06-2017, 09:19
|
||||
|
||||
|
FxGrow Daily Technical Analysis 20th June, 2017
By FxGrow Research & Analysis Team Gold In A Correction Phase, Still The Downside Persists 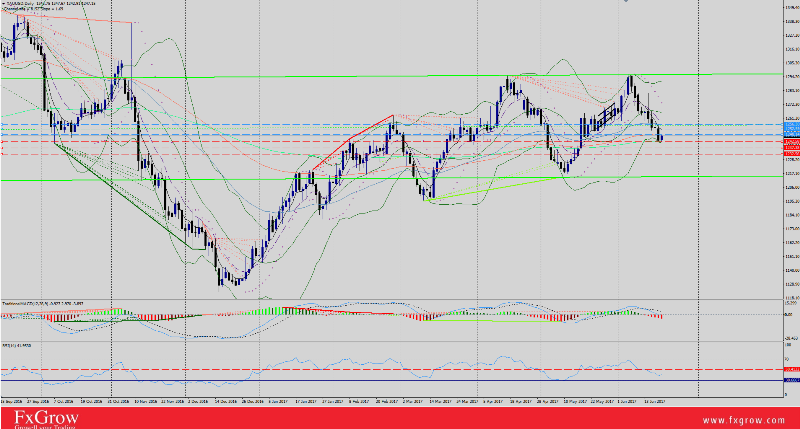 Gold extended the bearish momentum for the 10th consecutive session shedding -$12.70 yesterday and 1243 low for yesterday. First, Gold bumped into support at 1247 with RSI indicating an oversold market, as a result, gold managed to make a correction at 1253, but as FOMC members Dudley and Evans crossed wires with an additional hawkish stance, gold was sold aggressively pushing the precious metal into second support at 1242 despite that RSI (H1) indicated an oversold market at 20 level. Currently, gold is on a correction phase trading 1247, with a possibility for further additional correction mode at 1249 as RSI re-balances to 50 level (H1), which will give a signal for market to continue ... For more in depth Research & Analysis please visit FxGrow. Note: This analysis is intended to provide general information and does not constitute the provision of INVESTMENT ADVICE. Investors should, before acting on this information, consider the appropriateness of this information having regard to their personal objectives, financial situation or needs. We recommend investors obtain investment advice specific to their situation before making any financial investment decision.
|
|
#14
21-06-2017, 05:44
|
||||
|
||||
|
FxGrow Daily Technical Analysis 21st June, 2017
By FxGrow Research & Analysis Team Sterling: Expectation For Additional Dips Ahead of Local Data 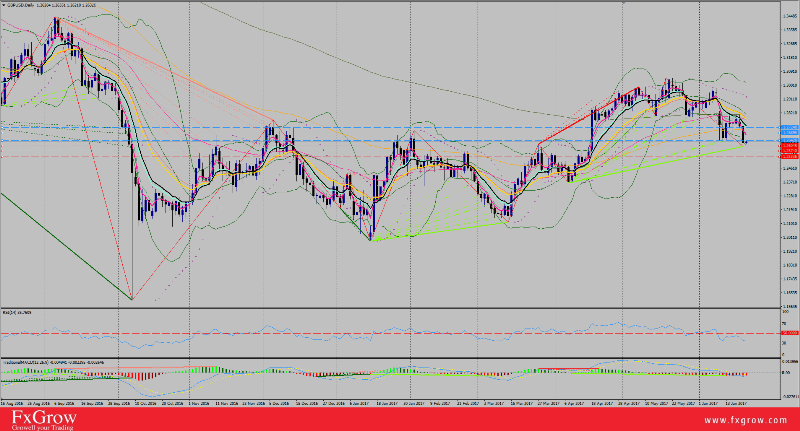 GBP/USD remains under threat after hung Parliament election. The pair awaited yesterday for a hawkish stance by BOE Carney, but as the Gov. terminated the possibility of potential rate hikes, the cable dropped pressure with 155-pips yesterday landing on 1.2603 low. on the other hand, PM May latest news indicates that Conservatives have failed to reach out to DUP Party with a deal to control Parliament seats majority ahead of spiky Brexit negotiations which adds more pressure on Pound. Sterling awaits local Sector Net Borrowing data, followed by Haldane speech this after noon, but the above ... For more in depth Research & Analysis please visit FxGrow. Note: This analysis is intended to provide general information and does not constitute the provision of INVESTMENT ADVICE. Investors should, before acting on this information, consider the appropriateness of this information having regard to their personal objectives, financial situation or needs. We recommend investors obtain investment advice specific to their situation before making any financial investment decision.
|
|
#15
21-06-2017, 12:14
|
||||
|
||||
|
FxGrow Daily Technical Analysis 21st June, 2017
By FxGrow Research & Analysis Team Oil Glut Still Overwhelms Market With Fear Ahead Of U.S Inventories 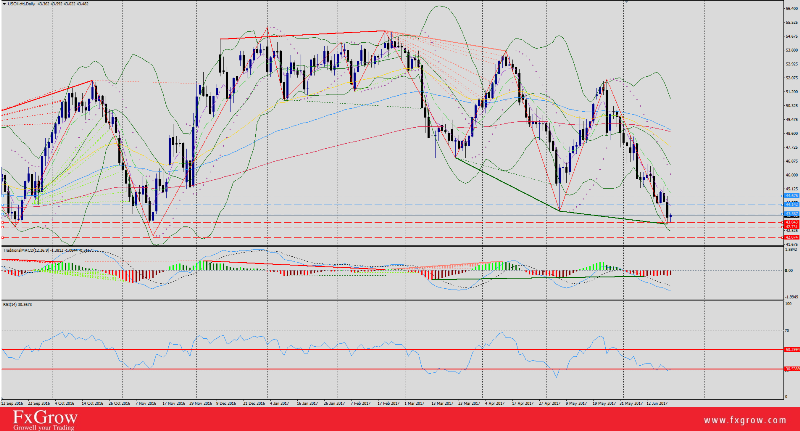 Crude oil prices has been on a gradual decline since 25th of May with $9.00 loss and $42.93 low yesterday. Despite OPEC and Non-OPEC reports showing a high level of compliance during May estimated at 108%, fear of global oversupply still overwhelms the market, pushing oil prices lower. Libya's oil production rose more than 50,000 bpd to 885,000 bpd after the state oil company settled a dispute with Germany's Wintershall.Nigerian oil supply is also ... For more in depth Research & Analysis please visit FxGrow. Note: This analysis is intended to provide general information and does not constitute the provision of INVESTMENT ADVICE. Investors should, before acting on this information, consider the appropriateness of this information having regard to their personal objectives, financial situation or needs. We recommend investors obtain investment advice specific to their situation before making any financial investment decision.
|
|
#16
22-06-2017, 07:18
|
||||
|
||||
|
FxGrow Daily Technical Analysis 22nd June, 2017
By FxGrow Research & Analysis Team EUR/USD Revives The Bullish Trend Ahead of U.S Data  EUR/USD plunged yesterday to 1.1127 low but managed to make a reverse course with a daily bullish candle at 1.1169 high. Today, the pair clocked a newer high at 1.1177 with expectations for further pip-gains as the greenback trading pale with 97.05 low. Fundamentally, U.S Dollar was receiving a lifting hand by FOMC members, crossing wires extending hawkish stance ever since U.S Feds hiked a 0.25% interest rates for desperate measures knowing that current Trump policy and it's negative impact on the buck will limit the Index from normal gains. EUR/USD awaits U.S Unemployment Claims today ... For more in depth Research & Analysis please visit FxGrow. Note: This analysis is intended to provide general information and does not constitute the provision of INVESTMENT ADVICE. Investors should, before acting on this information, consider the appropriateness of this information having regard to their personal objectives, financial situation or needs. We recommend investors obtain investment advice specific to their situation before making any financial investment decision.
|
|
#17
22-06-2017, 10:19
|
||||
|
||||
|
FxGrow Daily Technical Analysis 22nd June, 2017
By FxGrow Research & Analysis Team USD/CAD Testing 100-EMA Ahead of Candian Retails Sales  USD/CAD has been testing 100-EMA at 1.3340 for the second consecutive session. Yesterday, the pair rallied +84-pips with 1.3347 high and today, market is showing low price action with only 21-pips as price action. Currently USD/CAD is trading 1.3317 as U.S Index continues to show weakness. On the other hand, crude oil levels dropping to 10 months lows kept the loonie under pressure with failure to extend gains. Add to that, NAFTA terms re-negotiations still weigh on Canadian economy with no recent updates or ... For more in depth Research & Analysis please visit FxGrow. Note: This analysis is intended to provide general information and does not constitute the provision of INVESTMENT ADVICE. Investors should, before acting on this information, consider the appropriateness of this information having regard to their personal objectives, financial situation or needs. We recommend investors obtain investment advice specific to their situation before making any financial investment decision.
|
|
#18
22-06-2017, 12:23
|
||||
|
||||
|
FxGrow Daily Technical Analysis 22nd June, 2017
By FxGrow Research & Analysis Team Gold Downtrend Still Persists With Rejection for 1240 level, Eyes on U.S Data  Gold showed immunity against 1240 level with a rejection for penetration during this weekly trading session. Yesterday, a positive U.S Existing Home Sales was released, yet gold rallied and extended gains today with 1254.85 high, still to be considered a correction phase after last week's sharp declines. Today, gold's bearish momentum will be tested further more, with expectations for intense volatility as U.S releases Unemployment Claims data. Any further rejection for 1240 is an indication for further correction phase and potential of bullish momentum build up. On the other hand, if U.S data we negative, gold will receive an extra lifting hand supported by today's rallies and closing above 1265, 100% for bullish momentum. In case the data was negative and 1241 support level failed, market should look into further dips with a destination for 1237, then 1230. For more in depth Research & Analysis please visit FxGrow. Note: This analysis is intended to provide general information and does not constitute the provision of INVESTMENT ADVICE. Investors should, before acting on this information, consider the appropriateness of this information having regard to their personal objectives, financial situation or needs. We recommend investors obtain investment advice specific to their situation before making any financial investment decision.
|
|
#19
26-06-2017, 07:19
|
||||
|
||||
|
FxGrow Daily Technical Analysis 23rd June, 2017
By FxGrow Research & Analysis Team EUR/USD Flirts With 1.1200 Ahead German Ifo Report  EUR/USD opened Monday's trading session bouncing off 1.1190 support area testing with 1.1189 low, and failed with to extend further gains beyond 1.1200 level, only by +1-pip (1.1201 high). Technically the pair is still trading above 10-EMA level and last week, the pair dips were fighting 1.1130 support area with failure to break, sustaining the bullish momentum and keeping potential for further rallies aimed at 1.1200+ area. On the other hand, the buck continues to show weakness supported by negative Services and Manufacturing PMI last reported on Friday and wallowing Trump's administration performance pulling U.S Index to 96.84 low and pushing EURO ... For more in depth Research & Analysis please visit FxGrow. Note: This analysis is intended to provide general information and does not constitute the provision of INVESTMENT ADVICE. Investors should, before acting on this information, consider the appropriateness of this information having regard to their personal objectives, financial situation or needs. We recommend investors obtain investment advice specific to their situation before making any financial investment decision.
|
|
#20
26-06-2017, 07:49
|
||||
|
||||
|
FxGrow Daily Technical Analysis 26th June, 2017
By FxGrow Research & Analysis Team EUR/USD Flirts With 1.1200 Ahead German Ifo Report EUR/USD opened Monday's trading session bouncing off 1.1190 support area testing with 1.1189 low, and failed with to extend further gains beyond 1.1200 level, only by +1-pip (1.1201 high). Technically the pair is still trading above 10-EMA level and last week, the pair dips were fighting 1.1130 support area with failure to break, sustaining the bullish momentum and keeping potential for further rallies aimed at 1.1200+ area. On the other hand, the buck continues to show weakness supported by negative Services and Manufacturing PMI last reported on Friday and wallowing Trump's administration performance pulling U.S Index to 96.84 low and pushing EURO ... For more in depth Research & Analysis please visit FxGrow. Note: This analysis is intended to provide general information and does not constitute the provision of INVESTMENT ADVICE. Investors should, before acting on this information, consider the appropriateness of this information having regard to their personal objectives, financial situation or needs. We recommend investors obtain investment advice specific to their situation before making any financial investment decision.
|
|
#21
28-06-2017, 11:35
|
||||
|
||||
|
FxGrow Daily Technical Analysis 28th June, 2017
By FxGrow Research & Analysis Team GBP/USD Rallies Supported by Positive Fundamental, Awaiting Carney 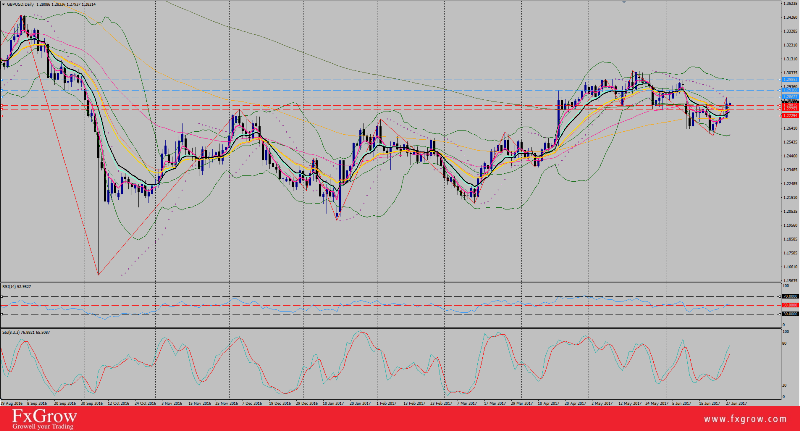 After a disappointing UK Parliament Elections with sharp decline for GBP/USD, the pair found some positive fundamentals supporting Sterling sharp tone facing collapsing U.S Dollar. GBP/USD recorded +144-pips price action with 1.2860 high and closing at 1.2813, above 50-EMA (1.2777) which confirms a bullish momentum. Today, the cable plunged to 1.279 low after clocking 1.2827 high, currently trading at 1.2816 with expectations for more volatility taking into consideration sharp declines ... For more in depth Research & Analysis please visit FxGrow. Note: This analysis is intended to provide general information and does not constitute the provision of INVESTMENT ADVICE. Investors should, before acting on this information, consider the appropriateness of this information having regard to their personal objectives, financial situation or needs. We recommend investors obtain investment advice specific to their situation before making any financial investment decision.
|
|
#22
28-06-2017, 12:02
|
||||
|
||||
|
FxGrow Daily Technical Analysis 28th June, 2017
By FxGrow Research & Analysis Team Crude Oil Technical Overview Ahead of U.S Inventories 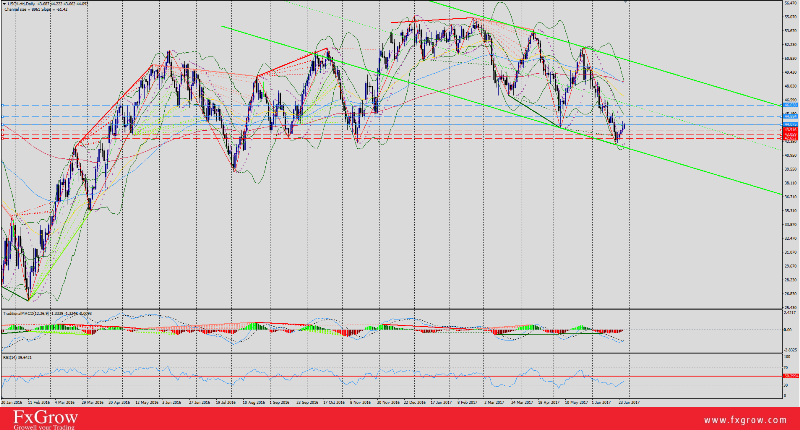 Overall the market is bearish, but fighting to hold the 42.20- target. The trade posture remains negative and a drop through 42.53 is negative, rekindling bearish trade. A close under 42.20 alerts for a wash under 40.00-. Stay prepared for additional corrections, but rallies contained under 45.08* will retain bear forces. A close over 45.08* stops the selloff. A close over 4658* signals a ... For more in depth Research & Analysis please visit FxGrow. Note: This analysis is intended to provide general information and does not constitute the provision of INVESTMENT ADVICE. Investors should, before acting on this information, consider the appropriateness of this information having regard to their personal objectives, financial situation or needs. We recommend investors obtain investment advice specific to their situation before making any financial investment decision.
|
|
#23
28-06-2017, 12:39
|
||||
|
||||
|
FxGrow Daily Technical Analysis 28th June, 2017
By FxGrow Research & Analysis Team Gold Technical Overview Ahead of Central Banks Speeches  Currently, gold favors sideways trading, stuck between 1240 & 1250 as the precious awaits further signals from U.S Index movements. Expectations for high volatility as ECB, BOE, BOC, and BOJ's Govs.address markerts today at 1:30 PM GMT. A more pressure on U.S Index will boost gold current advance. On the other hand, in case the buck managed to make a correction upward, expectations that gold will extend the ... For more in depth Research & Analysis please visit FxGrow. Note: This analysis is intended to provide general information and does not constitute the provision of INVESTMENT ADVICE. Investors should, before acting on this information, consider the appropriateness of this information having regard to their personal objectives, financial situation or needs. We recommend investors obtain investment advice specific to their situation before making any financial investment decision.
|
|
#24
03-07-2017, 06:39
|
||||
|
||||
|
FxGrow Daily Technical Analysis 03rd July, 2017
By FxGrow Research & Analysis Team EUR/USD Taking A break Before Further Advance, Eyes on Local Data  After a superb run for EUR/USD last week with 1.1445 high with technical indicators shows an over bought market, the pair showed a daily bearish candle on Friday and extended the correction phase on Monday's trading session with 1.1403 low, On the other hand, U.S Index is currently showing a minor recovery with 95.55 high tackling EUR/USD from further advance. Currently the pair is trading 1.1408 intraday, still above 10-EMA at 1.1360. Fundamentally, the pair awaits Manufacturing PMI, both from EU first, followed by U.S in after noon which should impact EUR/USD levels. For more in depth Research & Analysis please visit FxGrow. Note: This analysis is intended to provide general information and does not constitute the provision of INVESTMENT ADVICE. Investors should, before acting on this information, consider the appropriateness of this information having regard to their personal objectives, financial situation or needs. We recommend investors obtain investment advice specific to their situation before making any financial investment decision.
|
|
#25
04-07-2017, 08:13
|
||||
|
||||
|
FxGrow Daily Technical Analysis 04th July, 2017
By FxGrow Research & Analysis Team GBP/USD Retesting Bullish Momentum Ahead of Construction PMI  GBP/USD received a hit yesterday with negative with UK manufacturing PMI causing the cable 90-pips loss 1.2932 low. On the other hand, greenback extended recovery session today, boosted by positive data yesterday with a 96.04 high, add more pressure on the cable. Technically, the pair is still in uptrend phase trading above 10-EMA at 1.2880. GBP/USD is currently trading 1.2940 intraday. Fundamentally, the pair awaits UK Construction PMI with absence of U.S Data today due to 4th of July holiday. The data will re-test GBP/USD bullish trend depending on the ... For more in depth Research & Analysis please visit FxGrow. Note: This analysis is intended to provide general information and does not constitute the provision of INVESTMENT ADVICE. Investors should, before acting on this information, consider the appropriateness of this information having regard to their personal objectives, financial situation or needs. We recommend investors obtain investment advice specific to their situation before making any financial investment decision.
|
|
#26
06-07-2017, 06:09
|
||||
|
||||
|
FxGrow Daily Technical Analysis 06th July, 2017
By FxGrow Research & Analysis Team EUR/USD Still Testing 10-EMA Ahead of ECB Meeting  EUR/USD bullish momentum survived yesterdays FOMC meeting as the U.S Index spikes were contaminated with 96.24 high as market expected more attacks due to previous hawkish U.S Fed statement, but instead a lesser was given by Yellen Yesterday. The pair clocked 1.1368 high yesterday and 1.11325 low for today, still testing 10-EMA area at 1.1320 with 25-pips price action for today with expectations for more volatility as EU releases German Factory Orders, but the focus will be on ECB statement today. Last appearances for Mr. Draghi were hawkish, stressing an intolerance for rising inflation in the EU and the ECB could taper with rates. ECB statement today, if it is consistent with Draghis last speeches, will fuel EUR/USD ... For more in depth Research & Analysis please visit FxGrow. Note: This analysis is intended to provide general information and does not constitute the provision of INVESTMENT ADVICE. Investors should, before acting on this information, consider the appropriateness of this information having regard to their personal objectives, financial situation or needs. We recommend investors obtain investment advice specific to their situation before making any financial investment decision.
|
|
#27
07-07-2017, 11:53
|
||||
|
||||
|
FxGrow Daily Technical Analysis 07th July, 2017
By FxGrow Research & Analysis Team Market Futures Technical Overview Ahead of Non-Farm Figure  Friday 7th July 2017, U.S is set to release major economic data. First, Unemployment Rate is doing far by good during the past years and it's highly expected to remain at 4.3% record. As for Average Hourly Earnings, last report booked 0.2% and expectations today are 0.3%. Any number between these two will be taken as a positive sign, but in case market was caught off guard with a lesser figure, this could be a game changer as Average Earnings, along with negative data released on June 4th. As a result, NFP will take center stage today and expectations are at 175K and above, in case of a lesser number, then the buck will receive another punch pushing the U.S Index lower which could come in Trump's economic outlook favor. SEP B-POUND Current Price: 13000 Target: 13092 Resistance: 13040+, 13092 Support: 12930, 12891* Trend Reversal Point: 1.2802 Trend: Upwards Summary: The market remains in a short term bull advance with potential to attack the 13092 May high. A surge over Monday's high should fuel rallies near 13092. Be prepared for additional near term corrections, but narrow sideways congestion within the upper edges of last Wednesday's run over 12891*+ will keep bull forces. A close under 12891* is needed to stop the upturn and foster a correction down along 12802*. SEP CANADIAN$ Currently: 77245 Target: None Resistance: 7750?, 8000 Support: 7688, 7661, 76435* Trend Reversal: 75.985 Trend: Up Comment The market is bullish. A close over 7727 could fuel aggressive rallies towards 8000. A reluctance to extend past Wednesday's high today will caution for near term corrections into next week. A close under 76435* warns for a correction phase back through last week's run. SEP EURO For more in depth Research & Analysis please visit FxGrow. Note: This analysis is intended to provide general information and does not constitute the provision of INVESTMENT ADVICE. Investors should, before acting on this information, consider the appropriateness of this information having regard to their personal objectives, financial situation or needs. We recommend investors obtain investment advice specific to their situation before making any financial investment decision.
|
|
#28
11-07-2017, 10:07
|
||||
|
||||
|
FxGrow Daily Technical Analysis 11th July, 2017
By FxGrow Research & Analysis Team EUR/USD In Search For Positive Fundamental To Press Forward  EUR/USD has entered the second consolidation session this week with 1.1381 low and 1.1418 high yesterday, so far the pair traded 18-pips today, with expectations to stay within yesterdays trading range. Currently the pair is trading 1.1395 intraday with daily RSI at 60 level and hourly RSI at 50 level, which gives EUR/USD the chance to score stingy pips aimed at 1.1420, 1.1445 resistance levels. On the other hand, the greenback remains bearish and Index failed to close above 96.54 for trend reversal, which keeps EUR/USD hanging above, ready to press forward. Fundamentally, the pair showed no reaction to today's and yesterday's positive EU data, which indicates that EUR/USD is in search for ... For more in depth Research & Analysis please visit FxGrow. Note: This analysis is intended to provide general information and does not constitute the provision of INVESTMENT ADVICE. Investors should, before acting on this information, consider the appropriateness of this information having regard to their personal objectives, financial situation or needs. We recommend investors obtain investment advice specific to their situation before making any financial investment decision.
|
|
#29
11-07-2017, 13:28
|
||||
|
||||
|
FxGrow Daily Technical Analysis 11th July, 2017
By FxGrow Research & Analysis Team AUD/USD Loses The Bullish Momentum, Favoring Sideways  AUD/USD failed to sustain the bullish momentum today as it f 0.7626 high, retreating low of 0.7605 during the European trading session. Currently the pair is trading at 0.7608 intraday just above its 100-EMA at 0.7605. Fundamentally, the National Australia Bank (NAB) Business Confidence Index was neutral recording 9 compared to 8 on previous sessions, but the negative Home Loans data added more pressure over the Aussie. Traders should be aware of the Chinese Trade balance, to be ... For more in depth Research & Analysis please visit FxGrow. Note: This analysis is intended to provide general information and does not constitute the provision of INVESTMENT ADVICE. Investors should, before acting on this information, consider the appropriateness of this information having regard to their personal objectives, financial situation or needs. We recommend investors obtain investment advice specific to their situation before making any financial investment decision.
|
|
#30
12-07-2017, 08:39
|
||||
|
||||
|
FxGrow Daily Technical Analysis 12th July, 2017
By FxGrow Research & Analysis Team GBP/USD Testing 50-EMA Ahead of Major Data  GBP/USD extended the selloff wave since yesterday with 113-pips value loss, landing in 1.2810 low for now. The pair tested daily 50-EMA at 1.2820 with failure and in case market closing below, signs of bearish momentum will persist. MPC member Broadbent crossed wires yesterday with a dovish stance hinting for many current obstacles facing UK economic outlook, being inconsistent with Carney's recent hawkish speech, hence a negative wave still evolves for the cable. Fundamentally, the pair awaits major inflation reports shortly with two possible scenarios. A negative data will add more ... For more in depth Research & Analysis please visit FxGrow. Note: This analysis is intended to provide general information and does not constitute the provision of INVESTMENT ADVICE. Investors should, before acting on this information, consider the appropriateness of this information having regard to their personal objectives, financial situation or needs. We recommend investors obtain investment advice specific to their situation before making any financial investment decision.
|
|
#31
12-07-2017, 13:41
|
||||
|
||||
|
FxGrow Daily Technical Analysis 12th July, 2017
By FxGrow Research & Analysis Team Crude Oil Inches Higher Over EIA Report, Awaiting U.S Inventories  Crude Oil managed to add $2.36 bp since Monday and clocked $45.99 bp high supported by the U.S. Energy Information Administration report on Tuesday as it expects U.S. crude oil production to rise by less than previously forecast next year due to a lower price outlook, but remaining at record. Also, reports by Reuters mentioned that Saudi Arabia is due to decrease their oil exports to the lowest record during August. On the other hand, other fundamentals such as Libya and Nigeria (Non-OPEC) extended their oil production output, keeps market overloaded (glut) and oil rising prices at slower pace. Add to that, Iran's oil output will rise to ... Yesterday, Qatar signed a contract with Total French Company to develop Shahine field with $3.5B and could see oil production at 300,000 bp day. For more in depth Research & Analysis please visit FxGrow. Note: This analysis is intended to provide general information and does not constitute the provision of INVESTMENT ADVICE. Investors should, before acting on this information, consider the appropriateness of this information having regard to their personal objectives, financial situation or needs. We recommend investors obtain investment advice specific to their situation before making any financial investment decision.
|
|
#32
12-07-2017, 13:50
|
||||
|
||||
|
FxGrow Daily Technical Analysis 12th July, 2017
By FxGrow Research & Analysis Team USD/CAD Trading On An Expired BOC's Decision, Eyes on Poloz  USD/CAD was on a heavy selloff wave ever since Gov. Poloz (June 28) hinted for a possible tapering with an increase by BOC interest rates by 0.25% to current 0.50%. Overall, the pair has lost 340-pips price action on Friday with 1.2859 low and daily RSI around 25 level, which indicates an oversold market with potential for correction phase in case USD/CAD wants to continue pressing downward. The pair started the correction phase since Monday with 1.2943 high yesterday, but current daily RSI is at 32 level which still indicates an oversold market. Today, expectations that BOC will deliver the rate ... For more in depth Research & Analysis please visit FxGrow. Note: This analysis is intended to provide general information and does not constitute the provision of INVESTMENT ADVICE. Investors should, before acting on this information, consider the appropriateness of this information having regard to their personal objectives, financial situation or needs. We recommend investors obtain investment advice specific to their situation before making any financial investment decision.
|
|
#33
13-07-2017, 05:52
|
||||
|
||||
|
FxGrow Daily Technical Analysis 13th July, 2017
By FxGrow Research & Analysis Team EUR/USD Surges Higher Ahead of Local CPI Data  EUR/USD inaugurated Asian trading sessions with +30-pips price action and clocked 1.1439 high as the greenback extends downtrend for today at 95.34 low. Yesterday, Yellen crossed and failed to give specifics as questions were addressed which left market confused and the DXY couldn't press forward and traded neutrally. Today, multi data on both EURO and USD which should shake the pair's movement, first German and French CPI shortly, followed on NY opening sessions with ... For more in depth Research & Analysis please visit FxGrow. Note: This analysis is intended to provide general information and does not constitute the provision of INVESTMENT ADVICE. Investors should, before acting on this information, consider the appropriateness of this information having regard to their personal objectives, financial situation or needs. We recommend investors obtain investment advice specific to their situation before making any financial investment decision.
|
|
#34
13-07-2017, 12:48
|
||||
|
||||
|
FxGrow Daily Technical Analysis 13th July, 2017
By FxGrow Research & Analysis Team Gold Remains Bearish Despite Recent Recovery, Eyes on U.S Data  Gold plunged aggressively on Monday at 1204.90 on Monday sending a strong message that further downside yet prevails, but managed to make a correction phase extended till Thursday before clocking a 1225.15 yesterday sending signs of a potential bullish reversing trend. Current phase for gold should be a correction phase that holds potential for an uptrend, but unless gold closes above 1228 by daily chart or at least 4 hours candle stick, market should be prepared for an another aggressive selloff wave extended towards 1195+, with potential for 1190+. Fundamentally, Yellen speech yesterday kept the U.S Index on high volatility which had its effect on Gold, and today, Yellen, along with U.S Data which will be released shortly will give a better outlook how market will react towards gold. In case gold broke closed closed below 1213, additional confirmation for further selloff waves, and in case gold failed to close above 1228, then trend will be sideways until further notice. For more in depth Research & Analysis please visit FxGrow. Note: This analysis is intended to provide general information and does not constitute the provision of INVESTMENT ADVICE. Investors should, before acting on this information, consider the appropriateness of this information having regard to their personal objectives, financial situation or needs. We recommend investors obtain investment advice specific to their situation before making any financial investment decision.
|
|
#35
17-07-2017, 08:37
|
||||
|
||||
|
FxGrow Daily Technical Analysis 17th July, 2017
By FxGrow Research & Analysis Team EUR/USD Pushes Higher As The Buck Reaches Lower, CPI Eyed EUR/USD bullish trend is sustained supported by U.S Negative released on Friday, with disappointing CPI as Yellen mentioned that any tapering with Rates and U.S Federal balance sheet will be subject to economic data (U.S Data on Friday). As a result, the pair rallied from 1.1391 low on Friday, extended weaker gains this week with a higher high by 5-pips and 1.1475 peak for today. Currently, the pair is trading 1.1448, awaiting vital data as EU releases Final CPI y/y. ECB will release a statement this Thursday along with Interest Rates decision which makes today's data articular. Draghi has mentioned for a potential change or increasing rates, if not, Quantitative Easing program edition which is currently attracting EUR/USD fever buyers, hence the pair dwelling high above. As for the buck, the U.S Index looks helpless with a yearly low at 94.83 for today. Fundamentals: 1- EUR - Findal CPI and Core CPI today at 9:00 AM GMT. Technical Overview: Trend: Up Target: 1.1580 Resistance levels: R1 1.1485+ , R2 1.1528, R3 1.1560+/- (D1) Support levels: S1 1.1459, S2 1.1440, S3 1.1391 (D1) Comment EUR Future: The market is bullish, still signalling for a run to 1.1580+. A pop over last week's reversal high will spark the extension to 1.1580. Be prepared for additional near term corrective action along 1.1450 to continue developing a staging level for rallies. Only a close under 1.1391* marks a near term peak and signals for retracement to attack 1.1308* for a larger downturn. Daily RSI is at 62 , Hourly RSI at 51, which gives the pair space to push higher than Friday's high. For more in depth Research & Analysis please visit FxGrow. Note: This analysis is intended to provide general information and does not constitute the provision of INVESTMENT ADVICE. Investors should, before acting on this information, consider the appropriateness of this information having regard to their personal objectives, financial situation or needs. We recommend investors obtain investment advice specific to their situation before making any financial investment decision.
|
|
#36
18-07-2017, 08:21
|
||||
|
||||
|
FxGrow Daily Technical Analysis 17th July, 2017
By FxGrow Research & Analysis Team EUR/USD Pushes Higher As The Buck Reaches Lower, CPI Eyed  EUR/USD bullish trend is sustained supported by U.S Negative released on Friday, with disappointing CPI as Yellen mentioned that any tapering with Rates and U.S Federal balance sheet will be subject to economic data (U.S Data on Friday). As a result, the pair rallied from 1.1391 low on Friday, extended weaker gains this week with a higher high by 5-pips and 1.1475 peak for today. Currently, the pair is trading 1.1448, awaiting vital data as EU releases Final CPI y/y. ECB will release a statement this Thursday along with Interest Rates decision which makes today's data articular. Draghi has mentioned for a potential change or increasing rates, if not, Quantitative Easing program edition which is currently attracting EUR/USD fever buyers, hence the pair dwelling high above. As for the buck, the U.S Index looks helpless with a yearly low at 94.83 for today. Fundamentals: 1- EUR - Findal CPI and Core CPI today at 9:00 AM GMT. Technical Overview: Trend: Up Target: 1.1580 Resistance levels: R1 1.1485+ , R2 1.1528, R3 1.1560+/- (D1) Support levels: S1 1.1459, S2 1.1440, S3 1.1391 (D1) Comment EUR Future: The market is bullish, still signalling for a run to 1.1580+. A pop over last week's reversal high will spark the extension to 1.1580. Be prepared for additional near term corrective action along 1.1450 to continue developing a staging level for rallies. Only a close under 1.1391* marks a near term peak and signals for retracement to attack 1.1308* for a larger downturn. Daily RSI is at 62 , Hourly RSI at 51, which gives the pair space to push higher than Friday's high. For more in depth Research & Analysis please visit FxGrow. Note: This analysis is intended to provide general information and does not constitute the provision of INVESTMENT ADVICE. Investors should, before acting on this information, consider the appropriateness of this information having regard to their personal objectives, financial situation or needs. We recommend investors obtain investment advice specific to their situation before making any financial investment decision.
|
|
#37
18-07-2017, 09:25
|
||||
|
||||
|
FxGrow Daily Technical Analysis 18th July, 2017
By FxGrow Research & Analysis Team Sterling Inches Higher Ahead of Multi Inflation Figures  GBP/USD extended the bullish momentum today after a remarkable home-run on Friday with 1.3113 2017 news-highs. Yesterday, the pair made a correction plunging to 1.3046, resting daily RSI to 60 level, then rewarded losses clocking 1.3099 high ahead of major inflation data to be released today which could fuel GBP/USD for a newer high record in case of a positive UK CPI associated with previous hawkish speech by Carney, head of BOE. Add to that, U.S Dollar continues digging lower with 94.49 2017 fresh-low. Expectations of further tumbling for the U.S Index in the coming days as Reuters reported a setback yesterday for health care program and a major conflict among Republicans regarding the system. UK Data, after a release, will be followed by Gov. Carney in the afternoon with expectation for a hawkish tone supporting Sterling sharp tone facing pace buck, but still UK CPI will set the tone for Carney. Analysts at Nomura Securities - the global financial services giant - say the Bank of England will raise interest rates by ... For more in depth Research & Analysis please visit FxGrow. Note: This analysis is intended to provide general information and does not constitute the provision of INVESTMENT ADVICE. Investors should, before acting on this information, consider the appropriateness of this information having regard to their personal objectives, financial situation or needs. We recommend investors obtain investment advice specific to their situation before making any financial investment decision.
|
|
#38
19-07-2017, 10:34
|
||||
|
||||
|
FxGrow Daily Technical Analysis 19th July, 2017
By FxGrow Research & Analysis Team FxGrow: Forex Market Technical Overview EUR/USD: Potential For 1.1585 high Pivot: 1.1510 Our preference: long positions above 1.1510 with targets at 1.1565 & 1.1585 in extension. Alternative scenario: below 1.1510 look for further downside with 1.1485 & 1.1470 as targets. Comment: even though a continuation of the consolidation cannot be ruled out, its extent should be limited. GBP/USD Remains Under Pressure By Yesterday's Negative CPI Pivot: 1.3060 Our preference: short positions below 1.3060 with targets at 1.3000 & 1.2950 in extension. Alternative scenario: above 1.3060 look for further upside with 1.3085 & 1.3115 as targets. Comment: the RSI is mixed to bearish. USD/JPY Intraday: key resistance at 112.40 Pivot: 112.40 Our preference: short positions below 112.40 with targets at 111.75 & 111.50 in extension. Alternative scenario: above 112.40 look for further upside with 112.85 & 113.15 as targets. Comment: the RSI is mixed to bearish. AUD/USD: The Upside Prevails With 2017 New Highs Pivot: 0.7865 Our preference: long positions above 0.7865 with targets at 0.7950 & 0.7990 in extension. Alternative scenario: below 0.7865 look for further downside with 0.7835 & 0.7785 as targets. Comment: the RSI is mixed to bullish. Gold Extends Bullish Momentum Supported by Rising Trendline Pivot: 1238.00 Our preference: long positions above 1238.00 with targets at 1247.00 & 1250.00 in extension. Alternative scenario: below 1238.00 look for further downside with 1232.50 & 1227.00 as targets. Comment: even though a continuation of the consolidation cannot be ruled out, its extent should be limited. For more in depth Research & Analysis please visit FxGrow. Note: This analysis is intended to provide general information and does not constitute the provision of INVESTMENT ADVICE. Investors should, before acting on this information, consider the appropriateness of this information having regard to their personal objectives, financial situation or needs. We recommend investors obtain investment advice specific to their situation before making any financial investment decision.
|
|
#39
19-07-2017, 11:13
|
||||
|
||||
|
FxGrow Daily Technical Analysis 19th July, 2017
By FxGrow Research & Analysis Team Global Glut Output Still Pressure Oil Levels Despite OPEC Efforts, Eyes on U.S Inventories  Crude Oil still fails to close above $47 level, developing a habit with a sharp slip as a phobia. Through out July, crude oil was seen flirting with $47.00+, and yesterday, oil peaked to $47.12, giving potential for further advance, then failed to guard gains and closed at $46.41. Currently oil is trading at 50-EMA level at $46.46 intraday, and in case market closes above it, we could see some further gains in the coming days. Fundamentally, market is still receiving mix signals between OPEC pledging for further actions to curb global output and U.S increasing inventories that was reported yesterday. Libya and Nigeria has exceeded previous June levels with a report showing that both countries recorded a 3M bpd yesterday. Saudi Arabia, along with other OPEC countries still ... For more in depth Research & Analysis please visit FxGrow. Note: This analysis is intended to provide general information and does not constitute the provision of INVESTMENT ADVICE. Investors should, before acting on this information, consider the appropriateness of this information having regard to their personal objectives, financial situation or needs. We recommend investors obtain investment advice specific to their situation before making any financial investment decision.
|
|
#40
19-07-2017, 13:59
|
||||
|
||||
|
FxGrow Daily Technical Analysis 19th July, 2017
By FxGrow Research & Analysis Team Aussie: Chances For Further Gains Ahead of Unemployment Rate  Australian Dollar extended the intensive inclines, searching for newer highs as AUD/USD clocks multi years 0.7947 today. The pair uptrend found support by recent hawish RBA statement, positive Chinese GDP on Monday opening session, and continuous collapsing U.S Dollar as the Index with 94.26 low yesterday. The pair awaits vital data as Australia releases Unemployment Rate on Tuesday opening session. Expectations are at ... For more in depth Research & Analysis please visit FxGrow. Note: This analysis is intended to provide general information and does not constitute the provision of INVESTMENT ADVICE. Investors should, before acting on this information, consider the appropriateness of this information having regard to their personal objectives, financial situation or needs. We recommend investors obtain investment advice specific to their situation before making any financial investment decision.
|
|
|
|
 Similar Threads
|
||||
| Thread | Thread Starter | Forum | Replies | Last Post |
| Daily Market Analysis by FxGrow | FxGrow10 | Forex Analysis | 0 | 14-05-2015 14:03 |
| Daily Market Analysis by FxGrow | FxGrow10 | Forex Analysis | 0 | 06-05-2015 01:03 |
| Daily Market Analysis by FxGrow | FxGrow10 | Forex Analysis | 0 | 04-05-2015 17:05 |
| Market analysis by Forex4you (updated daily) | Trevor | Forex Analysis | 57 | 17-07-2012 14:48 |
| FXopen Market Analysis (Update Daily) | dantebreath | Forex Analysis | 4 | 13-06-2012 09:48 |


