Forex Forums | ForexLasers.com |
|
|||||||
 |
|
|
LinkBack | Thread Tools | Search this Thread |
|
#1
 28-02-2012, 12:20
|
|||
|
|||
|
EUR/USD: C wave unfolding
The EUR/USD pair is consolidating. On the hourly chart there looks like an incomplete A-B-C correction with leg C down about to unfold, and 1.3345 as its downside target. Eventually I see the recent rally recovering and continuing, however, and rising to the upper channel line of the move at 1.3550, as previuosly predicted. AUD/USD: @ range highs The aussie has reached the highs of the consolidation range in which it is still bound. RSI has given a sell signal and it is possible it could fall back down now to the range lows at 1.0660. However, there is also a chance it may still have a little higher to go, perhaps up to the 1.0800 level before being resisted. There is no indication of which direction the consolidation will break out from eventually although given the overall trend is up so there is more chance of it breaking higher. GBP/USD: technical analysis The price fell below 1.5850/40 support, but then retraced back up, so it currently resides at 1.5850/60 level. Indicators are unclear, suggesting further range consolidation between 1.5900-1.5820 levels. If the range's resistance is breached, we'll be anticipating growth to 1.5950/40. Decline below support will indicate a soon test at 1.5760/50 level. 1.5750/40 level breakout will be a sign of a possible short-term change of sentiment. Analysis prepared by: Joaquin Monfort and Arkady Nagiev Forex4you analysts Disclaimer: Trading Futures and Options on Futures and Cash Forex transactions involves substantial risk of loss and may not be suitable for all investors. You should carefully consider whether trading is suitable for you in light of your circumstances, knowledge, and financial resources. You may lose all or more of your initial investment. Opinions, market data, and recommendations are subject to change at any time. 
|
|
#2
01-03-2012, 14:42
|
|||
|
|||
|
EUR/USD: technical analysis
Wednesday's strong move down has reached solid support from the R1 monthly pivot. Whilst it is possible that the sideways move will continue (between 1.3315 and 1.3355) there is a strong possibility the move down has further to go. One way of determining how far might be to use the double top pattern at the highs as a measuring stick. By extending this down we get a target of 1.3240, which is also at the level of a past consolidation zone and would be expected to provide additional support. AUD/USD: downside favoured After reaching new half-yearly highs the aussie posted a key reversal on Wednesday and has started falling. From slightly above the highs of the consolidation range it has been oscillating in it will probably fall back down to the range lows at 1.0660, where the 200 4-hr MA is also situated. After that there is an argument for a bullish recovery as an elliot 5th wave higher has yet to unfold - but the key reversal has weakened the case for further strength. GBP/USD: technical analysis The pair continued to ascend, but was held back by a strong resistance at 1.6000 level and pulled back down to 1.5900. Having reached 1.5900 support, the price now resides at 1.5940/40 level. Indicators suggest uncertainty in the market, which can be a sign of further consolidation between 1.6000 and 1.5900 levels. Market sentiment should change as soon as the price breeches 1.5900 support and retraces to level 1.5820/00. The trend will change only if trading breaches level 1.5750/40. Growth above 1.6000 level is possible, but rather challenging due to the cluster of strong resistance levels. Yet, if the price ascends, the next strong barrier will be found at 1.6090 resistance. USD/JPY: technical analysis The price failed to breach 80.00/10 support, so it stayed within the range above this level. At the moment trading is carried out at 81.00/10 level. Indicators seem to be turning back to "bullish". However, as long as the price remains below the previous maximum at 81.60/70, further correction with a possibility of another decline to even lower levels - 79.90/60, 79.00, looks to be a high probability. Medium-term bullish trend is still dominating, growth may continue up to 82.20/30 and then to 83.90/84.00 level. Analysis prepared by: Joaquin Monfort and Arkady Nagiev Forex4you analysts Disclaimer: Trading Futures and Options on Futures and Cash Forex transactions involves substantial risk of loss and may not be suitable for all investors. You should carefully consider whether trading is suitable for you in light of your circumstances, knowledge, and financial resources. You may lose all or more of your initial investment. Opinions, market data, and recommendations are subject to change at any time.
|
|
#3
05-03-2012, 13:34
|
|||
|
|||
|
EUR/USD: technical analysis
The EUR/USD has fallen to the trend-line of the whole rally from January. It will probably bounce from here to possibly the 100-day MA at 1.3290, although the 2-bar reversal on the weekly chart is a strongly bearish indication and therefore the bounce could be limited to only 1.3240 before the downturn resumes, and possibly breaks down through the trend-line with the first target at the weekly and monthly pivots clustered at 1.3050. AUD/USD: technical analysis The aussie continues to consolidate within a range. It is currently falling from the highs to the 1.0670s. The 2-bar reversal pattern on the daily chart is a strongly bearish signal and could indicate a possible continuation lower to the 1.0640 lows, or even the 1.0590 level if a stronger bear move unfolds. After that (or possibly even sooner) there may be a recovery as Elliot wave 5 of the move up from last November begins. GBP/USD: technical analysis The market preferred the "bearish" scenario - trading breached 1.5900 support and the price not only fell to the above mentioned 1.5820/00 support, but managed to breach it, so it's currently falling down to 1.5750/60 target, which merged with the uptrend (red) line. Trading is carried out at 1.5790/1.5800 level. Indicators are "bearish", suggesting further decline and 1.5760/50 level test anytime soon. 1.5760/50 level won't be the last barrier for the trend. The price will most likely continue to descend. The next strong support will be found at 1.5660/50 levels. Growth above 1.5900 resistance will indicate the change of sentiment to the "bullish". Analysis prepared by: Joaquin Monfort and Arkady Nagiev Forex4you analysts
|
|
#4
07-03-2012, 13:46
|
|||
|
|||
|
EUR/USD: rebound possible
The euro-dollar is currently correcting the recent decline. It has almost reached a band of resistance at the 1.3170 level where it might reverse and a move back down to the range lows at 1.3105. Some consolidation with more corrective rallies is forecast thereafter - and possibly even a move up to 1.3200. Eventually, however, the pair will probably resume the down-trend given the recent breakdown from out of its bullish channel, and the support at 1.3050 provides an initial downside target for such a move. AUD/USD: technical analysis The aussie has fallen and broken through the trend-line of the 2012 rally, and through the S1 monthly pivot at 1.0582. Whilst it has bounced back up today, a resumption of the down-trend is probable, with a fall to 1.0380 targeted first. There is also a chance the pair could make a rally back up into the channel and to the old 1.0800 highs, in a final Elliot wave 5 of the move. GBP/USD: technical analysis Earlier forecasts confirmed - the price dropped to 1.5760/50 target, declined further down to the next target at 1.5660/50 level, but failed to reach it and commenced a correction. Trading is currently carried out at 1.5740/30 level. Indicators are still turned up, suggesting "bearish" dominating sentiment. Downtrend is likely to recommence and the price will probably test 1.5660/50 support. Until then, sideways trading within 1.5760/70 1.5700 range is expected. Growth above 1.5900 resistance will indicate a reversal towards the "bullish" trend. Analysis prepared by: Joaquin Monfort and Arkady Nagiev Forex4you analysts
|
|
#5
08-03-2012, 15:15
|
|||
|
|||
|
EUR/USD: wave 5 falling
EUR/USD has bounced quite strongly and risen to the 1.32s. The move is typical of sharp counter-trend rallies in bear markets and it is probably an Elliot 4th wave. After reaching resistance at 1.3230 from old highs it has started to fall and it will probably continue until it reaches support at 1.3165, then afterwards probably also all the way to the lows at 1.3100, if wave 5 unfolds as expected. If there is a further spurt higher then gains might be severely capped by resistance from the pivots clustered at 1.3250/60. USD/CHF: rebound anticipated The swissie has broken out of its bullish price channel and sold off steeply. It has now fallen to key support at 0.9100 from both Fibonacci and moving averages as well as the monthly pivot not far beneath at 0.9091. Indicators look a little overstretched to the downside and there is a chance we might see a rebound from here. Eventually there will probably be a rally back up to match the 0.9200 highs as a final 5th Elliot wave completes the upwards pattern. EUR/JPY: resumption of uptrend The A-B-C correction of the up-trend found support at the 105.70 lows and then rebounded. The new move up is probably an Elliot 5th wave of the rally off the January lows and will probably continue to at least the level of the previous (wave 3) highs at 109.95. Analysis prepared by: Joaquin Monfort and Arkady Nagiev Forex4you analysts
|
|
#6
09-03-2012, 14:43
|
|||
|
|||
|
EUR/USD: wave 5 descending
Euro-dollar has reversed its trend and started moving back down. The current bearish move is probably the Elliot 5th wave of the move down from the February highs and I would expect it to continue to the former lows at 1.3100. It has already reached the lower channel line of the rally since January and will probably bounce, possibly to 1.3240, before resuming the down-trend. Eventually, however, I would expect it to break through the channel and re-touch the lows at 1.31. AUD/USD: possible break down The bear move after the key reversal posted at the late February highs appears incomplete. There was a sharp rebound from the recent lows, which was probably an Elliot 4th wave, leaving wave 5 down still to come. When it does, it will probably re-touch the 1.0510 lows. There is a trend-line propping up the exchange rate at around 1.0610 but this should give way in time and allow the pattern to complete. GBP/USD: technical analysis 1.5820/30 resistance held back the "bulls" from further growth. The price pulled back down and now resides at 1.5760/50 level. Such picture confirms earlier analysis, anticipating a correction within a downtrend. Indicators are "bearish" again, so its worth considering another decline, deeper, to even lower minimums than 1.5660/50 support, which gives reasons to expect a medium-term downtrend. In this case the price has all chanced to fall down to 1.5400/30 or even 1.5270/50 level. Analysis prepared by: Joaquin Monfort and Arkady Nagiev Forex4you analysts
|
|
#7
12-03-2012, 16:03
|
|||
|
|||
|
EUR/USD: posible rebound
Euro-dollar fell to 1.3100 in an Elliot 5th wave of the move which started at the end of February, as predicted. A 4th wave correction of the that final 5th appears to be unfolding currently. Once complete it is possible another wave lower the very final 5th may once again re-touch the 1.3080 lows, however, equally possible would be that the last 5th is shorter than usual and is followed by a rapid corrective rebound, correcting the whole formation, and carrying perhaps to 1.3170 and then 1.3220. GBP/USD: technical analysis The price reached 1.5660/50 support, mentioned earlier as initial target for decline. Having tested this level, the price pulled back up and now resides at 1.5400/30, 1.5270/50. On the other hand, 1.5650/40 support is a strong barrier, so it's worth considering a possible correction sideways and then another decline. Growth higher and 1.5810/20 resistance breakout will be a signal for a medium-term reversal up. USD/JPY: technical analysis Earlier forecasts, expecting a possible decline, confirmed. Trades fell towards 80.50/60 support, but failed to reach 80.20/00 79.80 range. The price recommenced its growth and reached a new local maximum at 82.60/65 level. Trading is currently carried out at 82.30/40 level. MACD divergence creates doubts that the "bullish" potential is strong enough, so it's worth considering another possible pullback down as well. However, the price has all chances to test 83.00 level and then a new decline. 81.80/90 and 80.50/60 levels and then 80.20/00 79.80 range are likely to become supports when the price will be correcting. USD/CHF: meeting resistance The final Elliot 5th wave higher materialised on Friday and has brought prices back up to the 0.9200s, where it is now close to completing. There is resistance from the 50 and the 100-day MA's which is also putting downwards pressure on prices. It is possible there could be one final wave higher re-touching the 0.9217 highs before a correction begin which pulls prices back down to the 0.9140s first and then perhaps the 0.9100s. EUR/JPY: wave 5 rising The EUR/JPY pair has risen in an Elliot 5th wave back up to the 107s after the A-B-C correction finished and reversed. There is the possibility of a rise all the way up to match the 109.95 highs, however, the more recent 108.65 highs provide a more easily achievable target, followed by the level of the R1 weekly pivot at 109.35. Analysis prepared by: Joaquin Monfort and Arkady Nagiev Forex4you analysts
|
|
#8
13-03-2012, 13:26
|
|||
|
|||
|
EUR/USD: technical analysis
Today's sell-off is probably the final wave down (Elliot 5th of 5th) of the move which began at the end of February. It will probably match the 1.3078 lows and will probably be followed by a sharp bounce higher as the correction of the February move unfolds, with an initial target back up to 1.3175 perhaps even 1.3200 or higher. After that, however, there is a strong possibility the overall bearish trend will resume and a new wave formation lower begin. AUD/USD: technical analysis The aussie has broken down out of its ascending channel and made lows at 1.0480. There has been a rebound and then weakness again and it is possible there may be a final move down as the current series of waves completes its formation. After that there will probably be a rebound, however, a stronger correction back up to possibly air-kiss the underside of the channel at around 1.0605 before the descent resumes. Given the bearish indications of the channel breakout earlier there is substantial downside potential perhaps all the way to the 1.0200s. GBP/USD: technical analysis Forecasts confirmed - the price recommenced its decline and breached 1.5660/50 support, and met support at 1.5600/05 level. At the moment it's testing earlier breached level as a resistance. Indicators are turned down, but the readings are weakening, which indicates further possible correction sideways within 1.5660/70 1.5600 range. Consolidation range may be extended higher, to 1.5690/1.5700. At the same time, the price has all chances to reach earlier mentioned targets at 1.5400/30, 1.5270/50, since the "bearish" trend looks to be dominating and further decline is expected. If trading climbs above 1.5830/20 resistance, "bearish" scenario will be cancelled. Analysis prepared by: Joaquin Monfort and Arkady Nagiev Forex4you analysts
|
|
#9
15-03-2012, 14:59
|
|||
|
|||
|
EUR/USD: rebound possible
The possibility of a short-term base forming and a reversal higher cannot be discounted. There may be a final exhaustive move lower to 1.3000 first but then I see signs of bottom forming and a rally back up to the trend-line for the move down at around 1.3130. After that the longer-term picture is still bearish with a 2-bar reversal on the weekly and a strong possibility of a move back down for a re-touch of the 1.26 lows. GBP/USD: technical analysis 1.5730/40 resistance held back further correction, so the price recommenced a decline and now resides at 1.5640/50. Sideways consolidation is obviously taking place within wide range. Indicators are bearish, suggesting another decline within a medium-term downtrend. 1.5600/10 support breakout will open the way down to 1.5400/30, 1.5270/50 targets, mentioned earlier. Growth above 1.5830 will cancel bearish sentiment. AUD/USD: technical analysis The price declined, tested 1.0440/20 support and is now pulling back up. Trading is carried out at 1.0490/1.0500. Indicators together with MACD divergence suggest a large-scale pullback up too, so its worth considering growth towards 1.0550 resistance, which, if breached, may trigger another ascension to 1.0650 level. However, bearish trend is still dominating. Growth above 1.0720 will be a sign of changing market sentiment. USD/JPY: pull-back expected The dollar-yen pair has rallied strongly during the last 6-weeks but there are indications it may be due for a correction. The daily TD Countdown for the pair reached 13 on Tuesday and momentum is overbought, both signalling exhaustion of the trend. There is sturdy support at the 82.20 from both the R1 monthly and the weekly pivot and if the correction is a shallow then it is possible it will resume rallying from there. However it is also possible the exchange rate may roll over and move underneath the pivots, with the next target at 82.00. This pull-back may present an exceptional buying opportunity for investors who missed the initial thrust, as the longer term outlook has turned bullish. Analysis prepared by: Joaquin Monfort and Arkady Nagiev Forex4you analysts
|
|
#10
19-03-2012, 13:08
|
|||
|
|||
|
EUR/USD: technical analysis
There has been a correction of the dominant down-trend with a strong spike higher to the 1.3180 level. Although the move higher could continue and reach support and resistance at 1.3240 my preference is for a resumption of the slide down, with a move down targeting the support from both trend-line and pivot at 1.3120/5. USD/JPY: technical analysis Earlier forecasts, expecting further growth up to 83.90/95/84.00 price range and then a possible pullback, confirmed. The price was halted by a strong barrier at 84.00/20 level and pulled back to 83.00 level, mentioned earlier as the first support for correction. The price is currently testing 83.00 level. Indicators suggest to expect further decline, most likely to 82.50/60 level in the near future. If, however, this support is breached, the price will most likely correct and fall to 80.60 or even to 79.90/80 level. Should, on the other hand, growth from the current or 82.60/50 level recommence, correction will be formed within 84.00 - 82.60/50 range. In this case ascension to a new local high anytime soon will become possible. GBP/USD: technical analysis Forecasts confirmed and trading climbed above 1.5830 level. At the moment we observe another "bullish" attempt to hold above this resistance. The price resides at 1.5840/50 levels, which can be considered as a sign of a possible change of sentiment in the market. Indicators are turning up, saying in favor of this forecast. All eyes now turn at 1.5910/20 resistance level - if the price successfully breaches this barrier and retraces back to the uptrend channel (red lines) sector, market sentiment will turn "bullish" and the price will most likely ascend to 1.5990/1.6000 level. Failure to breach this barrier will push the price back down and give reasons to expect the "bearish" trend to recommence. Analysis prepared by: Joaquin Monfort and Arkady Nagiev Forex4you analysts
|
|
#11
20-03-2012, 14:51
|
|||
|
|||
|
AUD/USD: breaking down
The aussie has begun a strong move down, which has reached a tough support level made up of both the weekly and monthly S1 pivots and from there it has bounced a little. This could be the beginning of a whole new cycle down after the 5 waves off the end of Feb highs (which also posted a key reversal) completed as well as an ABC correction, which finished yesterday. There is a chance of a bounce first, however, with 1.0530 as a possible target or even the resistance highs at 1.0555, following that, however, I see the aussie resuming the trend down with support and resistance levels at 1.0380 providing the next target. GBP/USD: technical analysis Forecasts confirmed - the price tested 1.5910/20 level, which turned out to be a strong resistance and pushed the price back down. Having tested 1.5840/30 support, trading is currently carried out at 1.5860/70 level. Indicators are now less bullish, which gives reasons to anticipate a possible correction to growth or, on the other hand, it may indicate a reversal down. Previous analysis remains relevant - 1.5910/20 level breakout and reversal to the uptrend channel sector (red lines) will be a sign of strong bullish sentiment and give reasons to anticipate further growth to 1.5990/1.6000. If current correction goes down below 1.5750/40 level, it'll be a sign of recommenced bearish trend and further decline to 1.5430, 1.5270 targets. USD/CHF: technical analysis The swissie has been falling in a lovely channel down from the highs reached on Thursday last (15th March). It could now be about to mount a larger corrective pattern back. It has breached the upper channel line and I now see it probably rising and fulfilling the breakout objective at 0.9165, possibly even reaching 0.9215 the 50% retracement level. After that, however, it will probably descend again and retouch the 0.9091 lows as the conclusive wave unfolds lower. USD/JPY: rising 3 methods A rising three methods bullish continuation candlestick pattern on the daily chart could mark the end of the correction and the beginning of a new cycle higher. Ideally a break of the 83.83 highs would be a good signal to go long. How much higher is it likely to go? The next stop higher could be at around 85.15: as strong resistance there rebuffed previous price action in April 2011 and there is also the monthly R1 and weekly R2 pivots on the same level. EUR/USD: technical analysis "Bulls" failed to reach 1.3290/80 level - the price was held back by 1.3270/65 resistance and pulled back to level 1.3220/30, where it still resides. Indicators suggest further growth, but the readings seem to be weakening. Earlier breached uptrend (red) line around 1.3290/1.3300 level is likely to be tested anytime soon. To anticipate a medium-term uptrend this resistance has to be breached and the price should hold above. In this case we'll be expecting growth to 1.3380 and then to 1.3490/1.3500 levels. Before 1.3290 level breakout trading has all chances to recommence its decline. Should the price fall below 1.3100 level, the bearish trend with the first targets at 1.2970/60 and 1.2870/80 (new local minimums) will commence. Analysis prepared by: Joaquin Monfort and Arkady Nagiev Forex4you analysts
|
|
#12
22-03-2012, 13:46
|
|||
|
|||
|
USD/JPY: correction deepening
The dollar-yen pair has pulled back after a 6-week rally following a TD Countdown 13 signal, normally a reliable indication of exhaustion. I expect a fairly significant correction form the current highs. The initial retracement after the TD Countdown was shallow and actually set up a contrary rising 3-methods candlestick continuation pattern which I flagged up in my commentary sorry about that everyone! The correction seems now to have resumed with support at 82.00 as the next target down. GBP/USD: technical analysis Forecasts, expecting further sideways consolidation in this pair, confirmed. At the moment, however, the price is attempting to breach the range's support - trading is carried out at 1.5800/1.5790 level. Indicators are turning abruptly down, but to actually recommence their trend, the "bears" will have to breach 1.5750/40 level. Should they succeed, new targets will be found at 1.5430, 1.5270 levels. Until then, "bullish" trend should be still considered dominating. Growth to new local maximums should be expected if the price breaches 1.5910/20 resistance and retraces back to the uptrend channel (red) line. GBP/USD: technical analysis Forecasts, expecting further sideways consolidation in this pair, confirmed. At the moment, however, the price is attempting to breach the range's support - trading is carried out at 1.5800/1.5790 level. Indicators are turning abruptly down, but to actually recommence their trend, the "bears" will have to breach 1.5750/40 level. Should they succeed, new targets will be found at 1.5430, 1.5270 levels. Until then, "bullish" trend should be still considered dominating. Growth to new local maximums should be expected if the price breaches 1.5910/20 resistance and retraces back to the uptrend channel (red) line. AUD/USD: technical analysis Previous analysis confirmed - the price keeps on moving down and it has already breached the first barrier on the way down - level 1.0440 and declined further down to the next support at 1.0360/50 level, also mentioned earlier. Indicators are "bearish", which gives reasons to anticipate dissension to 1.0220 target. Growth above 1.0720 level, followed by 1.0630/50 resistance breakout will indicate a possible reversal up in a medium-term. USD/CHF: meeting resistance The swissie has reached the upper channel line of its recent rally at 0.9160 and has stopped to consolidate. Given that it has also fulfilled the target from the recent breakout of the down-channel it now seems possible that it will fall back, perhaps, to the bottom at 0.9100, especially as the trend on the daily chart remains very much negative. The strength of the recent spike higher could also indicate a continuation although this is not my preference and its worth mentioning that an upside break to the 0.9230s is also a possibility. Analysis prepared by: Joaquin Monfort and Arkady Nagiev Forex4you analysts
|
|
#13
23-03-2012, 15:46
|
|||
|
|||
|
EUR/USD: technical analysis
This pair has rallied up to a resistance zone composed of previous highs and has started correcting. It will probably fall back down to support at the bottom of the range at 1.3175 at first and then possibly 1.3010. The bigger picture is still bearish overall as there is a large H&S pattern at the highs, however, the recent spike higher was strong and another breakout move could bring the exchange rate up to 1.3400 where the down-sloping channel on the daily chart is located, although after that it will probably resume its descent. GBP/USD: technical analysis "Bearish" decline halted at 1.5770/60 support, which triggered a pullback up. The price now resides at 1.5910/00 resistance, mentioned earlier as the key barrier for the uptrend. To recommence their trend and rise towards new local maximums the "bulls" will have to breach 1.5940/1.5910 resistance range. Indicators are uncertain, so the "bulls" may fail and the price has all chances to recommence a decline, if it sucessfully breaches level 1.5750/40. If confirms, trading will move further towards 1.5430, 1.5270 targets. USD/JPY: technical analysis Forecasts confirmed and the price continued to move sideways within 84.00 - 82.60/50 range . Attempt to breach the range's support failed - having reached level 82.40/35, the price retraced back up and now resides around 82.60/70 levels. Indicators are bearish, suggesting further decline. 82.50/60 support breakout will indicate a deeper correction, probably to 80.60 or even 79.90/80 level. Before the price holds below 82.50 level, "bullish" sentiment prevails. If the uptrend recommences, the next target will be found at 84.80/90- 85.00 level. AUD/USD: bounce possible The aussie has broken down out of its channel and reached a target at 1.0300. It is also being supported at that level by the 200 and 100-day MA's. There is a chance it could bounce from there as momentum is also showing bullish convergence and 5 waves down appear to have completed. If there is a bounce, there may well be a rebound to a band of resistance at around the 1.0555 level. Before the rebound there is also the chance of a final move lower to the 1.0310 region. Analysis prepared by: Joaquin Monfort and Arkady Nagiev Forex4you analysts
|
|
#14
26-03-2012, 12:34
|
|||
|
|||
|
EUR/USD
EUR/USD is breaking down after retouching the range highs. There is a substantial clustering of support at the 1.3170 level and it is possible it could stall and bounce from this level back up to the 1.3300 ceiling. Alternatively, a downside break of support at 1.3170 could lead to a sell-off all the way to the range lows at 1.3015. GBP/USD Forecasts confirmed - 1.5910 resistance held back further "bullish" growth, like expected. Having tested this barrier on the way up, the price pulled back down, so it now resides at 1.5810/20 level. Indicators seem to be changing their direction, which gives reasons to anticipate further possible decline to 1.5690 level, which currently coincides with the secondary trend line (blue dashed line). If this barrier on the way down is breached, the price will most likely proceed to 1.5430, 1.5270 targets. Before it breaches 1.5760 support, "bullish" chances to recommence growth are still high. Reversal to the uptrend channel sector (red lines) will indicate renewed uptrend. EUR/JPY: downside possible The correction from the March 21 highs is probably an A-B-C pattern which has further to go. Wave B is currently unfolding and I would expect it to end soon even though there are no signs of weakness yet. Then wave C may begin down. The target for the end of C is 106.90, which also happens to be at the level of the trend-line from the Jan lows and at the 200-day and 4-hr moving averages. A more conservative target might be at the weekly pivot at 108.05. Analysis prepared by: Joaquin Monfort and Arkady Nagiev Forex4you analysts
|
|
#15
27-03-2012, 11:47
|
|||
|
|||
|
USD/JPY
The price keeps on its attempts to breach 82.50/60 support. It has only managed to pierce it so far and then retraced towards 83.00 - 82.60/50 price range. Indicators are currently neutral, suggesting uncertainty in the market, which gives reasons to anticipate further sideways movement and then correction to growth with a possible decline to 80.60 or even to 79.90/80 level. However, medium-term "bullish" trend is still dominating. Should it recommence, the next target will be found at 84.80/90- 85.00 level. GBP/USD The "bulls" confirmed their strong potential and resumed growth from 1.5800support. The price has recently ascended towards the breached uptrend channel (red) line and is now testing it again. Trading is carried out at 1.5990/80 level. Earlier forecasts expected a medium term "bullish" trend to recommence if the price retraces back to the uptrend channel sector. So, if current attempts turn out successful, the price will most likely ascend towards 1.6090/1.6100 resistance levels. Indicators are turned up, so the price may succeed. At the same time, level 1.6000 looks to be a strong barrier on the way up, so it's worth considering a possible pullback down too. Decline below 1.5910/00 support will turn market sentiment "bearish" and the price will most likely plunge to 1.5760 level. EUR/USD The EUR/USD pair has just backed-up into resistance from the trend-line running up from the January lows. It has started to fall from here and will probably continue until support from previous highs located at 1.3280. However from an upside perspective there is also a chance of the move higher unfolding a little further to 1.3405, nevertheless my preference is for more downside. AUD/USD The aussie has rallied up to the 1.0500s but it has reached resistance at that level from the down-sloping trend-line from the highs and has formed a small bearish head and shoulders pattern. It will probably correct back from its current level to support from the trend-line of the up-move at 1.0475, with the possibility of a move down to 1.0425 developing thereafter. An alternative, though less likely scenario is the continuation of the up-move to resistance at the 1.0600 – and then 1.0725 level thereafter. Analysis prepared by: Joaquin Monfort and Arkady Nagiev Forex4you analysts
|
|
#16
28-03-2012, 14:10
|
|||
|
|||
|
USD/CHF
The swissie has continued falling as expected but has found substantial support at its current lows at 0.9015. There is a possibility it could continue to move even lower and reach 0.8940, the original target for the move off the March 15 highs, for the legs of the move to achieve equality. However, the current bullish correction looks like it could also be a basing pattern, which may break higher, with an upside target of 0.9085, at an old level of resistance.  AUD/USD 1.0360/50 support turned out to be a strong barrier and triggered a pullback up. The price tested a downtrend channel (blue) line and is now descending. Trading is currently carried out at 1.0410/20 level. Indicators seem to be weakening, most of them, however, still suggest a downtrend as a higher possibility. Earlier forecasts, expecting the next target to be found at 1.0220 support, have all chances to confirm, if the price breaches level 1.0360/50, which it's currently approaching. Growth above 1.0630/50 level and 1.0540/30 resistance breakout will, on the other hand, indicate a reversal up in a medium-term.  GBP/USD Level 1.6000 turned out to be a strong resistance. The price pulled back down and is now testing 1.5900/10 support. Indicators are turning down, MACD divergence is forming, suggesting further decline. If confirms and the price breaches 1.5910/00 support and holds below, the next target will be found at 1.5760 support. If, on the other hand, the price fails to breach level 1.5910/00, trading will begin to move sideways, within 1.6000 1.5900/10 range.  EUR/USD The EUR/USD pair is trading in a sideways range with a correction down within that range currently underway. This move may continue to the range lows at the 1.3315 support and resistance level. From there, there could be a bounce or a break down as the double top pattern translates into a reversal. If the current rally continues then a retouch of the 1.3380 highs is also possible.  Analysis prepared by: Joaquin Monfort and Arkady Nagiev Forex4you analysts Disclaimer: Trading Futures and Options on Futures and Cash Forex transactions involves substantial risk of loss and may not be suitable for all investors. You should carefully consider whether trading is suitable for you in light of your circumstances, knowledge, and financial resources. You may lose all or more of your initial investment. Opinions, market data, and recommendations are subject to change at any time.
|
|
#17
29-03-2012, 12:35
|
|||
|
|||
|
USD/JPY
83.40/00 resistance prevented the price from retracing towards the uptrend channel (blue-dashed line). Trading pulled back down and is now carried out at 82.40/50 levels. Indicators suggest a selloff, which indicates that attempt to breach 82.50/60 support has been successful. была удачной. Further decline towards 80.60, or even to 79.90/80 level is possible. However, this decline should be still considered a correction within a medium-term "bullish" trend, which will recommence as soon as correction is over. The next targets for growth should be found at 84.80/90- 85.00 levels.  EUR/USD: breakdown possible Eurodollar has currently fallen to trend-line support at 1.3280. My preference is for a break down through the trend-line to the next support level below at 1.3150, however if there is a substantial rebound then it will probably go to the 1.3325s.  GBP/USD The price continued to decline and pushed the pair below 1.5900/10 level. Having tested 1.5830/40 support, the price retraced to 1.5900/10 level and is now testing it as a resistance. This level has been mentioned earlier as one of the key barriers on the way down, so, if trading holds below we'll be expecting another decline to 1.5760 support, and may be even lower, towards 1.5650/00 price range. Failure to go down below 1.5910/00 level and growth above 1.5940 will be a signal for further growth towards new local maximums.  Analysis prepared by: Joaquin Monfort and Arkady Nagiev Forex4you analysts
|
|
#18
02-04-2012, 11:33
|
|||
|
|||
|
EUR/USD
The EUR/USD pair has risen to the range highs at 1.3375 and is currently consolidating at that area with the possibility of a break higher - initially reaching the weekly pivot at 1.3422 and then perhaps the upper channel line at 1.3475, where the monthly pivot is situated too. However, given the divergence with momentum and the resistance highs my preference is for a fall back down to 1.3305 at the lower channel line of the rally.  GBP/USD: meeting resistance The GBP/USD pair has broken above the 1.600 level and has rallied up to a resistance just above 1.6050 from the upper channel line of the rally which began on Mar 13. This should resist further gains and the exchange rate will probably fall from here to support from the lower line of the same channel at 1.5960 where the weekly pivot would also be expected to provide support as well.  USD/JPY 81.80/85 support held back the price from further decline and cancelled, may be just for a while, earlier forecasts, expecting further correction towards 80.60, 79.90/80 levels. The price recommenced its growth and, having reached 83.40 level is now declining. At the moment it resides at 82.80/90 level. Indicators have changed their reading and are now suggesting stronger bullish sentiment. Therefore, it's worth expecting current decline to halt at 82.50/60 support and growth to recommence. The first strong resistance on the way up will be found at 84.15/20 local maximum. At the same time, should the price breach 82.50/60 level, we'll be expecting stronger bearish sentiment and a possible reversal towards 81.80/90 level. In this case the price will be most likely moving sideways within 83.40 81.90/80 range with risks to fall towards the above mentioned 80.60, 79.90/80 targets.  Analysis prepared by: Joaquin Monfort and Arkady Nagiev Forex4you analysts Disclaimer: Trading Futures and Options on Futures and Cash Forex transactions involves substantial risk of loss and may not be suitable for all investors. You should carefully consider whether trading is suitable for you in light of your circumstances, knowledge, and financial resources. You may lose all or more of your initial investment. Opinions, market data, and recommendations are subject to change at any time.
|
|
#19
03-04-2012, 13:12
|
|||
|
|||
|
GBP/JPY
The GBP/JPY is forming what looks like a triangle at the highs. The exchange rate has just been falling within this pattern. It has not quite reached the lower support line yet and, whilst it is possible it could simply reverse now and begin rising back up to the highs at 133.10 there is also a possibility that it could fall down to perhaps 130.60 where the S1 weekly pivot is. After that, however, it will probably begin rising back up to the top of the range again.  EUR/USD: downside possible Eurodollar is still bumping up against the range highs and has formed what looks like a possible reversal pattern. It is probable that there will be break lower and a breach of the trend-line for the whole rally up from the 15th Mar lows. The monthly pivot at 1.3260 provides an initial target with 1.3205 as the next target after that.  GBP/USD The uptrend channel (red) line held back the price. Having tested this barrier at 1.6060 level, trading pulled back down and is now carried out at 1.6020 levels. The price is moving sideways within 1.6060 - 1.6000/1.5990 range. Indicators are turning down, suggesting strengthening "bearish" sentiment, MACD divergence is also forming. Further range consolidation is likely to continue with a possible extension lower, to 1.5950/60 support. Reversal towards the uptrend channel sector will give reasons to consider growth towards 1.6090 - 1.6150 resistance range. Should the price breach a short-term trend line (blue line), we'll be expecting a decline to 1.5830/00 support.  AUD/USD 1.0360/50 support kept on holding back the price. "Bears" failed to breach this barrier - the price reached 1.0320/30 level and pulled back up. At the moment it resides at 1.0380/90 level and is about to make another attempt to test 1.0360/50 level. Indicators are neutral, but they seem to suggest a decline as a bigger possibility. Earlier forecasts, expecting the trades to move towards the next target at 1.0220 level are still relevant. 1.0360/50 support breakout will be a signal for that. Should the price, on the other hand, breach a downtrend channel (blue) line and hold above 1.0550/60 level, we'll be expecting a medium-term bullish trend to commence.  EUR/JPY The euro-yen pair is trading in a range which may be a triangle or a topping pattern. It is currently at the range lows and where it has found support and it now seems probable that it could rally up to the consolidation highs at 111.00. Another possibility is that the pair will break down through the trend-line from the January lows and continue down in a bearish move to the 106.25s, the 100% extrapolation of the width of the range.  Analysis prepared by: Joaquin Monfort and Arkady Nagiev Forex4you analysts Disclaimer: Trading Futures and Options on Futures and Cash Forex transactions involves substantial risk of loss and may not be suitable for all investors. You should carefully consider whether trading is suitable for you in light of your circumstances, knowledge, and financial resources. You may lose all or more of your initial investment. Opinions, market data, and recommendations are subject to change at any time.
|
|
#20
04-04-2012, 12:41
|
|||
|
|||
|
GBP/USD: channel breakout
Cable has broken out of the channel it was rallying in and has fallen quite steeply. There are longer-term bearish indications and a hanging man candlestick on the weekly chart. Although the pair is currently pausing and may correct higher - targeting support and resistance at 1.5925 initially, it will probably continue falling thereafter and probably reach the 1.5810 level at first, which is the target generated by the channel breakout and the level of the 50-day MA.  USD/JPY 82.50/60 support breakout indicated strong bearish sentiment. The price dropped to 81.80/90 level, but failed to breach this barrier and bounced up. At the moment trading is carried out at 82.80/70 level. Indicators are neutral, moving horizontally, which makers market picture rather unclear. In this case it's worth expecting further sideways movement within 83.40 81.90/80 range with a possible decline towards 80.60, 79.90/80 targets. At the same time, growth has good chances to commence as well. Should the price breach 83.40 resistance, we'll be expecting a possible reversal towards the medium-term uptrend, which will commence when the price breach 84.20/30 resistance and hold above.  EUR/USD Bearish sentiment dominated - the price breached 1.3290 support and declined. At the moment it's approaching 1.3120/40 support, mentioned earlier as the first target. Trading is carried out at 1.3180/90 level. Indicators suggest further downtrend, which gives reasons to anticipate the auxiliary trend line (blue-dashed line) to be tested anytime soon with deeper decline towards 1.3200 level. It's worth noting, that the price has good chances to fall down to 1.2970/80 level. To recommence their trend, the "bulls" will have to push the price above 1.3290/1.3300.  USD/CHF: rallying The swissie has formed a bottom and is starting to rise. It has just broken above key resistance at the 0.9125 level from the weekly R2 and monthly pivot and this is a strong bullish sign. The larger wave patterns also show the possibility of the start of a new sequence higher after the correction finished the preceding major cycle at the end of February. The current rally could be the elliot wave 3 of the new move higher and it will probably reach at least to the 0.9385 support and resistance level, although a more conservative target might be 0.9240.  Analysis prepared by: Joaquin Monfort and Arkady Nagiev Forex4you analysts Disclaimer: Trading Futures and Options on Futures and Cash Forex transactions involves substantial risk of loss and may not be suitable for all investors. You should carefully consider whether trading is suitable for you in light of your circumstances, knowledge, and financial resources. You may lose all or more of your initial investment. Opinions, market data, and recommendations are subject to change at any time.
|
|
#21
10-04-2012, 13:07
|
|||
|
|||
|
GBP/USD
"Bullish" attempt to push the price up halted at 1.5930 level. Trading is currently carried out at 1.5860/70. 1.5830/40 support keeps on holding back the "bears". Indicators suggest dominating bearish sentiment, R% turned down, saying in favor of this scenario. Therefore it's worth expecting a decline towards the auxiliary trend line (blue dashed line) around 1.5760/70 price range. Dissension towards 1.5650/40 1.5600 supports is also a possibility. Should the price retrace up and hold above 1.6000 level, sentiment will change towards the "bullish".  AUD/USD The price failed to decline towards 1.0220/30 target, mentioned in the previous comments, and consolidated slightly above, suggesting to anticipate volatility. Trading is currently carried out at 1.0290 level. Indicators are "bearish", which gives enough reasons to expect further decline, may be even towards 1.0140/30/50 supports. 1.0220/30 level breakout will be a sign of a strong "bearish" potential. Should the price, on the other hand, escape from a downtrend channel (blue lines) and breach 1.0440/50 resistance, we'll be expecting a reversal up and strengthening bullish sentiment.  EUR/USD The price kept on consolidating within narrow ranges. Forecasts confirmed - the "bulls" attempted to test the auxiliary trend line (blue dashed line) as a resistance, but failed - trading reversed down and is now carried out at 1.3100/10. Indicators are mostly "bearish", which gives reasons to expect further dowtrend and another decline towards earlier mentioned 1.2970/80 support range and then lower, to 1.2870/80 and 1.2750 levels. If the price retraces towards the uptrend channel sector and holds above 1.3170/80 level, we'll be expecting the change of market sentinent. Growth above 1.3290/1.3300 level will be the final signal for reversal up.  Analysis prepared by: Joaquin Monfort and Arkady Nagiev Forex4you analysts Disclaimer: Trading Futures and Options on Futures and Cash Forex transactions involves substantial risk of loss and may not be suitable for all investors. You should carefully consider whether trading is suitable for you in light of your circumstances, knowledge, and financial resources. You may lose all or more of your initial investment. Opinions, market data, and recommendations are subject to change at any time.
|
|
#22
11-04-2012, 13:50
|
|||
|
|||
|
Technical Analysis 11th April 2012
GBP/USD Level 1.5930 became a resistance for the sideways range. Having made another attempt to breach this level, trading is now retracing back down. At the moment it's being carried out at 1.5890/80 levels. Indicators are still "bearish", but they seem to be weakening. However, we still expect a decline towards the auxiliary trend line (blue dashed line) and then towards 1.5760/70, 1.5650/40 1.5600 levels. Reversal up and fixation above 1.6000 will, on the other hand, indicate a reversal up.  USD/CHF: rebound likely The swissie is moving sideways with a slight downside bias. It pulled back from resistance from the upper channel-line at the 0.9200 highs and has since dropped to support at the lower channel- line or floor of the consolidation at 0.9130. This level is further reinforced by support from the 200-4hr MA and the 50-1hr MAs as well as the weekly pivot at 0.9127. Therefore Id expect it to probably reverse and rise from here to re-touch the 0.9200 highs again, although a breakdown is still a slight possibility with the support at 0.9090 eyed initially, followed by 0.9059.  USD/JPY The price breached downtrend channel's support (blue lines), which indicated further "bearish" scenario. Trading descended to 80.60/50 level, where it's still carried out. Indicators suggest another decline, which gives reasons to anticipate a plunge to the next target at 79.90/80 support, mentioned earlier. However, the price has all chances to reverse up from this barrier on the way down and recommence its bullish trend. Growth above 83.40 resistance will be a sign for reversal up. At the same time, the price can rise from the current local minimums too - 80.50/60 level is a strong support at the moment.  EUR/USD This pair is trading in a range between 1.3150 and 1.3040 and this could continue for a little longer. There is substantial support and resistance at the range lows; momentum is strong on the recent fall and there is the possibility of a breakout from the range to the downside, with an eventual target at 1.2835 initially and then the former 1.2640 lows. A rebound higher, however, cannot be discounted, with the range highs at 1.3300 providing an upside target.  Analysis prepared by: Joaquin Monfort and Arkady Nagiev Forex4you analysts Disclaimer: Trading Futures and Options on Futures and Cash Forex transactions involves substantial risk of loss and may not be suitable for all investors. You should carefully consider whether trading is suitable for you in light of your circumstances, knowledge, and financial resources. You may lose all or more of your initial investment. Opinions, market data, and recommendations are subject to change at any time.
|
|
#23
12-04-2012, 13:00
|
|||
|
|||
|
GBP/USD
"Bullish" attempt to push the price up halted at 1.5930 level. Trading is currently carried out at 1.5860/70. 1.5830/40 support keeps on holding back the "bears". Indicators suggest dominating bearish sentiment, R% turned down, saying in favor of this scenario. Therefore it's worth expecting a decline towards the auxiliary trend line (blue dashed line) around 1.5760/70 price range. Dissension towards 1.5650/40 1.5600 supports is also a possibility. Should the price retrace up and hold above 1.6000 level, sentiment will change towards the "bullish". AUD/USD The price failed to decline towards 1.0220/30 target, mentioned in the previous comments, and consolidated slightly above, suggesting to anticipate volatility. Trading is currently carried out at 1.0290 level. Indicators are "bearish", which gives enough reasons to expect further decline, may be even towards 1.0140/30/50 supports. 1.0220/30 level breakout will be a sign of a strong "bearish" potential. Should the price, on the other hand, escape from a downtrend channel (blue lines) and breach 1.0440/50 resistance, we'll be expecting a reversal up and strengthening bullish sentiment. EUR/USD The price kept on consolidating within narrow ranges. Forecasts confirmed - the "bulls" attempted to test the auxiliary trend line (blue dashed line) as a resistance, but failed - trading reversed down and is now carried out at 1.3100/10. Indicators are mostly "bearish", which gives reasons to expect further dowtrend and another decline towards earlier mentioned 1.2970/80 support range and then lower, to 1.2870/80 and 1.2750 levels. If the price retraces towards the uptrend channel sector and holds above 1.3170/80 level, we'll be expecting the change of market sentinent. Growth above 1.3290/1.3300 level will be the final signal for reversal up. Analysis prepared by: Joaquin Monfort and Arkady Nagiev Forex4you analysts Disclaimer: Trading Futures and Options on Futures and Cash Forex transactions involves substantial risk of loss and may not be suitable for all investors. You should carefully consider whether trading is suitable for you in light of your circumstances, knowledge, and financial resources. You may lose all or more of your initial investment. Opinions, market data, and recommendations are subject to change at any time.
|
|
#24
13-04-2012, 13:12
|
|||
|
|||
|
EUR/USD: downmove expected
The eurodollar has started falling after hitting resistance at around the 1.3210 level, made up of several major MA's as well as a weekly pivot. This has led to a corrective move down. It is possible we are witnessing a resumption of the down-trend off the April highs, which could be an Elliot 5th wave, targeting the old lows. RSI has also just given a sell signal, and it is probable that the pair will now fall with major support at 1.3103 where the S1 monthly pivot is. There may be a recovery at that level, although eventually it will probably resume the down-trend to the old lows at 1.3035.  EUR/JPY: wave 5 The EUR/JPY pair has started to fall after touching resistance from the 50-day MA at the 107.15 level. This is probably a 5th Elliot wave of the move down from the March highs and it will probably fall to re-touch the lows at 105.45. After that a deeper break could occur if the head and shoulders pattern on the daily charts breaks its neckline and falls, with 101.75 targeted initially and possibly even 99.75 longer-term. 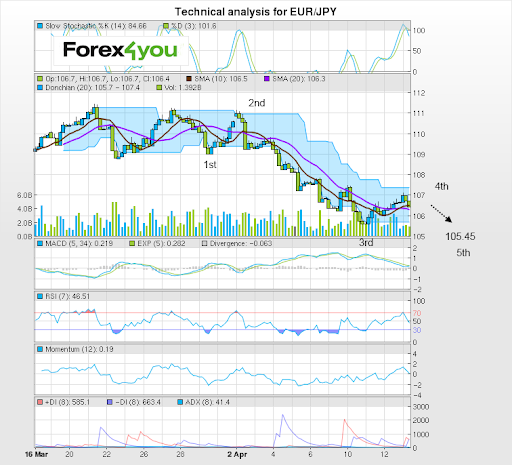 AUD/USD: uptrend resumes The aussie has fallen back to support from the channel which it recently broke out of and has posted a hammer candle-stick signalling a resumption of upside. It will now probably rise back up to retouch the recent 1.0450 highs, possibly in an Elliot wave 5 of the move. There may be further follow through higher too - to resistance from the monthly pivot in the 1.0500 area, which is also the objective for the channel break out and a Fibonacci level. 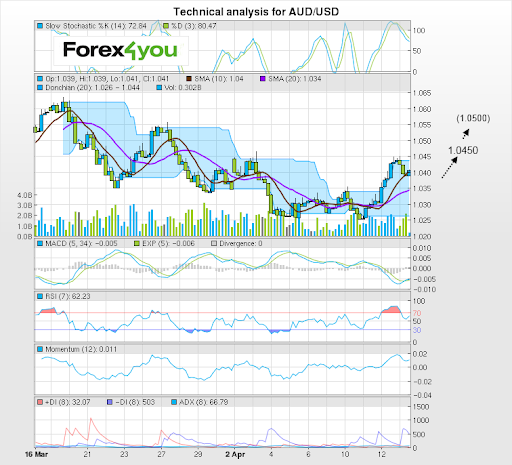 GBP/USD The price breached 1.5930\50 resistancem but the "bulls" managed to push the trades only up to 1.5980/90 level, wherefrom the price recommenced its decline. Tarding is currently carried out at 1.5920/30 levels. Indicators are unclear and the situation is now uncertain. As there have been no signs of a possible reversal up, it's worth expecting further decline to 1.5810/20 and then to 1.5760/70 level. If the price recommences its growth, breaches and holds above 1.6000 resistance, which is now considered to be the key barrier on the way up, market sentiment will turn "bullish".  Analysis prepared by: Joaquin Monfort and Arkady Nagiev Forex4you analysts Disclaimer: Trading Futures and Options on Futures and Cash Forex transactions involves substantial risk of loss and may not be suitable for all investors. You should carefully consider whether trading is suitable for you in light of your circumstances, knowledge, and financial resources. You may lose all or more of your initial investment. Opinions, market data, and recommendations are subject to change at any time.
|
|
#25
16-04-2012, 13:20
|
|||
|
|||
|
EUR/USD: bearish outlook
Eurodollar fell on Friday in an Elliot wave 5 down as anticipated. There is a possibility it has found support at the lows and is in the process of mounting a recovery. A correction now could see it bounce back to resistance from MA's and pivots clustered around 1.3105. My slight preference, however, is for a continuation lower to the next target down at the weekly pivot at 1.2926, which would fulfil the target of the measuring gap created last night. 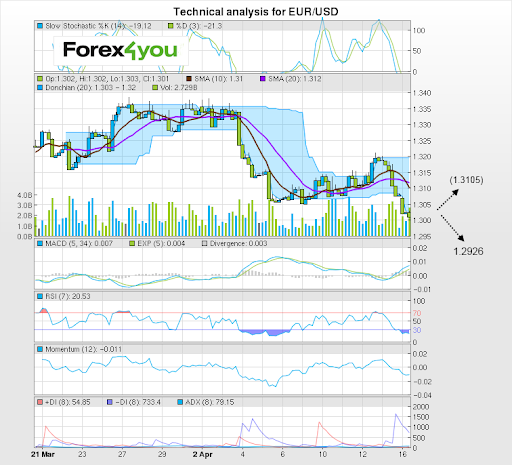 USD/JPY The pair is making another attempt to test 80.50/60 support. Trading is carried out around these levels. "Bearish" potential is strong enough, which gives reasons to anticipate another decline to 79.90/80 support. On the other hand, MACD divergence suggests being cautious - not only a pullback up within the uptrend is possible, but also a reversal towards the medium term uptrend. Growth above 81.90/80 resistance will be a signal for big changes in the market sentiment.  USD/CHF: meeting resistance The swissie has reached a tough resistance level which may prove a barrier to further progress given includes the weekly and monthly R1 pivots and the 100 day-MA. The pair is already beginning to pull-back and despite a strong rally so far , I see the possibility of a major correction from here to perhaps 0.9110 lows. However there is still a slight chance given the strength of the uptrend - that there could be a breakout higher, with a target at 0.9315 where the move from 3rd of April achieves wave equality. 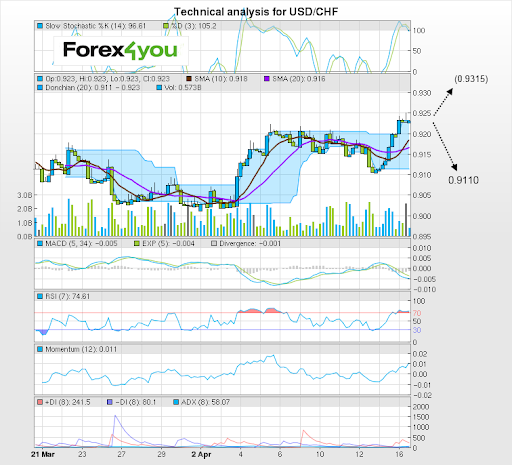 GBP/USD Market picture has changed - the price descended to 1.5810/20 support and is now making attempts to test it. The barrier is strong, especially now that it matches with the auxiliary trend line (blue dashed line), so current decline may halt for a while. Indicators have turned more bearish, which might be a sign of further decline. Should the price breach currently tested level, we'll be expecting another dissension towards the next target at 1.5760/70 level, mentioned earlier, which will be a signal for further sell off, so the price may reach 1.5710 level and then proceed towards 1.5650/00 support range. Should the price rise and hold above 1.6000 level, we'll be expecting a medium-term reversal up.  Analysis prepared by: Joaquin Monfort and Arkady Nagiev Forex4you analysts Disclaimer: Trading Futures and Options on Futures and Cash Forex transactions involves substantial risk of loss and may not be suitable for all investors. You should carefully consider whether trading is suitable for you in light of your circumstances, knowledge, and financial resources. You may lose all or more of your initial investment. Opinions, market data, and recommendations are subject to change at any time.
|
|
#26
17-04-2012, 12:30
|
|||
|
|||
|
EUR/USD: correction maturing
A classic A-B-C correction is under-way following the completion of an Elliot wave down which started at the late March highs. Waves A and B appear to have completed and C may end at 1.3240 where it would achieve wave equality with A and touch the monthly pivot. It is also possible it may fall short and another target for the end of the rally is at the old highs of 1.3212. Once complete the down-trend will probably resume with the next cycle probably making new lows below 1.2994. 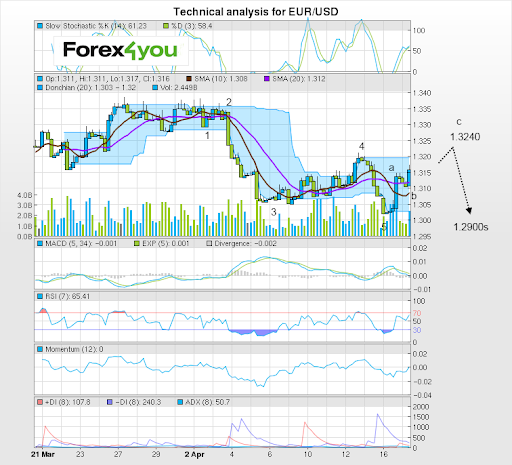 EUR/JPY: downside possible This pair has found resistance at the highs from moving averages and the weekly pivot after correcting the previous strong move down. It has taken the form of an A-B-C three wave correction with wave C currently reaching just shy of wave equality with A at 106.45. The move will probably roll-over and the down-trend resume. Downside targets include the former lows initially at around 104.85 and then 100-day MA at 104.10. If there is a continuation higher, however, then 106.95 could form the next upside target although eventually downside should predominate. 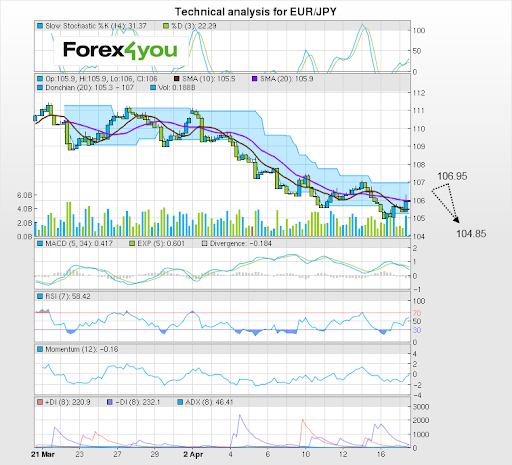 GBP/USD 1.5810/20 support (secondary trend line) proved its strength and held back all bearish attacks. Trading climbed towards 1.5930/20 resistance, which, if breached, will indicate the change of sentiment in the market. Indicators are turning, giving even more reasons to be cautious. SS in turned down, slightly calming down rising concerns. As long as level 1.6000 is safe, bearish sentiment should be considered dominating - new local minimums at 1.5760/70, 1.5710 levels and 1.5650/00 support range are likely to be tested anytime soon.  USD/JPY The price continued its attempts to breach and hold below 80.50/60 support. Having reached 80.30 level, trading is now pulling back up and being carried out at 80.70/80 level. However, the fact that SS is being oversold suggests to consider current growth to be another correction and a downtrend may recommence anytime soon. Earlier forecasts are still relevant - final ascension towards 79.90/80 support should commence, then a medium downtrend should begin. Growth above 81.90/80 resistance will be a signal for serious changes in market sentiment.  Analysis prepared by: Joaquin Monfort and Arkady Nagiev Forex4you analysts Disclaimer: Trading Futures and Options on Futures and Cash Forex transactions involves substantial risk of loss and may not be suitable for all investors. You should carefully consider whether trading is suitable for you in light of your circumstances, knowledge, and financial resources. You may lose all or more of your initial investment. Opinions, market data, and recommendations are subject to change at any time.
|
|
#27
18-04-2012, 16:37
|
|||
|
|||
|
Technical Analysis 18th April 2012
EUR/USD: correction unfolds The eurodollar pair completed its upside correction and then began falling as expected. At the same time a head and shoulders pattern broke its neckline and the exchange rate also pierced through major support at 1.3105. It will probably move down to reach the H&S target at 1.3040, however after that there is the possibility of a bounce as downside has been a little weak so far and it is possible the new cycle lower hasn't begun yet. There may be another correction first, with perhaps 1.3185 targeted or even 1.3212.  USD/JPY "Bears" failed to push the trades down below 80.35 level, the price continued its growth and now resides at 81.50/60 level. Looks like MACD divergence has realized and indicators have turned up, suggesting further ascension. However, until the price breaches 81.80/90 resistance, trading has all chances to recommence a decline any time. Therefore, it's worth expecting another attempt to breach 79.90/80 resistance. Growth above 81.90/80 resistance will be a signal to expect medium-term growth.  EUR/GBP: bearish breakout The EUR/GBP pair has made a sudden break lower, out of the channel it was moving down within, yielding a downside target of 0.8068, using the width as a guide. This happens to be only 2 pips above the July 2010 major lows at 0.8066 and indicates the possibility the lows could be reached. Currently it appears to be putting in a dragon-fly doji on the 4-hr chart at the S3 weekly pivot and there is the possibility of a base forming and a temporary bounce to resistance at 0.8200. After that I see a strong possibility of a resumption of the fall with the 0.8068 level targeted eventually, although the monthly pivot at 0.8125 could also be reached. 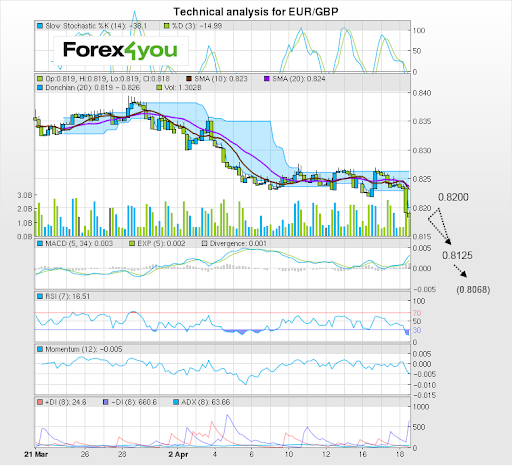 GBP/USD 1.5930/20 resistance, mentioned earlier as one of the key resistances, indicating a reversal, was breached, but trading retraced below this level, so the breakout has to be now considered false. However, the price can make another attempt to recommence growth too, so the situation is rather uncertain. Should the price hold above 1.5930 level, trading will turn up and the price will ascend to 1.6000 level. Reversal down, below 1.5870 level will indicate bearish potential and, therefore, suggest further decline towards new local minimums at 1.5760/70, 1.5710 and 1.5650/00 levels in the near future. 1.6000 level breakout will be a signal for reversal up in a medium-term.  Analysis prepared by: Joaquin Monfort and Arkady Nagiev Forex4you analysts Disclaimer: Trading Futures and Options on Futures and Cash Forex transactions involves substantial risk of loss and may not be suitable for all investors. You should carefully consider whether trading is suitable for you in light of your circumstances, knowledge, and financial resources. You may lose all or more of your initial investment. Opinions, market data, and recommendations are subject to change at any time.
|
|
#28
19-04-2012, 13:03
|
|||
|
|||
|
EUR/USD: correction completing
The EUR/USD pair has continued to consolidate. It is possible that it is near to completing a double zigzag at the current highs, which started on the 16th as labelled on the chart below. There is a possibility that it could go a little higher to the monthly pivot at 1.3185 where waves A and C would achieve equality or even 1.3212 if C is longer. After that there is a strong possibility of the next cycle starting and reaching below the 1.2994 lows. The double correction may extend to a triple too but not beyond. The new impulse down will probably be characterised by its unusual strength. 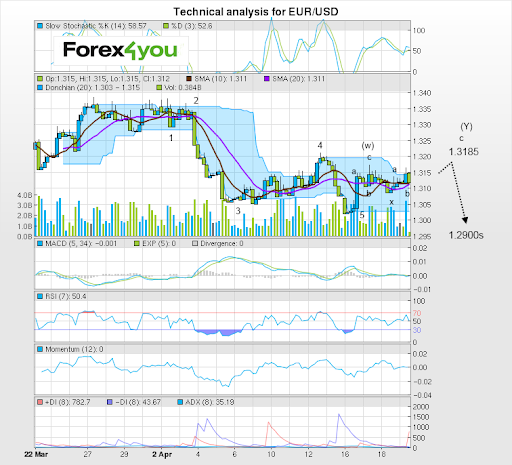 GBP/USD Earlier forecast, expecting possible growth, confirmed. The price breached 1.5930/20 resistance and then level 1.6000, mentioned earlier as the key barriers for reversal up. The price is now testing the next resistance at 1.6060 resistance. Indicators are turned up, suggesting further growth. However, currently tested level is just the first bound of 1.6060-16090/1.6100 resistance range, so the bulls have a long way to go. Should the price breach this barrier on the way up, it will proceed towards the next strong resistance at 1.6160/70 level, which has already held back the bulls once, in October 2011. In case the price fails to ascend further, it'll most likely correct towards 1.6000 support. If the expected pullback continues below 1.5960/50 level, we'll be expecting a reversal down.  EUR/JPY: meeting resistance The potential for a roll-over at this level is quite high. The weekly and monthly pivots are both in the 106.90s and a on the 4-hr chart a 2- bar reversal is forming which also has bearish connotations. RSI is showing divergence at its peaks and MACD is looking overextended. The pair could fall to 106.20 where it will meet support from moving averages on several time frames and then 105.75. It is also possible a new Elliot wave cycle could be about to begin which will eventually take the rate below the 104.60 lows.  Analysis prepared by: Joaquin Monfort and Arkady Nagiev Forex4you analysts Disclaimer: Trading Futures and Options on Futures and Cash Forex transactions involves substantial risk of loss and may not be suitable for all investors. You should carefully consider whether trading is suitable for you in light of your circumstances, knowledge, and financial resources. You may lose all or more of your initial investment. Opinions, market data, and recommendations are subject to change at any time.
|
|
#29
20-04-2012, 14:01
|
|||
|
|||
|
EUR/USD: downside possible
Eurodollar could be at important turning point. The correction which began at the lows of the 16th has probably run its course and the larger down-trend may resume quite soon. From an Elliot wave perspective we have probably reached the final zig-zag in a rare triple correction, and this final wave may be ending now at the 1.3180 highs. If there is a move down it will be most tested at the thick layer of resistance at around the 1.3105 level where it could consolidate. This will need to be broken for the move to gain traction but it will probably eventually fall below the 1.2994 lows as the next cycle down unfolds. 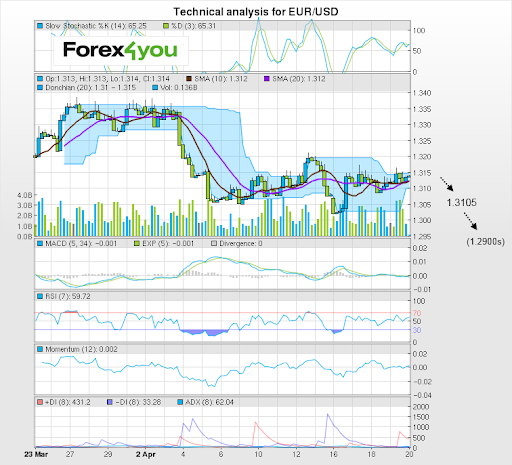 GBP/USD 1.6060-1.6090 resistance range held back further ascension like expected. While correcting, the price declined to 1.6000, but then retraced back up and breached 1.6060-1.6090 barrier. At the moment the "bulls" are attempting to hold above, trading is carried out at 1.6100/10 level. Indicators are now "bullish", which gives reasons to expect growth to the next strong resistance at 1.6160/70 level, which has already halted the uptrend at the end of 2011. However, a cluster of resistances above 1.6100 level may hold back ascension. Reversal towards 1.6000 level will trigger doubts of the bullish strength, decline below 1.5960/50 will be a signal for reversal.  AUD/USD The aussie corrected back to the 1.0345s as predicted. The strength of the earlier rally seems to indicate the possibility of a resumption of the previous up-move, with a target from the channel at 1.0485 and another target at 1.0525 which would give wave equality from the lows of the 11th. The other possibility which is my preference - is that the current bear move is an Elliot 5th wave from the February highs and will continue lower and reach the former lows at 1.0238. The strong clusters of resistance lying just above the current price action also support this more bearish forecast. 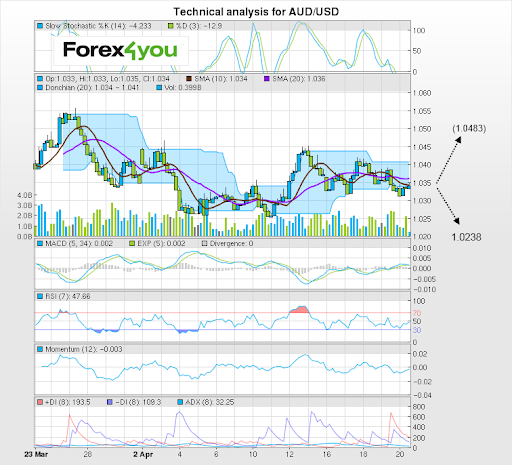 Analysis prepared by: Joaquin Monfort and Arkady Nagiev Forex4you analysts Disclaimer: Trading Futures and Options on Futures and Cash Forex transactions involves substantial risk of loss and may not be suitable for all investors. You should carefully consider whether trading is suitable for you in light of your circumstances, knowledge, and financial resources. You may lose all or more of your initial investment. Opinions, market data, and recommendations are subject to change at any time.
|
|
#30
24-04-2012, 13:31
|
|||
|
|||
|
AUD/USD
Strong 1.0300/10 support held back the "bears" for a while, but then the price continued its decline and tested earlier breached downtrend (blue) line around 1.0260/50 levels. Then trading pulled back up and is now carried out at 1.0290/80 level. Indicators are bearish, suggesting further possible decline. However, strong supports at current levels give reasons to be cautious about further dissension - the barrier on the way down is strong enough, so correction within 1.0360-1.0160/50 range is also quite a possibility. Decline below 1.0220/30 local minimum will indicate the bearish strength and give reasons to expect a plunge to 1.040/30 level. Growth above 1.0360 will, on the other hand, suggest a possible reversal towards the bullish trend in a medium term. GBP/USD 1.6060/50 support held back the "bearish" attacks and prevented the price from holding below. Trading recommenced growth and is now carried out at 1.6150/40 level, which means that the price has approached 1.6160/70 level, mentioned earlier as the target for growth. Indicators have turned more bullish, suggesting further growth. Only MACD divergence suggests a possible pullback, which gives reasons to anticipate a large scale correction from 1.6170/60 resistance. Decline below 1.6120 level will be the first signal for changes, 1.6090/80 support breakout will be the final indication of the upcoming pullback down. If, however, the price breaches 1.6170/60 resistance the bulls will have good chances to test 1.6300 level. EUR/JPY The euro-yen pair has consolidated in a sideways range since falling to the 106.30 lows on Monday. It will probably resume its bearish move lower soon with a downside target of 105.60 at the level of the 200-day MA and the weekly pivot. There is less chance it will go higher as the monthly pivot is capping gains at 106.92, however, a move higher might be expected to match the previous highs at 107.99 before extending to satisfy wave equality at 109.70. EUR/USD: downmove expected Eurodollar has risen from the 1.3100 lows and now reached the 1.3170s. There is the possibility of some more upside to just shy of 1.3200 which would result in wave equality, but there are lots of bearish signals too. We are at the 61.8% fibonacci retracement of the previous down-move and an obvious place for the rally to stall; there is a shooting star on the hourly and we have reached the 50-day MA, as well as the 200-4hr. It is quite possible the move has completed and the new Elliot wave down will resume. This in turn would be expected to break below support at the 1.3100 lows. Analysis prepared by: Joaquin Monfort and Arkady Nagiev Forex4you analysts Disclaimer: Trading Futures and Options on Futures and Cash Forex transactions involves substantial risk of loss and may not be suitable for all investors. You should carefully consider whether trading is suitable for you in light of your circumstances, knowledge, and financial resources. You may lose all or more of your initial investment. Opinions, market data, and recommendations are subject to change at any time.
|
|
#31
25-04-2012, 13:41
|
|||
|
|||
|
USD/CHF
The daily chart is showing a large triangular formation unfolding but no clues as to which way it will break. The 4hr chart has a large head and shoulders pattern with bearish connotations and if it breaks down it will probably reach support at the lower line of the triangle at 0.9050. The recovery bounce currently unfolding on the hourly chart looks reasonably robust so there is also a possibility that it could reach resistance from the 50-day MA at the 0.9125 level, although at the moment there is still insufficient bias either way. 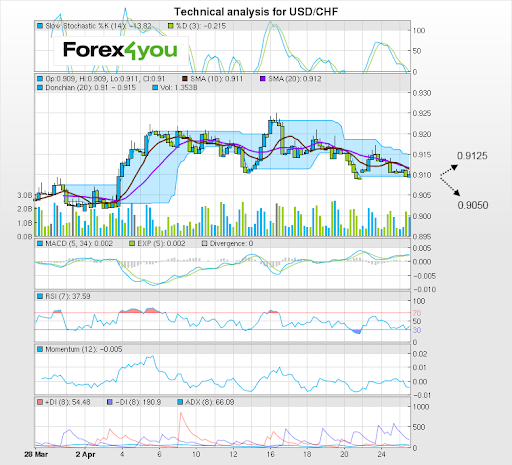 USD/JPY The price keeps on testing a downtrend (blue) line as a resistance, but fails. Another bullish attack was held back by 81.50/60 resistance. Trading is currently carried out at 81.20/10 level. Indicators are unclear, but they seem to be turned more down, suggesting a possible decline to 80.60 level, which will give more grounds to anticipate another dissension to 79.90 level. 81.80/90 81.50/60 resistance range breakout will, on the other hand, indicate the bullish victory. GBP/USD: further downside possible Sterling has fallen sharply after hitting resistance from the monthly pivot at the 1.6162 highs as well as other major resistance lines from previous highs. It has moved out of the overbought region on momentum indicators and there is a strong possibility the move down could go deeper, initially to the cluster of support at 1.6030 and then perhaps if it is strong, to the 1.5955 level where the 50-day MA is situated and sure to lend support for a rebound.  EUR/USD: break lower probable The EUR/USD pair has recovered with surprising strength and has rallied up to above the 1.3200 level. This is probably a correction of the previous wave and I expect it to reverse soon probably before it gets above the previous highs at 1.3226. It has also hit resistance form the 50-day MA, reinforcing the bearish outlook. From here I see a break lower as the next Elliot wave down unfolds, first to the cluster of support at 1.3177 but then eventually to the 1.3100 major support level of a few days ago where the monthly pivot lies. 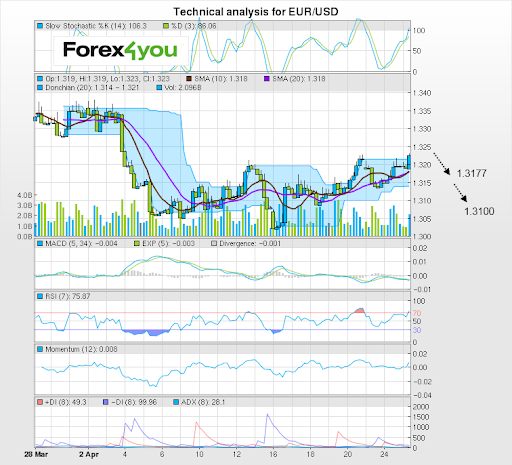 Analysis prepared by: Joaquin Monfort and Arkady Nagiev Forex4you analysts Disclaimer: Trading Futures and Options on Futures and Cash Forex transactions involves substantial risk of loss and may not be suitable for all investors. You should carefully consider whether trading is suitable for you in light of your circumstances, knowledge, and financial resources. You may lose all or more of your initial investment. Opinions, market data, and recommendations are subject to change at any time.
|
|
#32
27-04-2012, 16:18
|
|||
|
|||
|
GBP/USD
Level 1.6200 held back further bullish growth, like expected. The price began to correct, successfully tested earlier breached resistance at 1.6170/60 level as a support and recommenced growth. At the moment trading is carried out at 1.6180/90 level. Indicators are still bullish, although MACD divergence suggests to be cautious. As the bullish trend is now considered dominating, we expect growth towards the next target at 1.6280 level. At the same time level 1.6200 looks to be strong enough to trigger a bigger pullback than on the last session and even become a starting point for a downtrend. Decline below 1.6060/50 support will be a serious sign for the bullish weakness. EUR/USD: upside breakout Eurodollar has found support from the 50-day moving average and begun rallying. Currently it has reached the 1.3210s at the upper line of the down-sloping channel on the hourly chart, where it is consolidating before its next move. It will probably continue higher and reach its target at 1.3265 with upside eventually capped at another trend-line at 1.3295. A move down would target the lower channel line at 1.3150.  AUD/USD The aussie has been rallying strongly and it could carry on higher to the monthly pivot and wave equality target at around 1.0480. From there is is possible it may roll-over and resume its descent as the rally looks like a counter-trend short covering move which rises rapidly and then petters out at the highs. If it goes higher then the next target would be the 50% Fibonacci at 1.0550. Downside support kicks in at around 1.0370 where the 200-day MA is situated and long-term support. https://lh4.googleusercontent.com/-p...DUSD270412.png USD/JPY The price made 3 unsuccessful attempts to breach a downtrend line (blue line) and retraced back down. At the moment it's testing 80.60 support. Indicators have turned down suggesting the bearish sentiment, which means that currently tested level may be breached anytime soon and the price may decline further down to 79.90 level, mentioned earlier. Decline is unlikely, the bullish trend is dominating in a medium-term, so reversal to growth may commence anytime. 81.80/90 81.50/60 resistance breakout will be a signal for renewed bullish trend. USD/CHF There is substantial resistance at the daily highs from the 50-day MA and the monthly pivot and the price action has taken the form of a bearish shooting star candlestick so far today although the day is not over yet. More downside could see a re-test of the lower line of the triangle on the daily chart at 0.9060. A break-out from the triangle would probably see a rapid move down to the 0.8800s at least. There is also a chance the triangle is completing its E-wave at the moment, and although it might overshoot the lower trend-line temporarily the longer term outlook would be bullish with a resumption of the up-trend, back to the upper trend-line at 1.9160 initially before a break higher.  GBP/USD Level 1.6200 held back further bullish growth, like expected. The price began to correct, successfully tested earlier breached resistance at 1.6170/60 level as a support and recommenced growth. At the moment trading is carried out at 1.6180/90 level. Indicators are still bullish, although MACD divergence suggests to be cautious. As the bullish trend is now considered dominating, we expect growth towards the next target at 1.6280 level. At the same time level 1.6200 looks to be strong enough to trigger a bigger pullback than on the last session and even become a starting point for a downtrend. Decline below 1.6060/50 support will be a serious sign for the bullish weakness. Analysis prepared by: Joaquin Monfort and Arkady Nagiev Forex4you analysts Disclaimer: Trading Futures and Options on Futures and Cash Forex transactions involves substantial risk of loss and may not be suitable for all investors. You should carefully consider whether trading is suitable for you in light of your circumstances, knowledge, and financial resources. You may lose all or more of your initial investment. Opinions, market data, and recommendations are subject to change at any time.
|
|
#33
07-05-2012, 13:07
|
|||
|
|||
|
EUR/USD
Eurodollar has fallen to the lows of the consolidation zone on the daily chart. The gap down last night probably signalled a breakout rather than exhaustion however, there has been a strong rebound this morning. ADX has just fallen to historic lows, indicating the high chance of a return to directional movement. There is no key support below the current price level leaving the way open to a fall to at least the old 1.2625 lows if not deeper. The monthly pivot sits capping gains at 1.3030, however, there is a chance the pair could break above it and fill the gap from this morning by rallying up to 1.3080.  EUR/JPY: head & shoulders The head & shoulders pattern on the EUR/JPY daily chart and diminishing volume on the right shoulder is a very bearish sign. The gap down overnight, which broke through the neckline, is probably a break-away gap indicating further downside. There has been a bounce off the monthly pivot this morning but it has now reached resistance from the neckline and I expect it will probably roll-over soon and continue down, beginning a strong down-move eventually the H&S target at 97.75- although support at 101.90 provides a closer target. If there is a break back above the neckline it will probably close the gap at 104.45.  EUR/GBP: at historic lows The EUR/GBP pair has gapped down to below the support level and cluster of targets at 0.8065 in an extremely bearish move which knocks out the 2010 lows and takes the pair back to levels not seen since 2008. There are two possibilities from here: the first is that we will bounce from these historic lows and last night's gap was an exhaustion gap; this would see the pair rally to 0.8220 probably. Or alternatively, because we have gone below the old lows this could be part of a longer bearish move to 0.7965 at first and then the bottom of the descending channel at 0.76s. We advise you to wait until confirmation tomorrow.  Analysis prepared by: Joaquin Monfort and Arkady Nagiev Forex4you analysts Disclaimer: Trading Futures and Options on Futures and Cash Forex transactions involves substantial risk of loss and may not be suitable for all investors. You should carefully consider whether trading is suitable for you in light of your circumstances, knowledge, and financial resources. You may lose all or more of your initial investment. Opinions, market data, and recommendations are subject to change at any time.
|
|
#34
08-05-2012, 14:58
|
|||
|
|||
|
USD/JPY: potential bear move
The USD/JPY pair has hit resistance from the lower line of the descending wedge on the daily chart. This could signal a move lower with support from the weekly pivot and the 200-4hr moving average at 79.10. A stronger bearish move could even target the monthly pivot at 78.60.  GBP/USD Cable has fallen today and given back the gains it made yesterday when it posted a bullish engulfing reversal pattern. Price-action is still sitting on major support from several long-term lines, and the monthly pivot lies below at 1.6110. There is, therefore, still a chance of a bounce from here back up to re-touch the highs at 1.6301. Looking at the weekly chart, however, we see a dark-cloud cover candlestick pattern and if this week ends down then that would provide confirmation for a bear move, with the trend-line at 1.6000 as an initial target and then 1.5900.  Analysis prepared by: Joaquin Monfort and Arkady Nagiev Forex4you analysts Disclaimer: Trading Futures and Options on Futures and Cash Forex transactions involves substantial risk of loss and may not be suitable for all investors. You should carefully consider whether trading is suitable for you in light of your circumstances, knowledge, and financial resources. You may lose all or more of your initial investment. Opinions, market data, and recommendations are subject to change at any time.
|
|
#35
10-05-2012, 13:29
|
|||
|
|||
|
EUR/USD
The eurodollar pair has broken out of a right-angled triangle on the daily chart and begun a strong bearish move lower. After a pause yesterday it looks ready to begin a new wave down, with the next target at 1.2820 where support from the monthly and weekly pivots lies. The longer-term target is a t the level of the 1.2600 lows which also happens to be the target calculated from the width of the triangle.  GBP/USD The price reached 1.6060/70 target, mentioned in the previous comments. The barrier proved to be a strong support and triggered a pullback up. Trading retraced above 1.6120 line. However, the price is moving down again, trading is carried out at 1.6110 level. Current situation suggests to expect a possible "bearish" attack at 1.6060/70 level, which gives reasons to anticipate another decline towards the uptrend (blue dashed line) within 1.5980/1.6000 range. However, indicators support a possible "bullish" development, so it's worth being careful about further decline. 1.6060/70 support had been mentioned earlier as the key barrier, which could hold back a decline for quite a while. Uncertainty is growing ahead of the BoE interest rate decision, scheduled for today. Therefore it's worth holding on and wait till the results of the meeting come in.  USD/JPY The price declined towards 79.80/90 79.50/40 support range. It's lower bound halted a decline, trading is currently carried out at 79.70/60 levels. 79.80/90 79.50/40 range, mentioned earlier as the key range on the way down, as its breakout would indicate dominating bearish sentiment and give reasons to anticipate a possible decline towards historical minimums. If the barrier is breached, the first strong support will be found at 78.30/20 level. Indicators are currently moving sideways, MACD divergence suggests to cautious and get ready for growth. Reversal to growth is also a possibility. 80.60 resistance breakout will be a signal for renewed uptrend.  GBP/JPY The GBP/JPY is also forming a text-book head & shoulders topping pattern on the daily chart. This could indicate a break lower, with an initial move down to 127.40 and then some consolidation. After that there may be a break through the neckline, initializing the head & shoulders bear break, with an eventual target calculated from the pattern combined with support at around the 121.60s.  Analysis prepared by: Joaquin Monfort and Arkady Nagiev Forex4you analysts Disclaimer: Trading Futures and Options on Futures and Cash Forex transactions involves substantial risk of loss and may not be suitable for all investors. You should carefully consider whether trading is suitable for you in light of your circumstances, knowledge, and financial resources. You may lose all or more of your initial investment. Opinions, market data, and recommendations are subject to change at any time.
|
|
#36
14-05-2012, 13:56
|
|||
|
|||
|
EUR/USD: continuation expected
We have now had a break out from the triangle and a move down is well under-way. This morning's gap down signals probably even more downside to come. It is almost certainly a measuring gap which means it can be used to generate an eventual target estimated to be at 1.2730. Moreover, the width of the triangle gives us an even deeper target for the end of the move at 1.2595, near the old January lows.  USD/JPY 79.50/40 support triggered a pullback up, confirming earlier forecasts and MACD divergence warning. At the moment the price is attempting to breach a downtrend channel (blue) line. Trading is carried out at 80.00/10 level. Indicators seem to be turning more bullish, suggesting further highly possible growth. However, to commence the uptrend bulls have to first push the price above 80.60 resistance. The barrier is the closest after the price escapes from the channels sector, so trading can retrace back down as well. If bulls succeed and push the trades above 81.80/82.00, itll be a good sign of their strength. If the price fails to breach 80.60 resistance, the pair will have all chances to test historical minimums any time soon. Decline from the current levels is also a possibility.  EUR/NZD: down-move possible The euro-kiwi is showing a nice bearish set-up although some more confirmation would be ideal before taking a position. The pair has formed a flag-shaped pattern on the daily chart and within this flag we have now climbed to the upper channel line just above the current 1.6550 level. Momentum and Chaikin Money Flow are diverging strongly adding to the bearish indications and there is resistance from last week's spike highs and the monthly and weekly pivots. The pair will probably fall initially to 1.6450 and then if stronger to the bottom of the channel at 1.6000.  GBP/USD 1.6060/70 support keeps on holding back the bears from further decline. The price is now making another attempt to breach this barrier on the way down. Trading is carried out at 1.6060/50 level. Indicators suggest to expect the breakout to turn out successful. If the level is breached and the price breaks through the next strong support on the way down- level 1.6000/10, which now matches with the uptrend (blue dashed) line, medium-term bearish trend will have all chances to recommence. On the other hand, the price hasnt breached 1.6060/70 support yet, so trading can retrace back up from current supports too.  Analysis prepared by: Joaquin Monfort and Arkady Nagiev Forex4you analysts Disclaimer: Trading Futures and Options on Futures and Cash Forex transactions involves substantial risk of loss and may not be suitable for all investors. You should carefully consider whether trading is suitable for you in light of your circumstances, knowledge, and financial resources. You may lose all or more of your initial investment. Opinions, market data, and recommendations are subject to change at any time.
|
|
#37
28-05-2012, 13:17
|
|||
|
|||
|
EUR/USD
A shooting star on the 4-hr chart is warning of further downside and there is the possibility of a bearish move to fill the gap at 1.2520. Beyond that the outlook is balanced as the head and shoulder's pattern has reached its downside target at 1.2525 and Friday formed an inverted hammer which could forecast more upside. If today remains above Friday's lows then it is possible there will be a reversal upswing, reaching 1.2642 at first and then 1.2700. 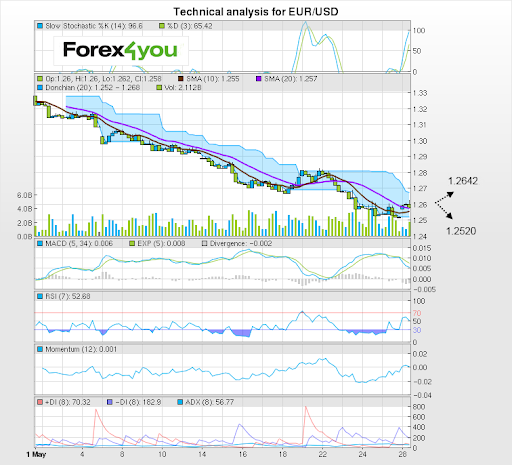 GBP/USD: correction possible The pound has fallen to support on the daily chart. It has put in a doji and then gapped up this morning. My preference is for more upside and if today ends on a high then it will be a strong signal for a longer correction, targeting the trend-line at 1.5800. In Elliot terms we might be witnessing the bottoming of a wave 3 and the start of a wave 4 correction, targeting the level of the wave 4 of lesser degree at, again 1.5800. A break lower is possible, however, with the old 1.5550 target eyed.  AUD/USD: parity targeted On the 4-hr chart the aussie has reached resistance from the upper channel line of the move down from February. This could lead to a pull-back with the 0.9835 level the most likely destination. Longer term there is potential for a reversal and a larger upside corrective move. There is an inverted hammer candlestick at the lows, a rounding bottom on the hourly chart, and today's gap higher could be a breakaway gap and start of a new mini-trend targeting parity.  Analysis prepared by: Joaquin Monfort and Arkady Nagiev Forex4you analysts Disclaimer: Trading Futures and Options on Futures and Cash Forex transactions involves substantial risk of loss and may not be suitable for all investors. You should carefully consider whether trading is suitable for you in light of your circumstances, knowledge, and financial resources. You may lose all or more of your initial investment. Opinions, market data, and recommendations are subject to change at any time.
|
|
#38
31-05-2012, 14:52
|
|||
|
|||
|
EUR/USD: rebound underway
The eurodollar had reached the level of the 2008 lows and rebounded as expected. The correction is still rising and my preference is for it to continue to the next target higher at 1.2460 the level of the upper channel line of the move down of the last few weeks and after that possibly also the old lows at 1.2500. Alternatively a resumption of the down-trend is a possibility with channel support at 1.2315 the next target lower.  GBP/USD: bounce/roll-over possible The GBP/USD pair has found resistance from a long-term support line on the weekly chart which forms the lower border of a rising wedge pattern, which has been unfolding since the 2009 lows. It would be expected to bounce from here with the next upside target at 1.5570. Given the ferocity of the move down so far and the fact the wedge has completed 5 waves, however, there is a possibility the bounce will roll-over soon and breakout from the pattern, with a longer-term target at the old 1.35 lows. A breach of 1.5200 would provide strong confirmation such a move was beginning.  USD/JPY: technical analysis The price failed to breach downtrend (blue) line and hold above. Decline recommenced and the price fel to the first local minimum at 78.80/70 level, where trading is still carried out. If this support is breached - the price will decline lower, to the next target at 78.30 level. Indicators are bearish, suggesting this scenario to confirm. Plunge lower, towards 77.80/70 support becomes a possibility too. Reversal up, above 79.40/50 resistance will cancel the bearish scenario.  Analysis prepared by: Joaquin Monfort and Arkady Nagiev Forex4you analysts Disclaimer: Trading Futures and Options on Futures and Cash Forex transactions involves substantial risk of loss and may not be suitable for all investors. You should carefully consider whether trading is suitable for you in light of your circumstances, knowledge, and financial resources. You may lose all or more of your initial investment. Opinions, market data, and recommendations are subject to change at any time.
|
|
#39
01-06-2012, 13:52
|
|||
|
|||
|
AUD/USD
Longer term there is a bearish topping pattern on the weekly chart, however the exchange rate is in a support zone between 0.97 and 0.93 where historically there have been many rebounds, and from the current level it could rebound in the short term before the larger trend pushes things down again. The 4-hr chart is showing the formation of a hammer resting on the weekly pivot which could herald a bullish bounce, with 0.9750 presenting an initial target. A continuation lower, however, would target the 2011 lows at 0.9387.  EUR/USD: more downside expected The EUR/USD pair has resumed its down-move and will probably continue lower, with the next target located at the weekly pivot at 1.2283. A deeper move might reach 1.2183 which is the target if waves A and B of the move from the 1st of May achieve equality.  GBP/USD 1.5420/00 support failed to hold back the bears and the price dropped towards 1.5280/70 level, which resides close to this year minimum - level 1.5230/40. Indicators are all bearish again, which suggests further decline. However the price has recently approached strong psychological support level, which may trigger abrupt bounce. Current situation is rather unclear, especially ahead of the US employment report release. Therefore, even if 1.5270/80 support is breached, trading won't decline deeper, than 1.5230 level. The price will most likely keep on consolidating at its old minimums ahead of the US employment report. In a medium-term, further decline is the most probable scenario. Sentiment may begin to change only if the price grows above 1.5650.  Analysis prepared by: Joaquin Monfort and Arkady Nagiev Forex4you analysts Disclaimer: Trading Futures and Options on Futures and Cash Forex transactions involves substantial risk of loss and may not be suitable for all investors. You should carefully consider whether trading is suitable for you in light of your circumstances, knowledge, and financial resources. You may lose all or more of your initial investment. Opinions, market data, and recommendations are subject to change at any time.
|
|
#40
06-06-2012, 15:16
|
|||
|
|||
|
USD/JPY: meeting channel-line
The dollar-yen has been rebounding strongly but has now reached an important channel-line from the March highs which is resisting further upside. It looks possible that there could be a bearish move down, with the 50 day MA at 78.60 providing the initial target and then possibly the 77.60 lows. Alternatively, if this is the start of a trend change then a breakout of the channel is also possible, with the next target higher at around 79.85/80.00.  EUR/GBP: channeling EUR/GBP has formed a clear rising channel on the daily chart and has just been pushed back down by the top of the channel, with expectations that it will fall to the lower line situated at 0.8000. At first, however, the pair will probably meet strong support at 0.8055, where a bunch of monthly pivots and moving averages are situated. There is also a lesser chance of a re-test of the 0.8140 highs.  EUR/USD Eurodollar has rebounded off its lows and is currently rallying in a rising channel. If the rally continues it will probably reach 1.2565. There is a possibility it might even reach strong resistance at 1.2600. A roll-over, on the other hand, would fall to the base of the channel at 1.2465, with a complete breakout from the channel targeting 1.2335.  Analysis prepared by: Joaquin Monfort and Arkady Nagiev Forex4you analysts
|
|
| Thread Tools | Search this Thread |
|
|
 Similar Threads
|
||||
| Thread | Thread Starter | Forum | Replies | Last Post |
| GIGFX Technical Analysis (Updated Daily) | GIGFX | Trading Journals | 129 | 27-02-2012 08:14 |
| Daily Technical Analysis Fri,January 27, 2012 | fxpulsation | Forex Analysis | 0 | 27-01-2012 09:38 |
| Daily Technical Analysis Thu,January 26, 2012 | fxpulsation | Forex Analysis | 0 | 26-01-2012 11:47 |
| EURUSD Forex Forecast (Updated Daily) Jan. 3 2011 | FxWatchers | Trading Journals | 20 | 03-07-2011 10:36 |
| EURUSD Forex Forecast (Updated Daily) | FxWatchers | Software / Signals / Services | 1 | 04-01-2011 05:44 |


