S&P500: Current Dynamics
05/28/2019
World stock indices went down again after weak growth during the Asian session on Tuesday.
Investors are returning to the market after a long weekend and assess the events that have taken place, including the elections to the European Parliament and the trip of US President Donald Trump to Japan. Trump said that despite the recent conflict with Iran, he will not try to dislodge the government of this country.
He also said that, against the background of "substantial progress" in trade negotiations with Japan, duties on Chinese imports "can easily be extremely increased". Thus, the US-China trade conflict threatens with a new aggravation, which can negatively affect both the Chinese and the American economies.
Meanwhile, the yield of US government bonds falls again. Thus, at the beginning of the European session, the yield on 10-year US government bonds fell to 2.278%, the lowest since February 2018. This indicates a growing uncertainty among investors and their avoidance of risks and purchases of high-yielding and risky assets.
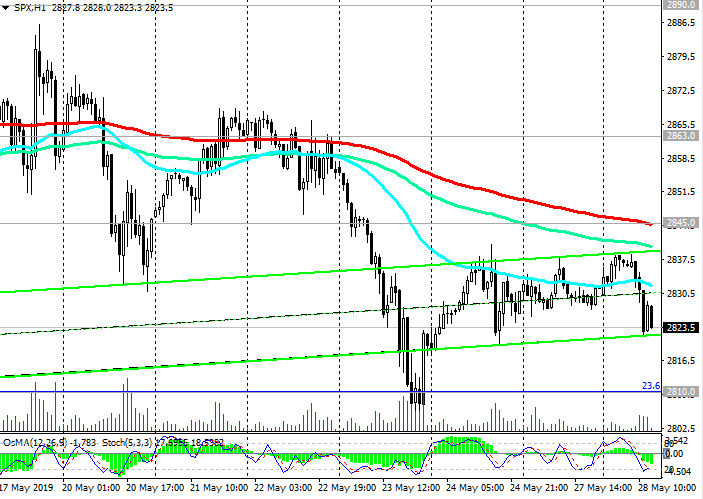
At the beginning of the European session on Tuesday, futures for the S&P500 index traded near the mark of 2825.0. Probably, the American session will also begin with the fall of the indices.
We are waiting for the publication of the consumer confidence index for May on Tuesday (14:00 GMT). The index is expected to grow (130.1 vs. 129.2 in April), which will support the dollar and US stock indices. If the data is weaker than the previous values, it will put additional pressure on US stock indices.
*)An advanced fundamental analysis is available on the Tifia Forex Broker website at tifia.com/analytics
Nevertheless, the positive dynamics of the S&P500 persists. The index is trading above key support levels of 2810.0 (Fibonacci 23.6% of the correction to the growth from December 2018 and 2335.0 mark), 2798.0 (EMA144 on the daily chart), 2781.0 (EMA200 on the daily chart). The breakdown of the short-term resistance level of 2845.0 (ЕМА200 on the 1-hour chart) will be a signal for the resumption of purchases with the long-term goal near the annual and absolute maximum of 2959.0.
Break of the key support level of 2781.0 will revive the bearish trend. For now, this is an unlikely scenario.
Support Levels: 2810.0, 2798.0, 2781.0, 2720.0
Resistance Levels: 2845.0, 2863.0, 2890.0, 2915.0, 2937.0, 2959.0
Trading Recommendations
Sell Stop 2805.0. Stop Loss 2850.0. Objectives 2800.0, 2780.0, 2720.0
Buy Stop 2850.0. Stop Loss 2805.0. Objectives 2863.0, 2890.0, 2915.0, 2937.0, 2959.0


 *) For up-to-date and detailed analytics and news on the forex market visit Tifia Forex Broker website tifia.com