WTI: Market Expectations
25/01/2019
The oil market traders seem to be confused due to a number of conflicting fundamental factors. The acute political crisis in Venezuela, which has the world's largest oil reserves on the one hand, and the growth of commercial oil reserves in the United States last week, as well as ongoing trade conflicts and a slowdown in the global economy, on the other hand, create multidirectional oil price vectors.
On Friday (19:00 GMT), a weekly report from the American oilfield services company Baker Hughes on the number of active oil drilling rigs in the United States will be published. Their number declined again in the previous week and currently stands at 852 units against the maximum of 887 units reached at the end of 2018. However, there is a recovery in oil prices after falling in the 4th quarter of 2018 (oil prices in the end of December hit bottom near the mark of 42.00 dollars per barrel of WTI crude oil). Rising oil prices create an incentive for American oil companies to increase production, which, in turn, is a deterrent to rising oil prices. The increase in the number of drilling rigs is a negative factor for oil prices.
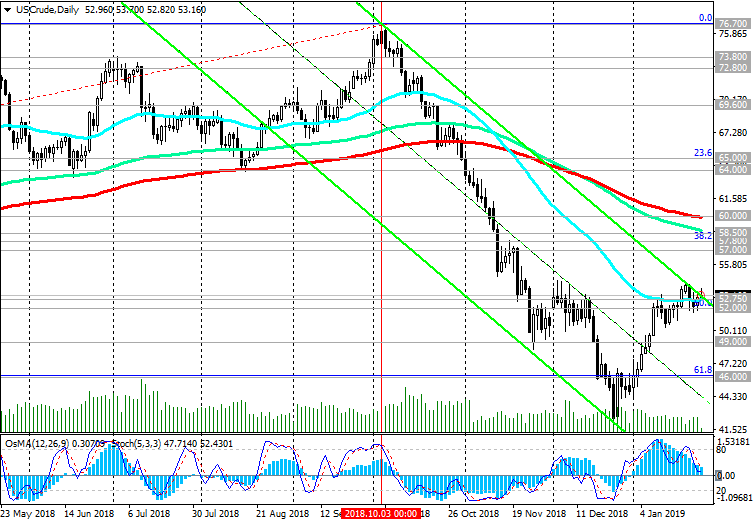
WTI crude oil prices reached important resistance levels near $ 52.75 per barrel (ЕМА50 on the daily chart, upper line of the downward channel on the daily chart).
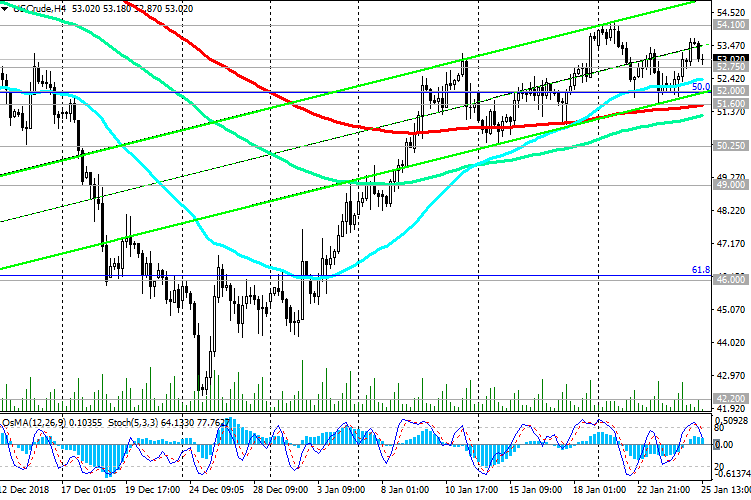
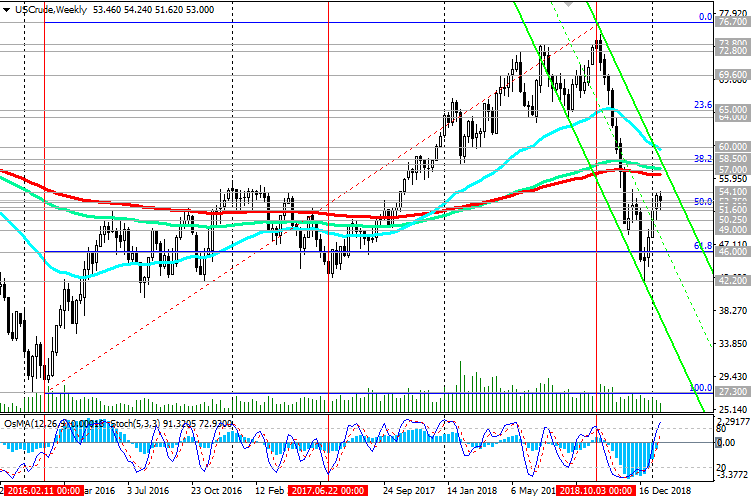
OsMA and Stochastic indicators on the 1-hour, 4-hour, daily charts recommend short positions.
Returning to the zone below 52.75 creates the risk of a resumption of the bearish trend that began in early October 2018.
Also, in the current price dynamics it is possible to distinguish a range with upper and lower lines passing through the marks 54.10, 50.25. Exit from this range can also determine the direction of further price movement.
*)An advanced fundamental analysis is available on the Tifia Forex Broker website at tifia.com/analytics
Support Levels: 52.00, 51.60, 50.25, 50.00, 49.00, 46.00, 42.20
Resistance Levels: 52.75, 54.10, 57.00, 57.80, 58.50, 60.00
Trading scenarios
Sell Stop 51.50. Stop Loss 54.20. Take-Profit 50.00, 49.00, 46.00, 42.00
Buy Stop 54.20. Stop Loss 51.50. Take-Profit 55.30, 56.60, 57.00, 57.80, 58.50, 59.40, 60.00
 *) For up-to-date and detailed analytics and news on the forex market visit Tifia Forex Broker website tifia.com