WTI: Support and Resistance Levels
09/01/2019
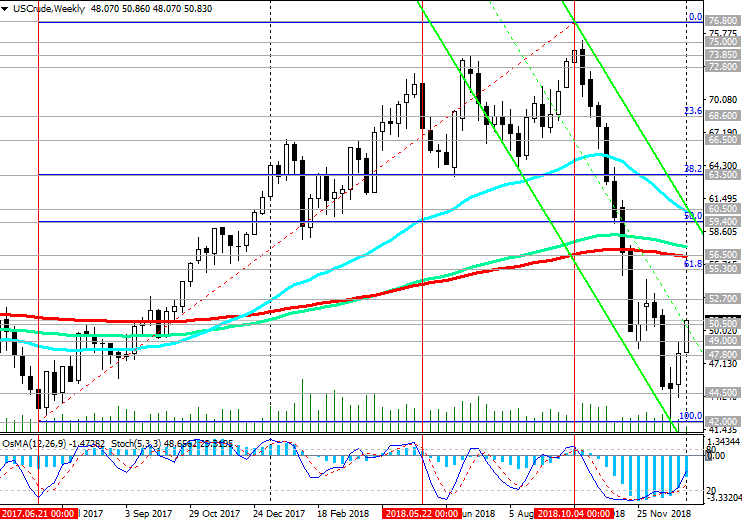
After in October, the price of WTI oil reached a multi-month and annual maximum near the mark of 76.80 dollars per barrel, then its sharp decline began.
In November, the WTI oil price broke the long-term bullish trend, breaking through the key support levels of 63.50 (Fibonacci 38.2% of the correction to the growth wave that began in February 2016 with the support level near the 27.30 mark), 56.50 (ЕМА200 on the weekly chart) . At the end of last month, the price reached a local and annual minimum near the mark of 42.00 dollars per barrel.
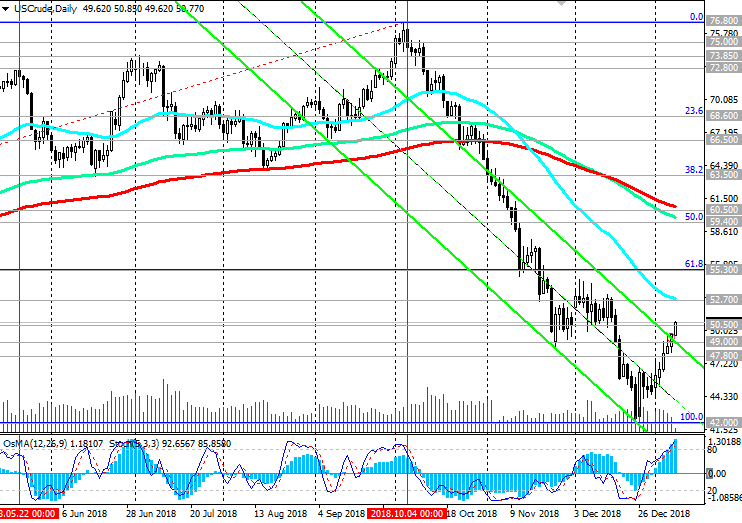
From this level there was a rebound, and the price tried to develop an upward trend.
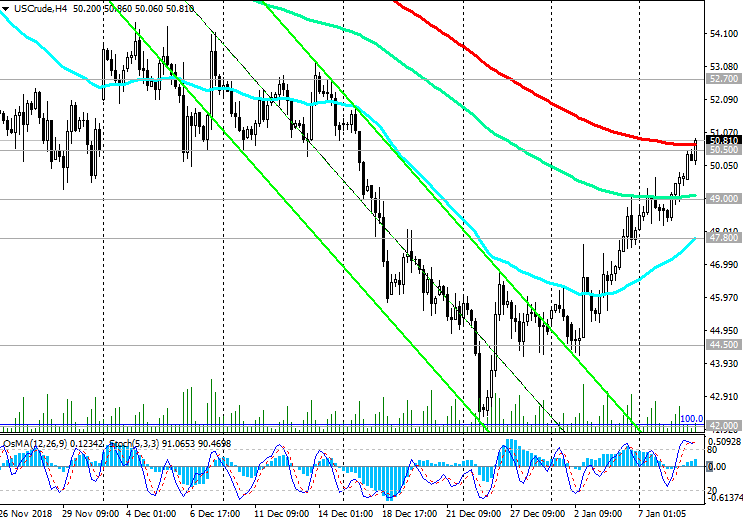
At the moment, corrective growth has stopped near the local resistance level of 50.50 (ЕМА200 on the 4-hour chart).
A signal for further growth will be the breakdown of this resistance level of 50.50. Medium-term growth targets are resistance levels of 59.40 (Fibonacci level 50%), 60.50 (ЕМА200 on the daily chart).
The breakdown of the short-term support level of 47.80 (ЕМА200 on the 1-hour chart) will return the prices of WTI crude oil to a bearish trend that began in October, with a target at the support level of 42.00 (Fibonacci 100% and the minimums of 2018 and 2017).
*)An advanced fundamental analysis is available on the Tifia Forex Broker website at tifia.com/analytics
Support Levels: 49.00, 47.80, 46.00, 44.50, 42.00
Resistance Levels: 50.50, 52.70, 55.30, 56.50, 59.40, 60.50, 63.50
Trading Scenarios
Sell Stop 48.80. Stop Loss 51.10. Take-Profit 47.80, 46.00, 44.50, 42.00
Buy Stop 51.10. Stop Loss 48.80. Take-Profit 52.70, 55.30, 56.50, 59.40, 60.50, 63.50
 *) For up-to-date and detailed analytics and news on the forex market visit Tifia Forex Broker website tifia.com