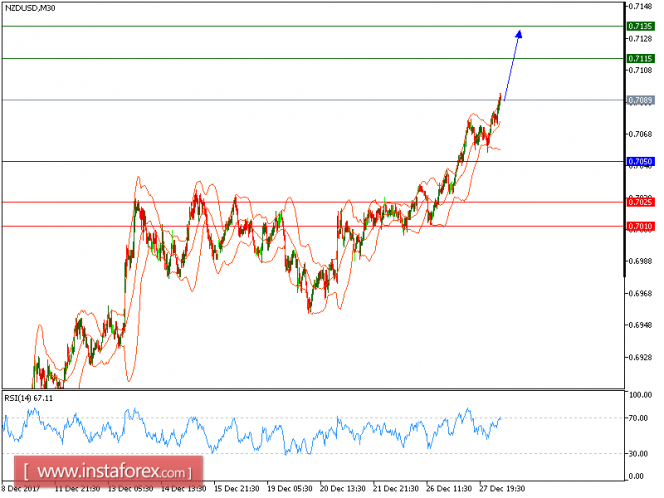
Our first upside target which we predicted in Yesterday's analysis has been hit. NZD/USD is still expected to continue its upside movement. The pair remains bullish above its key support at 0.7050 and is likely to challenge the next resistance at 0.7115. The rising 50-period moving average maintains the strong buying pressure on the prices. In addition, the relative strength index is above its neutrality area at 50.
In which case, as long as 0.7050 holds on the downside, look for further advance to 0.7115 and 0.7135 in extension.
The black line shows the pivot point. Currently, the price is above the pivot point, which is a signal for long positions. If it remains below the pivot point, it will indicate short positions. The red lines are showing the support levels and the green line is indicating the resistance levels. These levels can be used to enter and exit trades.
Resistance levels: 0.7050, 0.7070, and 0.7100
Support levels: 0.6970, 0.6950, and 0.6920