Forex Forums | ForexLasers.com |
|
|||||||
 |
|
|
LinkBack | Thread Tools | Search this Thread |
|
#241
 12-10-2017, 18:39
|
||||
|
||||
|
Recently, Gold has been trading upwards. The price tested the level of $1,297.50. According to the 15M time - frame, I found a successful testing of solid support at the price of $1,294.00, which is a sign that selling looks risky. The ADX indicator is above 30 level, which means that buyers are in control. My advice is to watch for potential buying opportuntiies. Upwards targets are set at the price of $1,297.50, 1,299.70 and $1,305.00.
Trading recommendations for today: watch for potential buying opportunities. 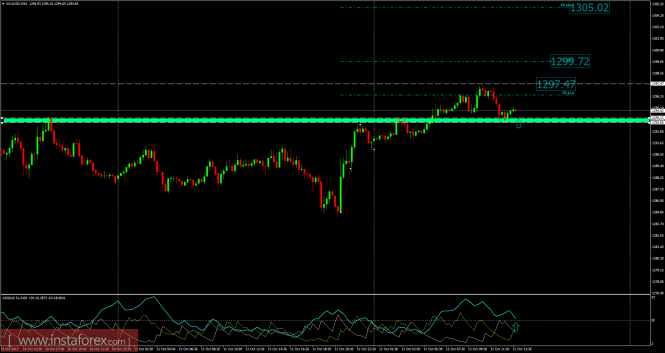 
|
|
#242
20-10-2017, 13:59
|
||||
|
||||
|
Overview
Gold price begins today's trading with a bearish bias, moving below 1,281.17 level after closing the daily candlestick below it. This puts the price under more expected negative pressure on the intraday basis, targeting 1,263.15 before attempting to return to rise again. Therefore, we expect more decline in the upcoming sessions supported by the negative pressure formed by the EMA50. Please note that stepping above 1,281.17 will stop the current negative pressure and push the price to regain its main bullish track again. The expected trading range for today is between 1,263.00 support and 1,285.00 resistance. 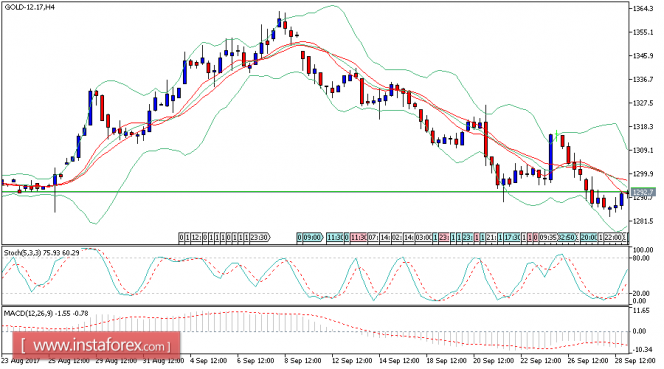
|
|
#243
27-10-2017, 19:37
|
||||
|
||||
|
Recently, the Gold has been trading downwards. The price tested the level of $1,264.00. According to the 15M time frame, I found that price is trading below the pivot level $1,271.00, which is a sign that sellers are in control today. There is also a hidden bearish divergence on the stochastic oscillator, which is another sign of weakness. My advice is to watch for potential selling opportunities. The downward targets are set at the price of $1,261.00 (S1) and $1,255.00 (S2).
Trading recommendations for today: watch for potential selling opportunities. 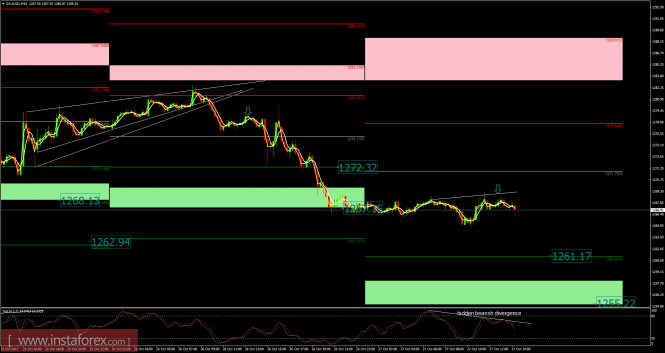
|
|
#244
27-10-2017, 19:52
|
||||
|
||||
|
Overview
The Gold price settled near our waited target at 1263.15, reminding you that this level represents 61.8% Fibonacci correction for the rise measured from 1204.81 to 1357.53, which means that breaking it will extend Gold price losses to reach 1240.85 direct, especially that the price moves within bearish channel supported by the EMA50. In general, we will continue to suggest the bearish trend in the upcoming sessions unless the price managed to breach 1281.20 level and hold above it, as this breach will push the price to start recovery attempts and regain the main bullish trend again, to start the positive targets at 1299.20 and extend to 1321.50. The expected trading range for today is between 1255.00 support and 1275.00 resistance. 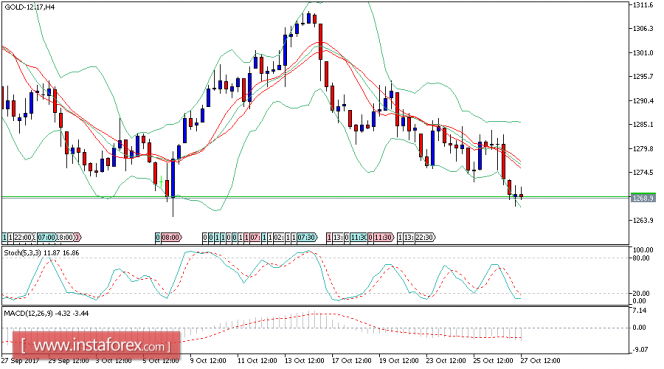
|
|
#245
01-11-2017, 00:59
|
||||
|
||||
|
Recently, gold has been trading sideways at the price of $1,273.50. According to the 15M timeframe, I found a broken support cluster and the pivot level lies at the price of $1,274.70, which is a sign that sellers are in control today. I also found a broken upward trendline in the background, which is another sign of weakness. My advice is to watch for potetnial selling opportunities. The downward targets are set at $1,270.60 (pivot support 1) and $1,265.00 (pivot support 2).
Trading recommendations for today: watch for potential selling opportunities. 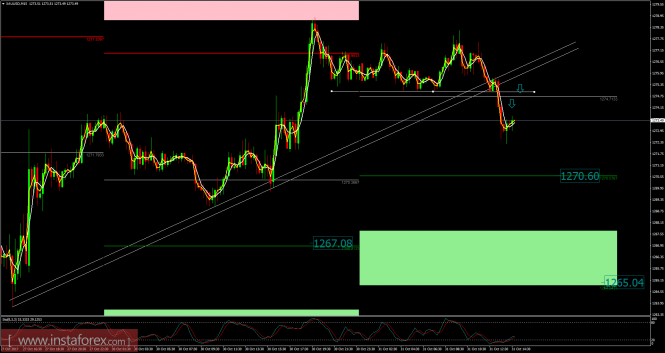
|
|
#246
02-11-2017, 04:15
|
||||
|
||||
|
Recently, the Gold has been trading sideways at the price of $1,274.00. According to the 15M time - frame, I found strong rejection from the upward trendline (re-test), which is sign that buying looks risky. The price also rejected near pivot resistance 2 at $1,282.00, which is another sign of weakness. My advice is to watch for potential selling opportunities. The downward targets are set at the price of $1,266.35 and at the price of $1,263.55.
Trading recommendations for today: watch for potential selling opportunities. 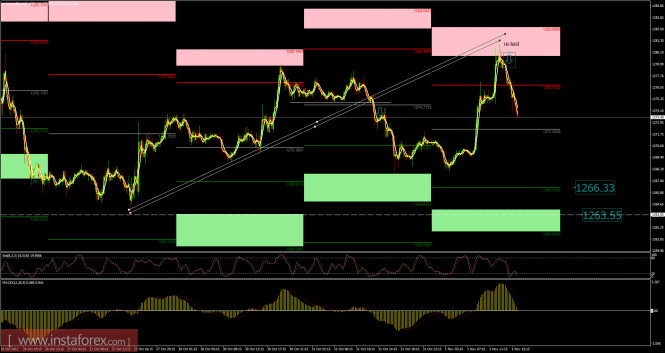
|
|
#247
02-11-2017, 22:43
|
||||
|
||||
|
Recently, the Gold has been trading sideways at the price of $1,276.20. According to the 15M time - frame, I found broken upward trendline in the background, which is a sign that buying looks risky. I also found a hidden bearish divergence on the MACD oscillator, which is another sign of weakness. My advice is to watch for potential selling opportunities. The downward targets are set at the price of $1,268.00 (pivot support 1) and at the price of $1,261.80 (pivot support 2).
Trading recommendations for today: watch for potential selling opportunities. 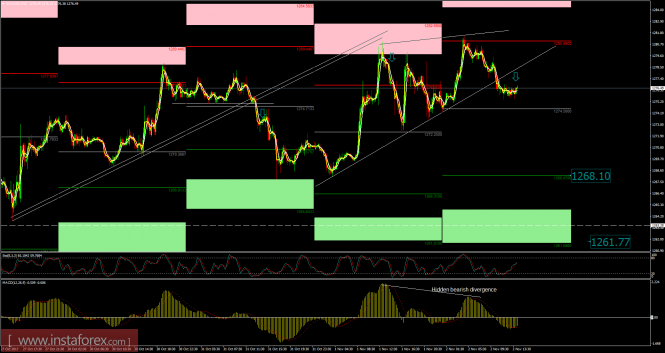
|
|
#248
08-11-2017, 15:07
|
||||
|
||||
|
Recently, Gold has been trading upwards. The price tested the level of $1,282.40. Anyway, according to the 15M time frame, I found successful rejection from pivot resistance 1 at the price of $1,280.70, which is sign that buying looks risky. I also found a hidden bearish divergence on the stochastic oscillator, which is another sign of weakness. My advice is to watch for potential selling opportunities. The downward targets are set at the price of $1,270.90 (pivot support 1) and at the price of $1,266.48 (pivot support 2).
Trading recommendations for today: watch for potential selling opportunities. 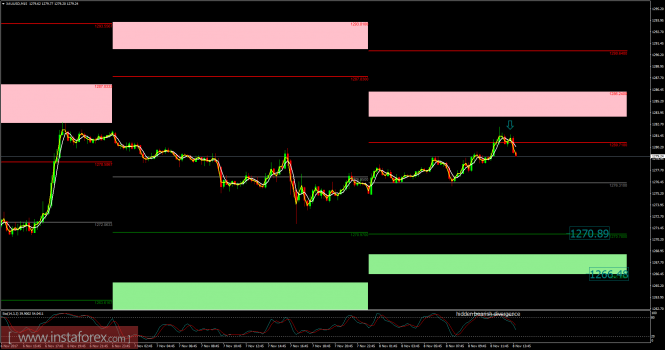
|
|
#249
14-11-2017, 18:48
|
||||
|
||||
|
Recently, Gold has been trading downwards. As I expected, the price tested the level of $1,270.00. According to the 30M time frame, I found broken bearish flag in the background, which is sign that buying looks risky. I also found successful testing of supply trendline (downward channel), which is another sign of weakness. My advice is to watch for potential selling opportunities. I placed Fibonacci expansion to find potential downward targets. I got FE 100% at the price of $1,265.15 and FE 161.8% at the price of $1.256.00.
Trading recommendations for today: watch for potential selling opportunities. 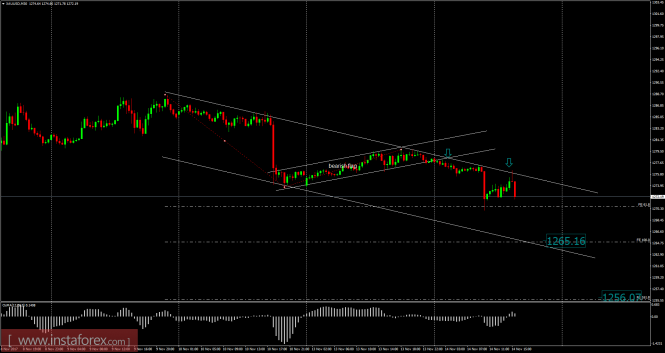
|
|
#250
24-11-2017, 00:31
|
||||
|
||||
|
Overview
Gold price settled near 1,290.00 level after the bullish rally yesterday. Please note that stochastic shows a clear overbought level, which might force the price for some temporary sideways trading until getting enough positive momentum to confinue the bulish trend. In general, the bullish scenario remains valid if the price settles above 1,281.17 and 1,274.00 level. Our first target is seen at 1,299.20 and breaching it will push the price to extend its gains to 1,321.50 directly. The expected trading range for today is between 1,280.00 support and 1,300.00 resistance. 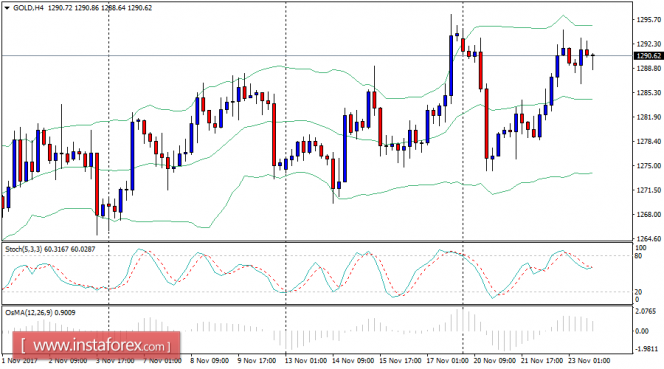
|
|
#251
24-11-2017, 12:59
|
||||
|
||||
|
Overview
Gold price begins today's trading with calm positivity after a slight decline yesterday. We are waiting until gold tests 1,299.20 level initially. Let me remind you that breaching this level will confirm a further bullish wave towards 13,21.50 directly. In general, we will keep our bullish expectations on the intraday basis conditioned by settling above 1,281.17. Please note that the EMA50 keeps supporting the suggested bullish wave by carrying the price from below. The expected trading range for today is between 1,280.00 support and 1,305.00 resistance. 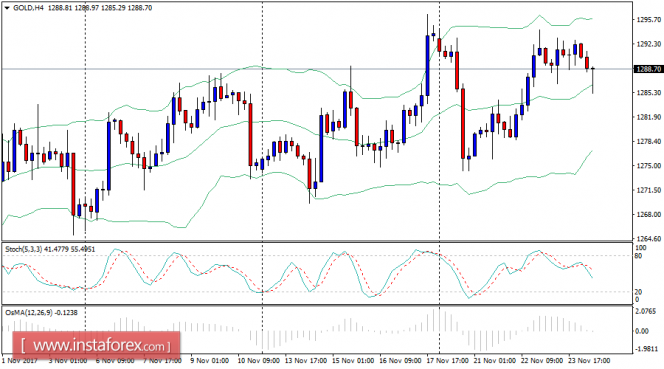
|
|
#252
29-11-2017, 21:22
|
||||
|
||||
|
Overview
Gold price opens today's trading with a slight bullish bias to approach the key resistance of 1,299.20. As we mentioned in our recent articles, the price needs to breach this level to confirm a further bullish wave towards our next positive target at 1,321.50. In general, we still suggest the bullish trend in the upcoming sessions on the grounds of the EMA50 and stochastic. Let me remind you that breaking 1,281.17 will stop the suggested rise and push the price to test 1,263.15 areas before any new attempt to climb. The expected trading range for today is between 1,285.00 support and 1,310.00 resistance. 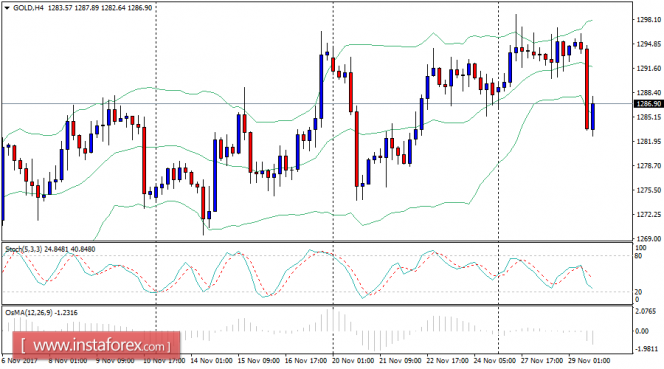
|
|
#253
04-12-2017, 20:06
|
||||
|
||||
|
Recently, Gold has been trading downwards. The pirce tested the level of $1,271.00. According to the 1H time frame, I found a strong support cluster at the price of $1,270.00 and my advice is to be careful selling at this point. Besides, stochastic oscillator is in the oversold zone, which is another sign of stregnth. My advice is to watch for potential buying opportunities. The upward targets are set at the price of $1,286.00 and at the price of $1,289.00.
Trading recommendations for today: watch for potential buying opportunities. 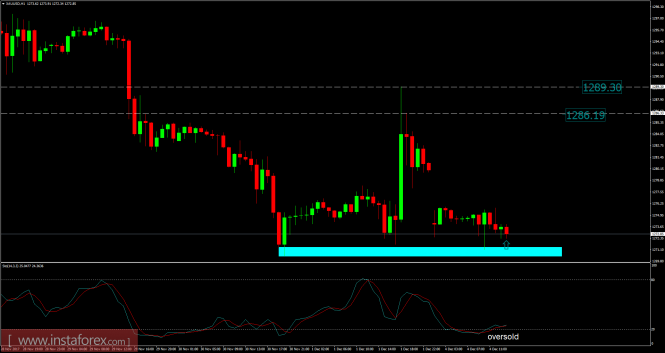
|
|
#254
07-12-2017, 21:23
|
||||
|
||||
|
Recently, Gold has been trading downwards. The price tested the level of $1,265.45. According to the 15M time frame, I found testing of Fibonacci retracement 38.2%, which is a sign that selling at this stage looks risky. I also found oversold conditions on the stochastic oscillator, which is another sign of strength. My advice is to watch for potential buying opportunities. The upward targets are set at the price of $1,274.90 and at the price of $1,283.90.
Trading recommendations for today: watch for potential buying opportunities. 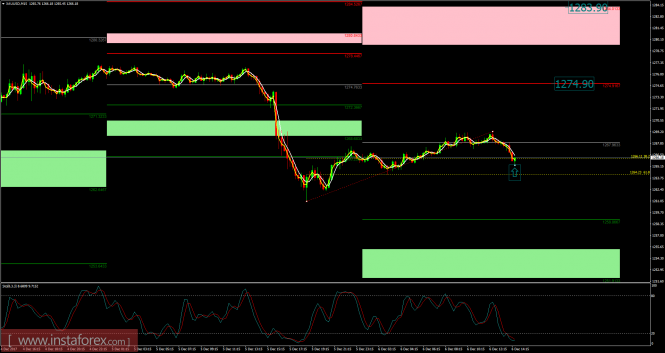
|
|
#255
14-12-2017, 15:46
|
||||
|
||||
|
Overview Gold price has settled at the key support of $1,240.85 after attempting to break it yesterday. Please note that stochastic loses its bullish momentum clearly to approach the overbought areas while the EMA50 keeps pushing the price down. Therefore, these factors encourage us to confirm the outlook for the bearish trend in the upcoming sessions.
Please note that breaking the mentioned support will open the way to target $1,204.81 on the short-term basis, while breaching $1,263.15 represents the first positive key to start recovery attempts and regain the main bullish trend again. The expected trading range for today is between $1,230.00 support and $1,255.00 resistance. 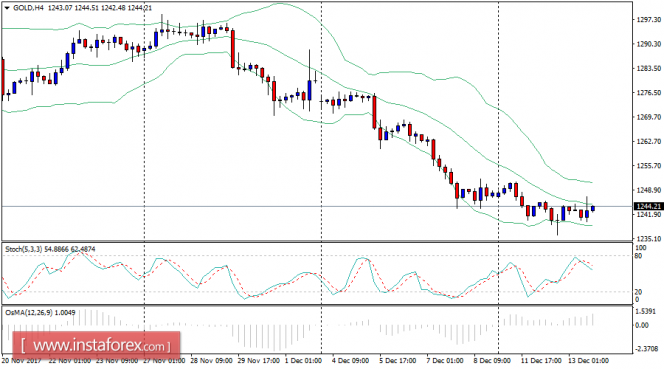
|
|
#256
19-12-2017, 19:20
|
||||
|
||||
|
Gold price continues to make higher highs in the short-term as yesterday price broke above $1,262 to a marginal new high at $1,264. Short-term trend is bullish and changes only if price breaks below $1,255.
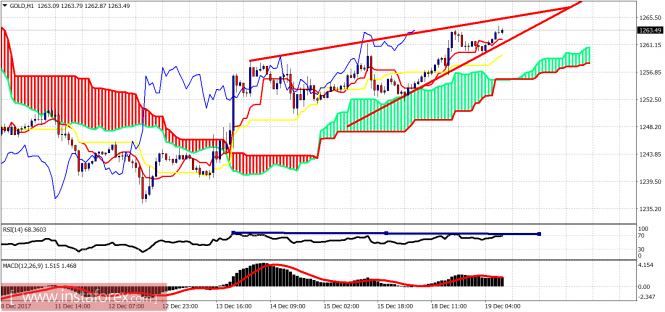 Red lines - wedge pattern Gold price is trading above the 4-hour Kumo (cloud). Support is at $1,257. Wedge support is at $1,261. Resistance is at $1,265-66. I do not believe Gold price has much more upside. I expect Gold to reverse lower soon. 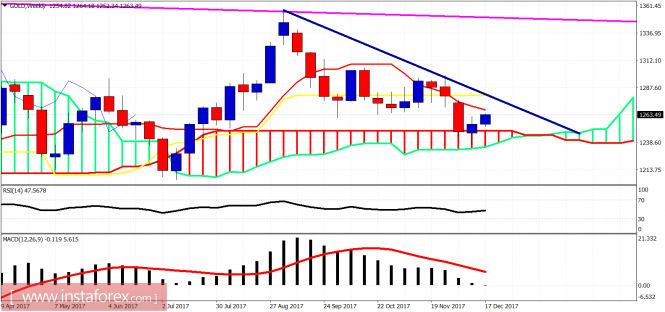 Blue line - resistance trend line Gold price is trading above the weekly Kumo (cloud) and has bounced off of it as expected. Gold price is however below both the tenkan- and the kijun-sen. As long as price is below these two indicators and the blue trend line, I will be expecting price to move towards $1,200-$1,220 for a final new low.
|
|
#257
27-12-2017, 17:26
|
||||
|
||||
|
Overview
Gold price resumes its positive trading to move away from 1,281.17 level, which supports the continuation of our bullish trend expectations efficiently in the upcoming sessions. The way is open to visit 1,299.20 level that represents our next main target. Continuation of the expected rise depends on holding above 1,272.00 and 1,263.15 levels. The expected trading range for today is between 1,272.00 support and 1,292.00 resistance. 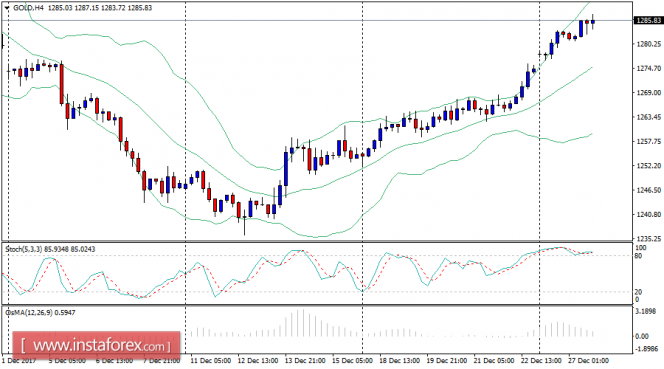
|
|
#258
03-01-2018, 20:28
|
||||
|
||||
|
Recently, gold has been trading upwards. The price tested the level of $1,320.80. According to the 30M time frame, I found a successful rejection from the Fibonacci retracement 50% at the price of $1,311.00, which is a sign that selling looks risky. The short-term trend is bullish and my advice is to watch for potential buying opportunities. The upward targets are set at the price of $1,323.00 and at the price of $1,330.00.
Trading recommendations for today: watch for potential buying opportunities. 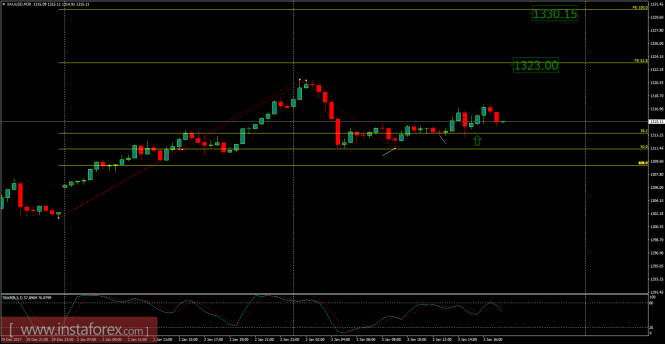
|
|
#259
05-01-2018, 19:03
|
||||
|
||||
|
Overview
The gold price returns to decline and moves below 1,321.49 levels, postponing the positive scenario suggested in the morning. The price is affected by stochastic negativity and is waiting to get enough positive momentum to resume the bullish bias and breach the mentioned level, keeping the main bullish trend. In general, we still expect the bullish trend on the intraday and short-term basis, unless breaking and holding the 1,299.20 level with a daily close below it. Our next target is located at 1,357.53. The expected trading range for today is between the 1,310.00 support and the 1,335.00 resistance. 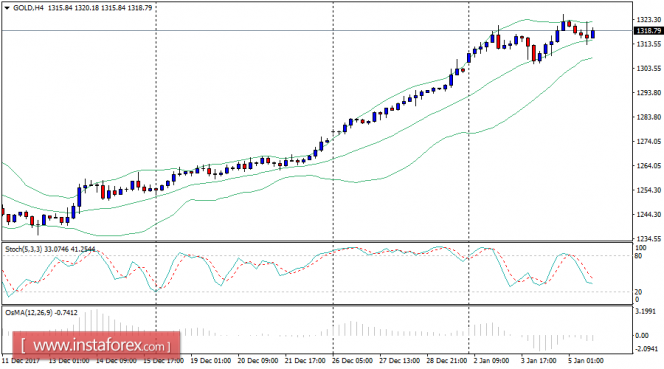
|
|
#260
11-01-2018, 04:09
|
||||
|
||||
|
Overview
The gold price shows slight bearish bias on its way to testing the EMA50. As long as the price is above 1,299.20, our bullish overview will remain valid for today, reminding you that we need a breach of 1,321.49 for the price to head towards 1,357.53. Meanwhile, stochastic heads towards the oversold areas now in attempt to gain positive momentum that will help the price rise. The expected trading range for today is between the 1,310.00 support and the 1,335.00 resistance. 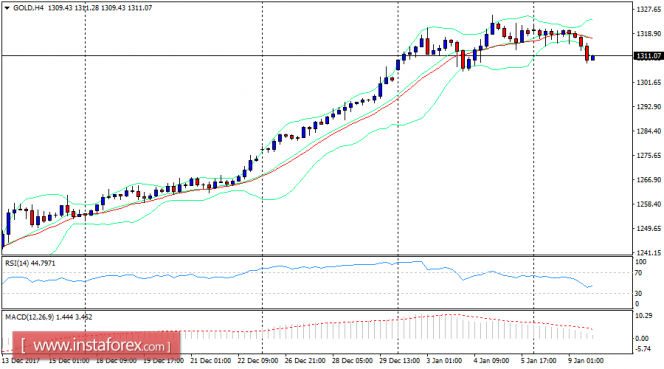
|
|
#261
12-01-2018, 15:24
|
||||
|
||||
|
Recently, gold has been trading upwards. The price tested the level of $1,333.15. According to the 4H time frame, I found a broken 7-day rectangle, which is a sign that buyers are in control. My advice is to watch for potential buying opportunities. The upward projcted targets for the rectangle pattern are set at $1,341.00 and $1,348.00.
Trading recommendations for today: watch for potential buying opportunities. 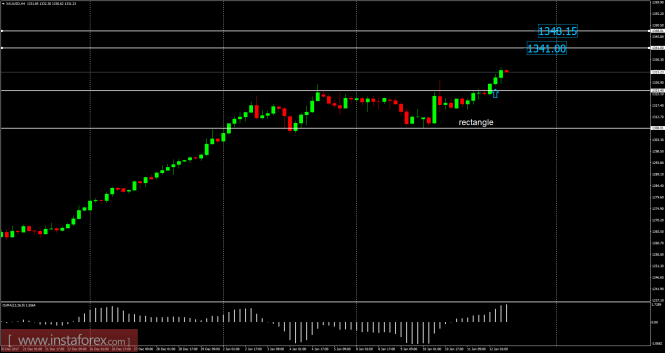
|
|
#262
17-01-2018, 16:40
|
||||
|
||||
|
Recently, Gold has been trading sideways at the price of $1,337.00. According to the 30M time - frame, I found that price rejected of the pivot support at $1,332.00, which is a sign that selling looks risky. I also found positive readings on MACD oscillator, which is another sign of strength. Short-term trend is still bullish. My advice is to watch for potential buying opportunities. The upward targets are set at the price of $1,343.15 and at the price of $1,347.80.
Trading recommendations for today: watch for potential buying opportunities. 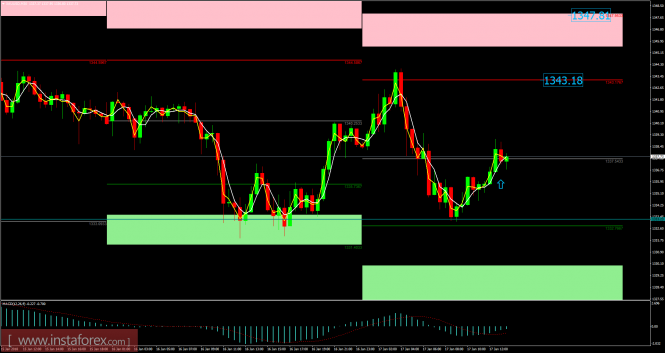
|
|
#263
23-01-2018, 14:15
|
||||
|
||||
|
Recently, the Gold has been trading upwards. As I expected, the price tested the level of $1,388.00. According to the 30M time frame, I found potential bearish pennant pattern in creation, which is a sign of potential weakness. I also found a hidden bearish divergence on the stochastic oscillator, which is another sign of weakness. My advice is to watch for potential selling opportunities if you see the breakout of the support trendline. The downward targets are set at the price of $1,332.00 and at the price of $1,320.79.
Trading recommendations for today: watch for potential selling opportunities. 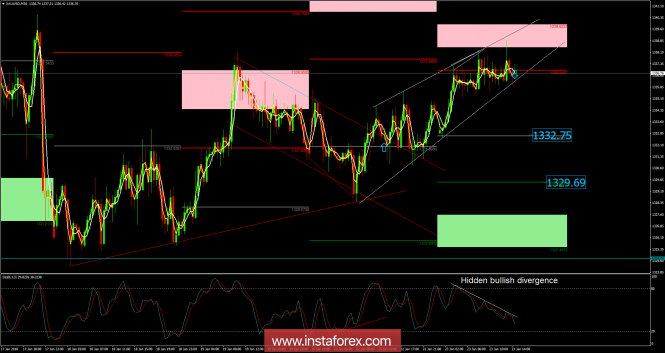
|
|
|
|
 Similar Threads
|
||||
| Thread | Thread Starter | Forum | Replies | Last Post |
| Daily technical analysis of EUR/NZD By INSTAFOREX | InstaForex | Forex Analysis | 319 | 19-01-2018 10:37 |
| Daily technical analysis of EUR/JPY By INSTAFOREX | InstaForex | Forex Analysis | 358 | 19-01-2018 10:34 |
| Daily Technical Analysis | dailyfxanalysis | Forex Analysis | 10 | 15-05-2013 10:27 |
| Technical Analysis (Update Daily) | alhadi | Forex Analysis | 0 | 13-09-2012 09:26 |
| Daily Technical Analysis for Majors | FxTT | Forex Analysis | 0 | 01-03-2012 06:50 |


